
Your Briefings
Explore a Scoop Performance Briefing
Follow a district finding into the evidence, the visit question, and the manager's response
A Scoop performance briefing gives managers a conclusion, the evidence behind it, and a practical next step. This example follows one district of eight stores from its overall result into two different location investigations.
Illustrative retail example. The locations, figures, and recommendations are fictional. The images use the current Scoop portal components.
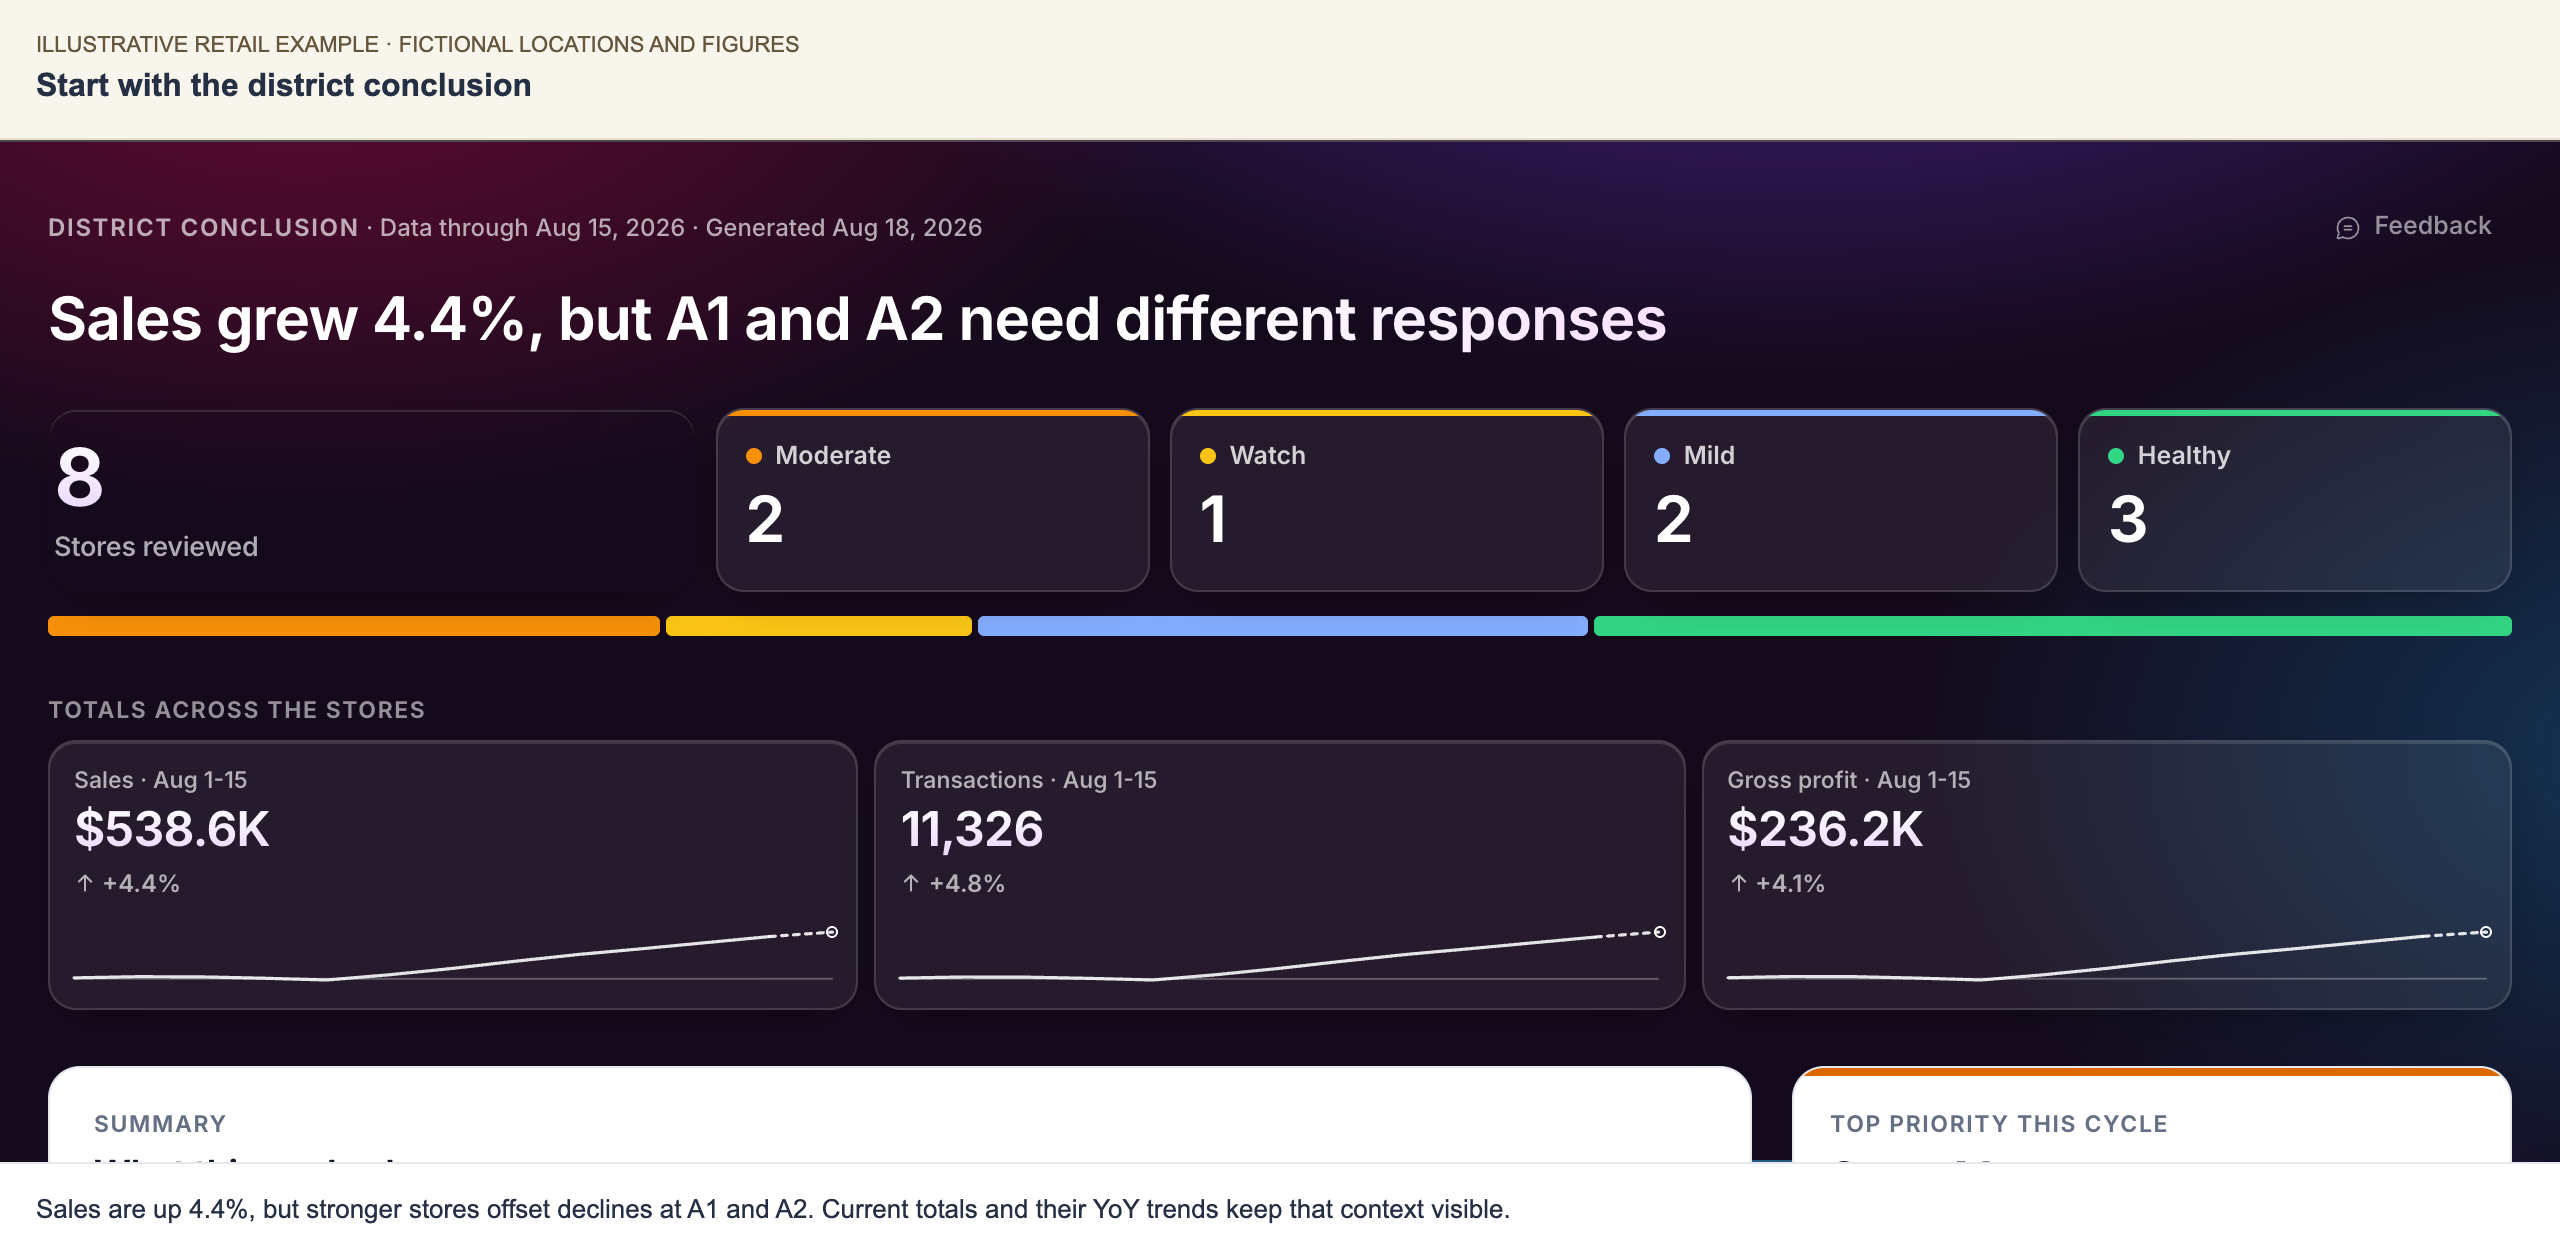
1. Start with the conclusion
District A's sales grew 4.4%, to $538,560, for August 1–15 compared with the same days last year. Growth at stronger stores offsets declines at A1 and A2.
The district opening combines the conclusion, location severity, and totals with their recent YoY trends. The reporting cutoff and generation date are separate.
The first management decision is where to focus attention. A1 and A2 both lost roughly 9% of sales, but sending the same instruction to both managers would miss the difference.
2. Compare the pattern across locations
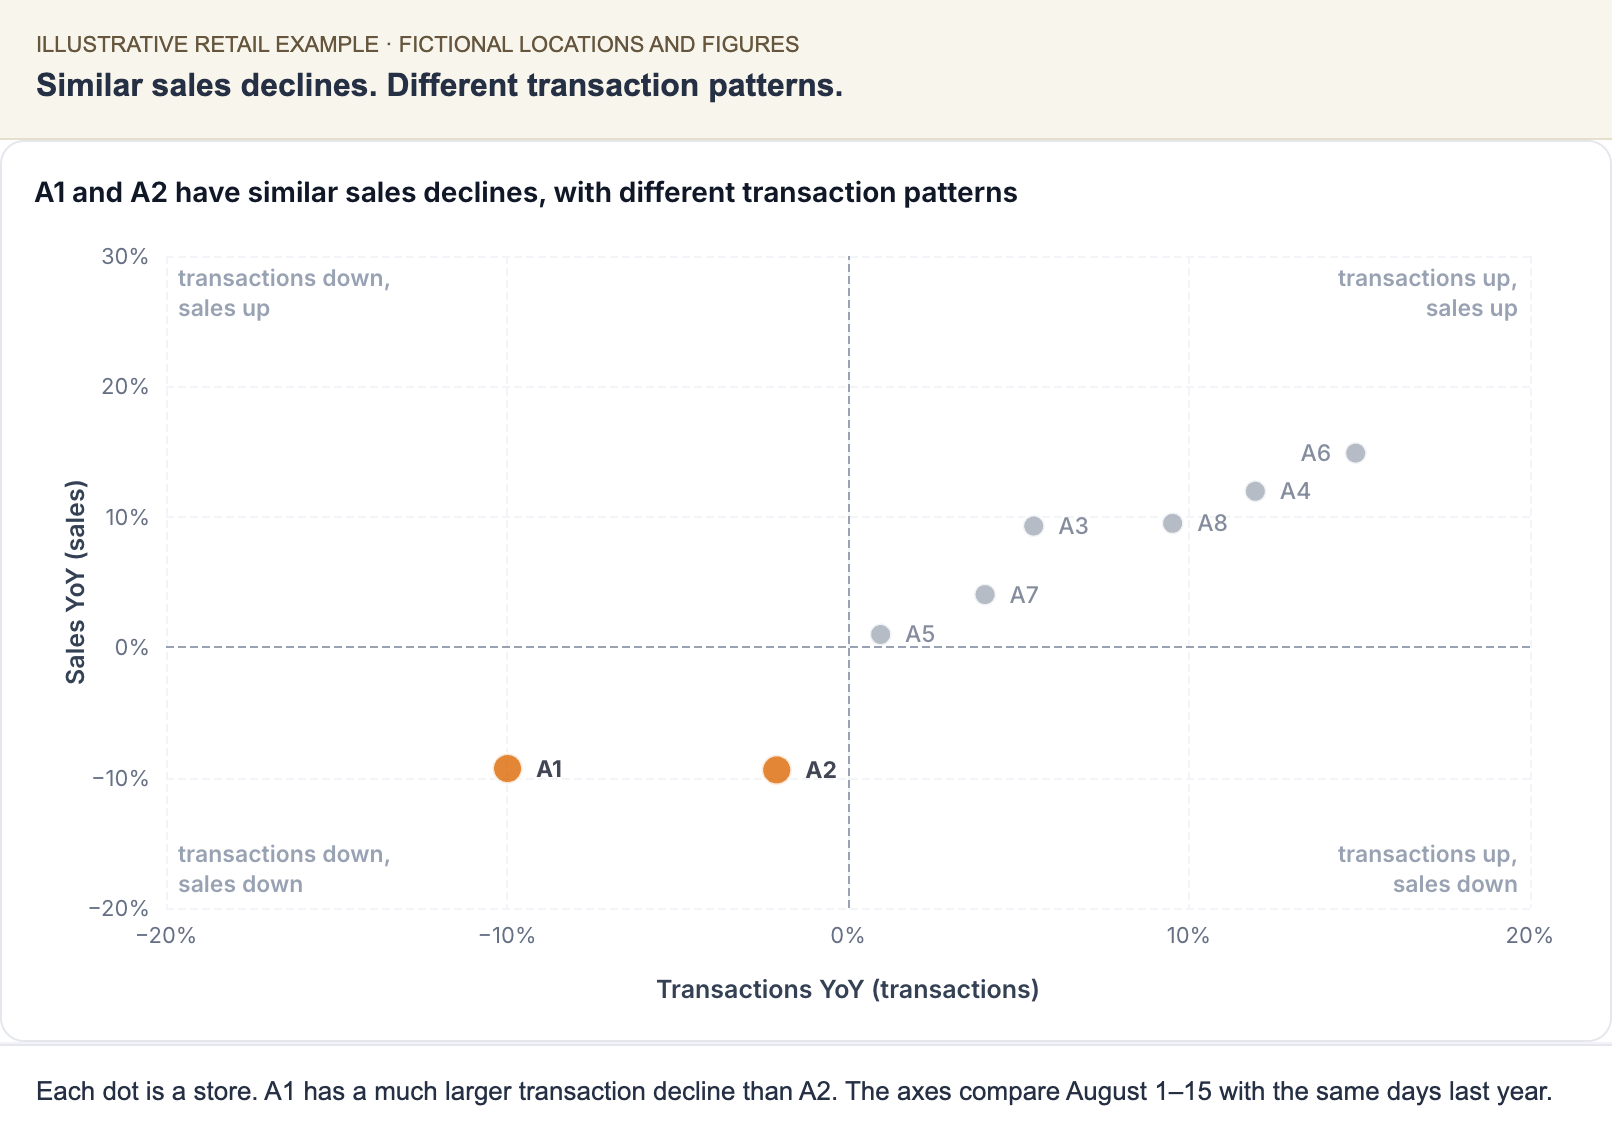
Each dot represents a store. A1 and A2 sit at similar sales declines but different transaction changes. Lines at zero separate growth from decline on each measure.
A1's transactions fell 10.0%. A2's transactions fell 2.1%. Something different is happening to the value of A2's transactions. The scorecard adds the measures needed to inspect that difference.
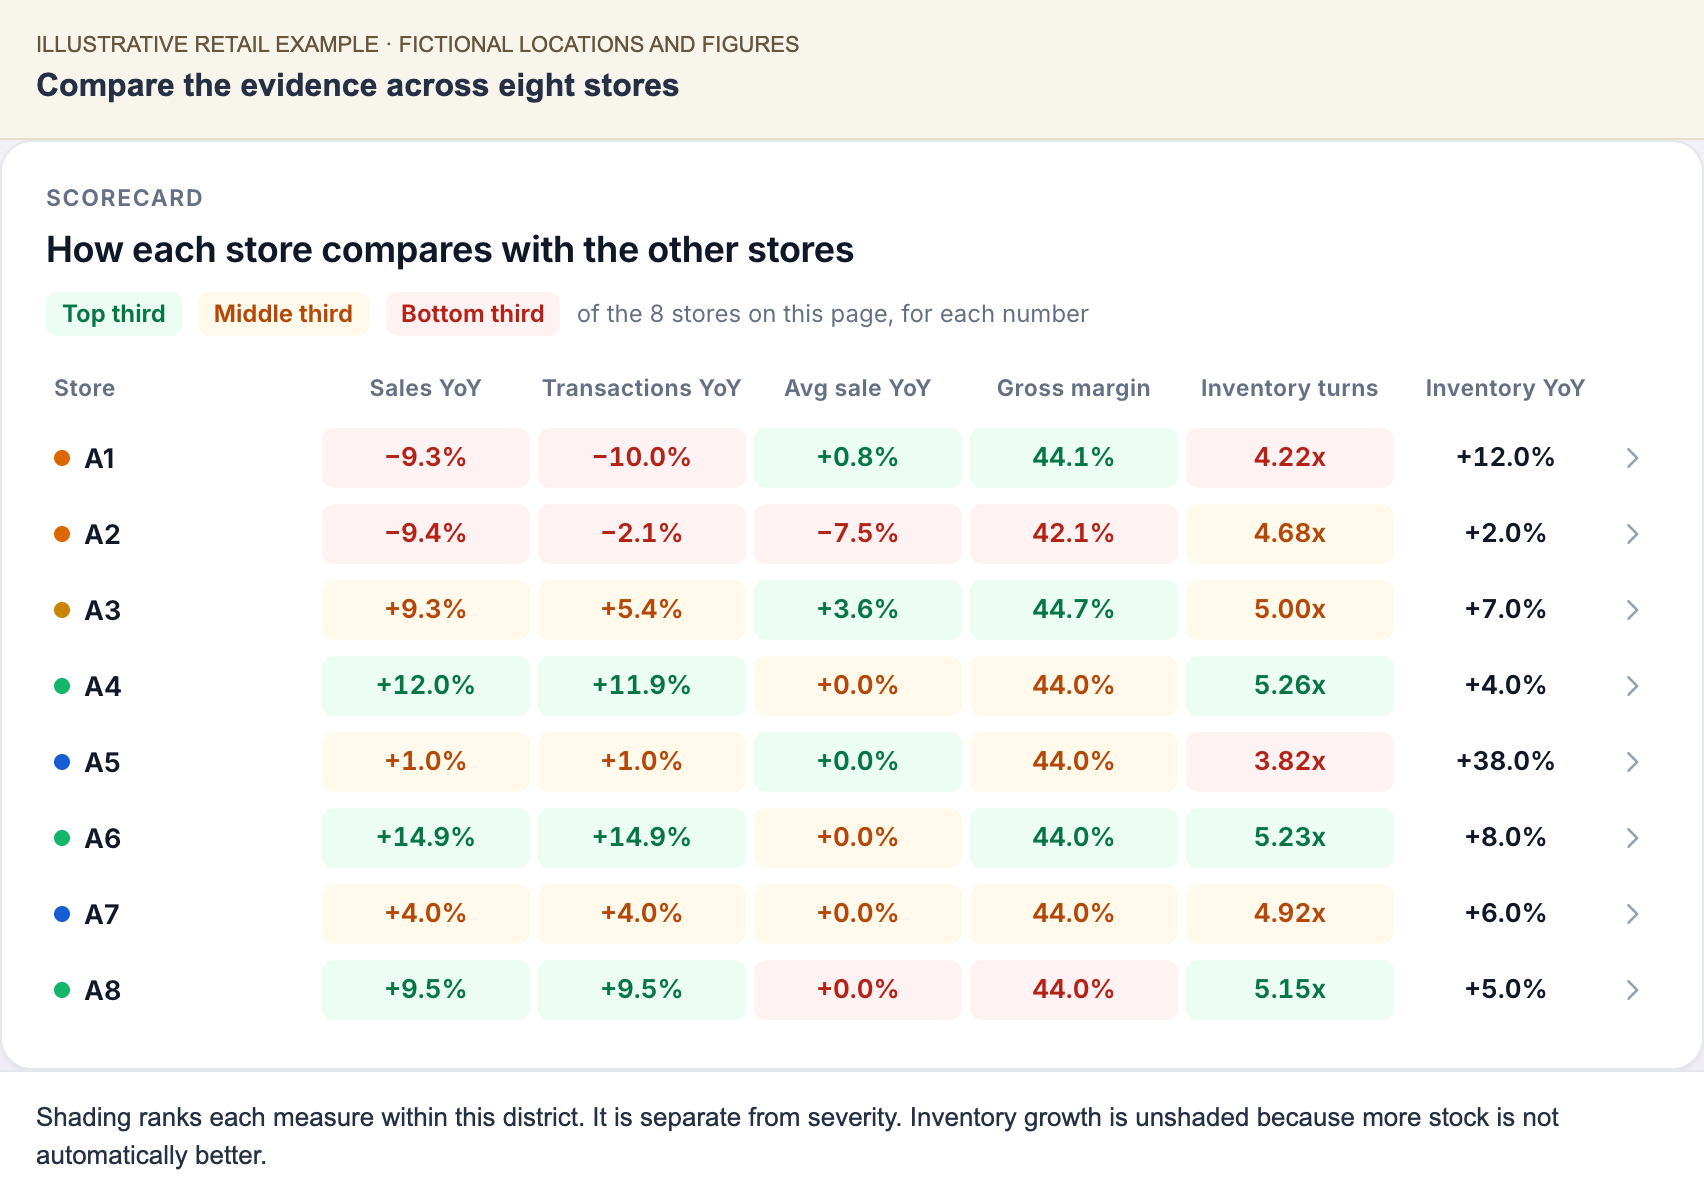
Shading shows relative standing for each measure among these stores. It is separate from severity. Inventory change is unshaded: more stock does not automatically mean better performance.
| Measure | Store A1 | Store A2 | What it changes about the investigation |
|---|---|---|---|
| Sales, YoY | −9.3% | −9.4% | The headlines look similar |
| Transactions, YoY | −10.0% | −2.1% | A1 has the larger volume decline |
| Average sale, YoY | +0.8% | −7.5% | A2 needs a closer look at transaction value and mix |
| Gross margin, current | 44.1% | 42.1% | A2 also needs the category margin context |
3. Open A1's briefing
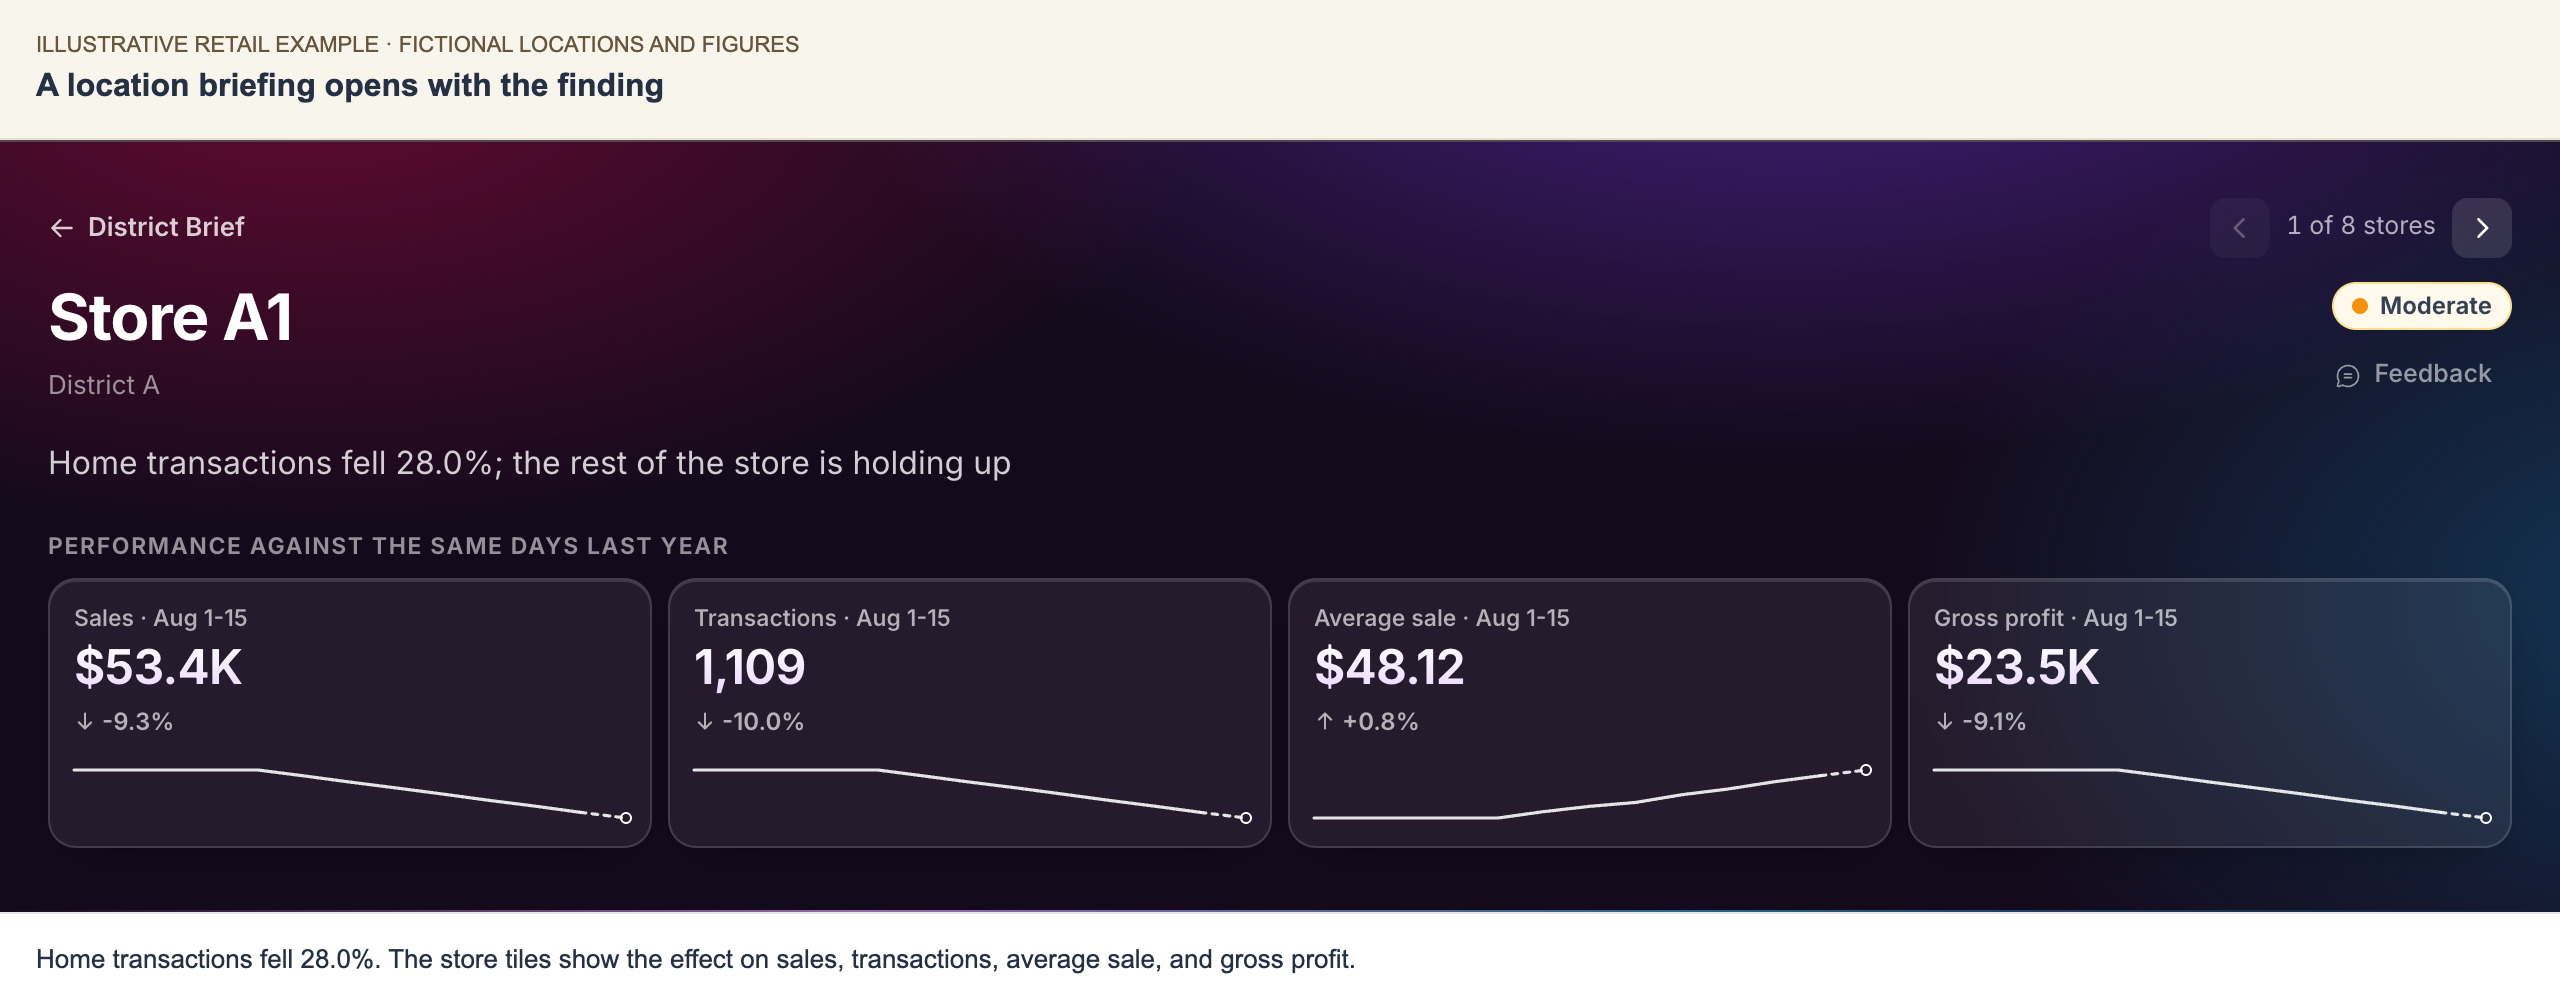
A location briefing opens with its own finding and key figures. A1's Home transactions fell 28.0%; the other categories held up.
The total sales decline is now a specific operating question. Where did A1 lose transactions, and what should the manager inspect during a visit?
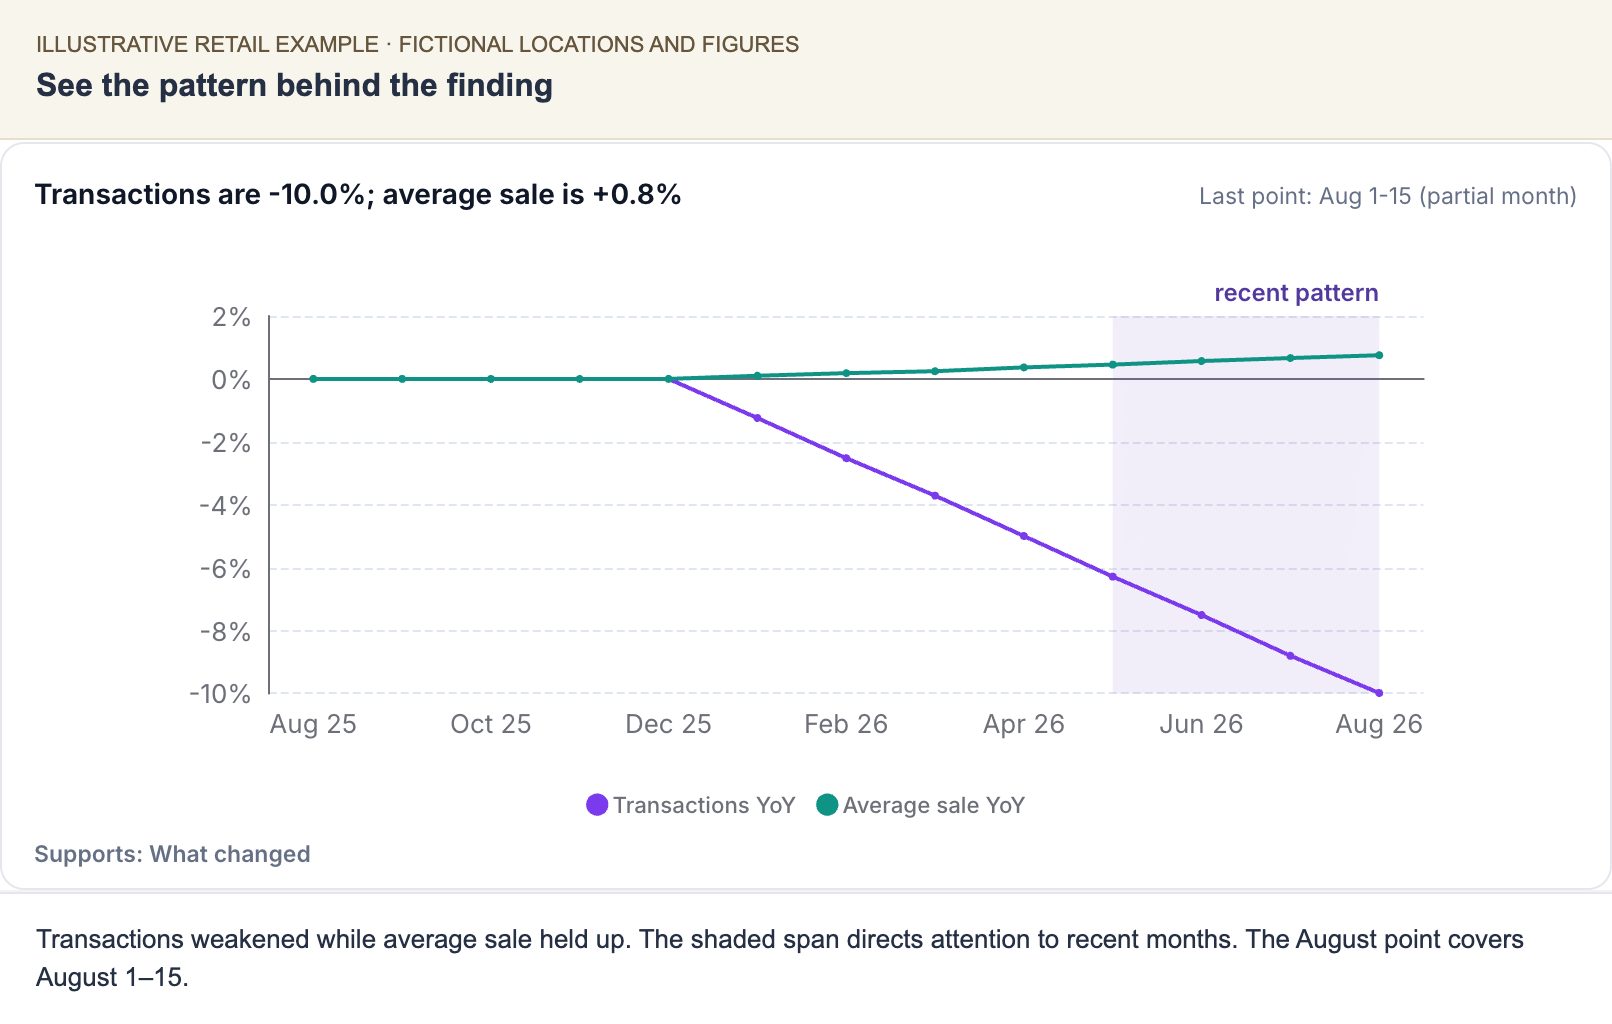
Transactions weaken while average sale holds up. The marked span directs attention to recent months; the final point covers August 1–15.
The category view narrows the question further.
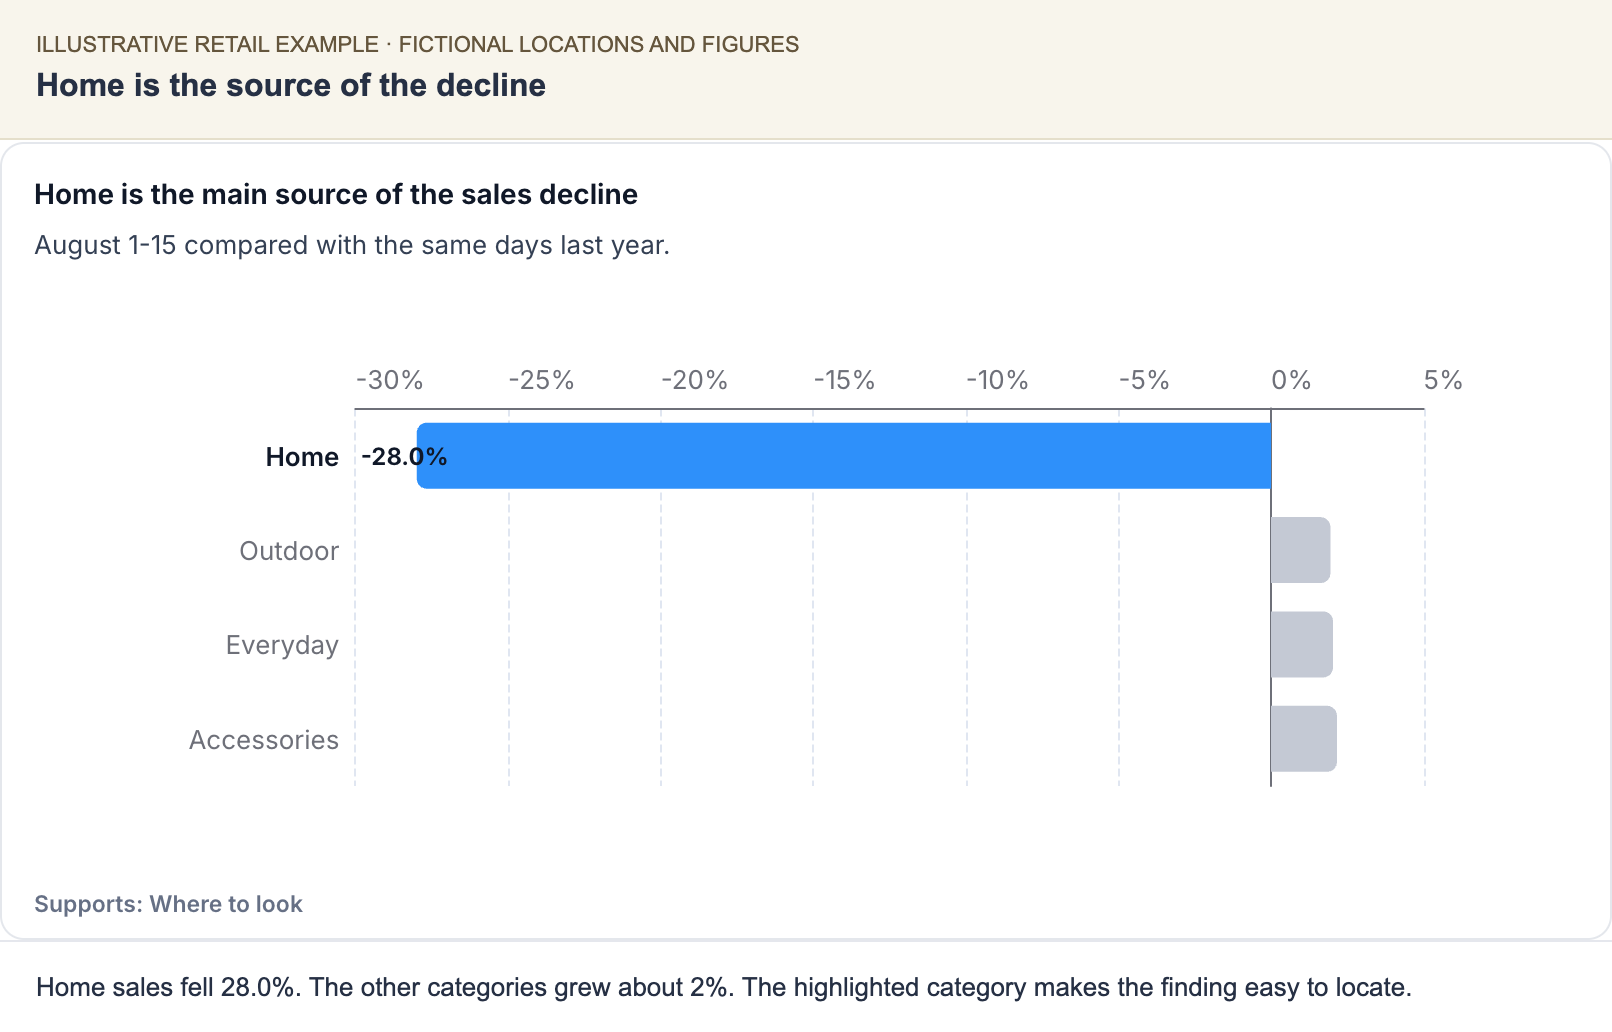
Home accounts for the decline. The title states the finding and the marker identifies its supporting category.
Home sales fell from $22,185 to $15,975. Its transactions fell from 493 to 355, while average sale within Home stayed at $45. The other categories grew about 2%.
These figures establish a loss of Home transaction volume. They do not establish whether the cause was availability, traffic, conversion, or another operating condition. The manager has a focused question to resolve with the team.
4. Turn the finding into work for the visit
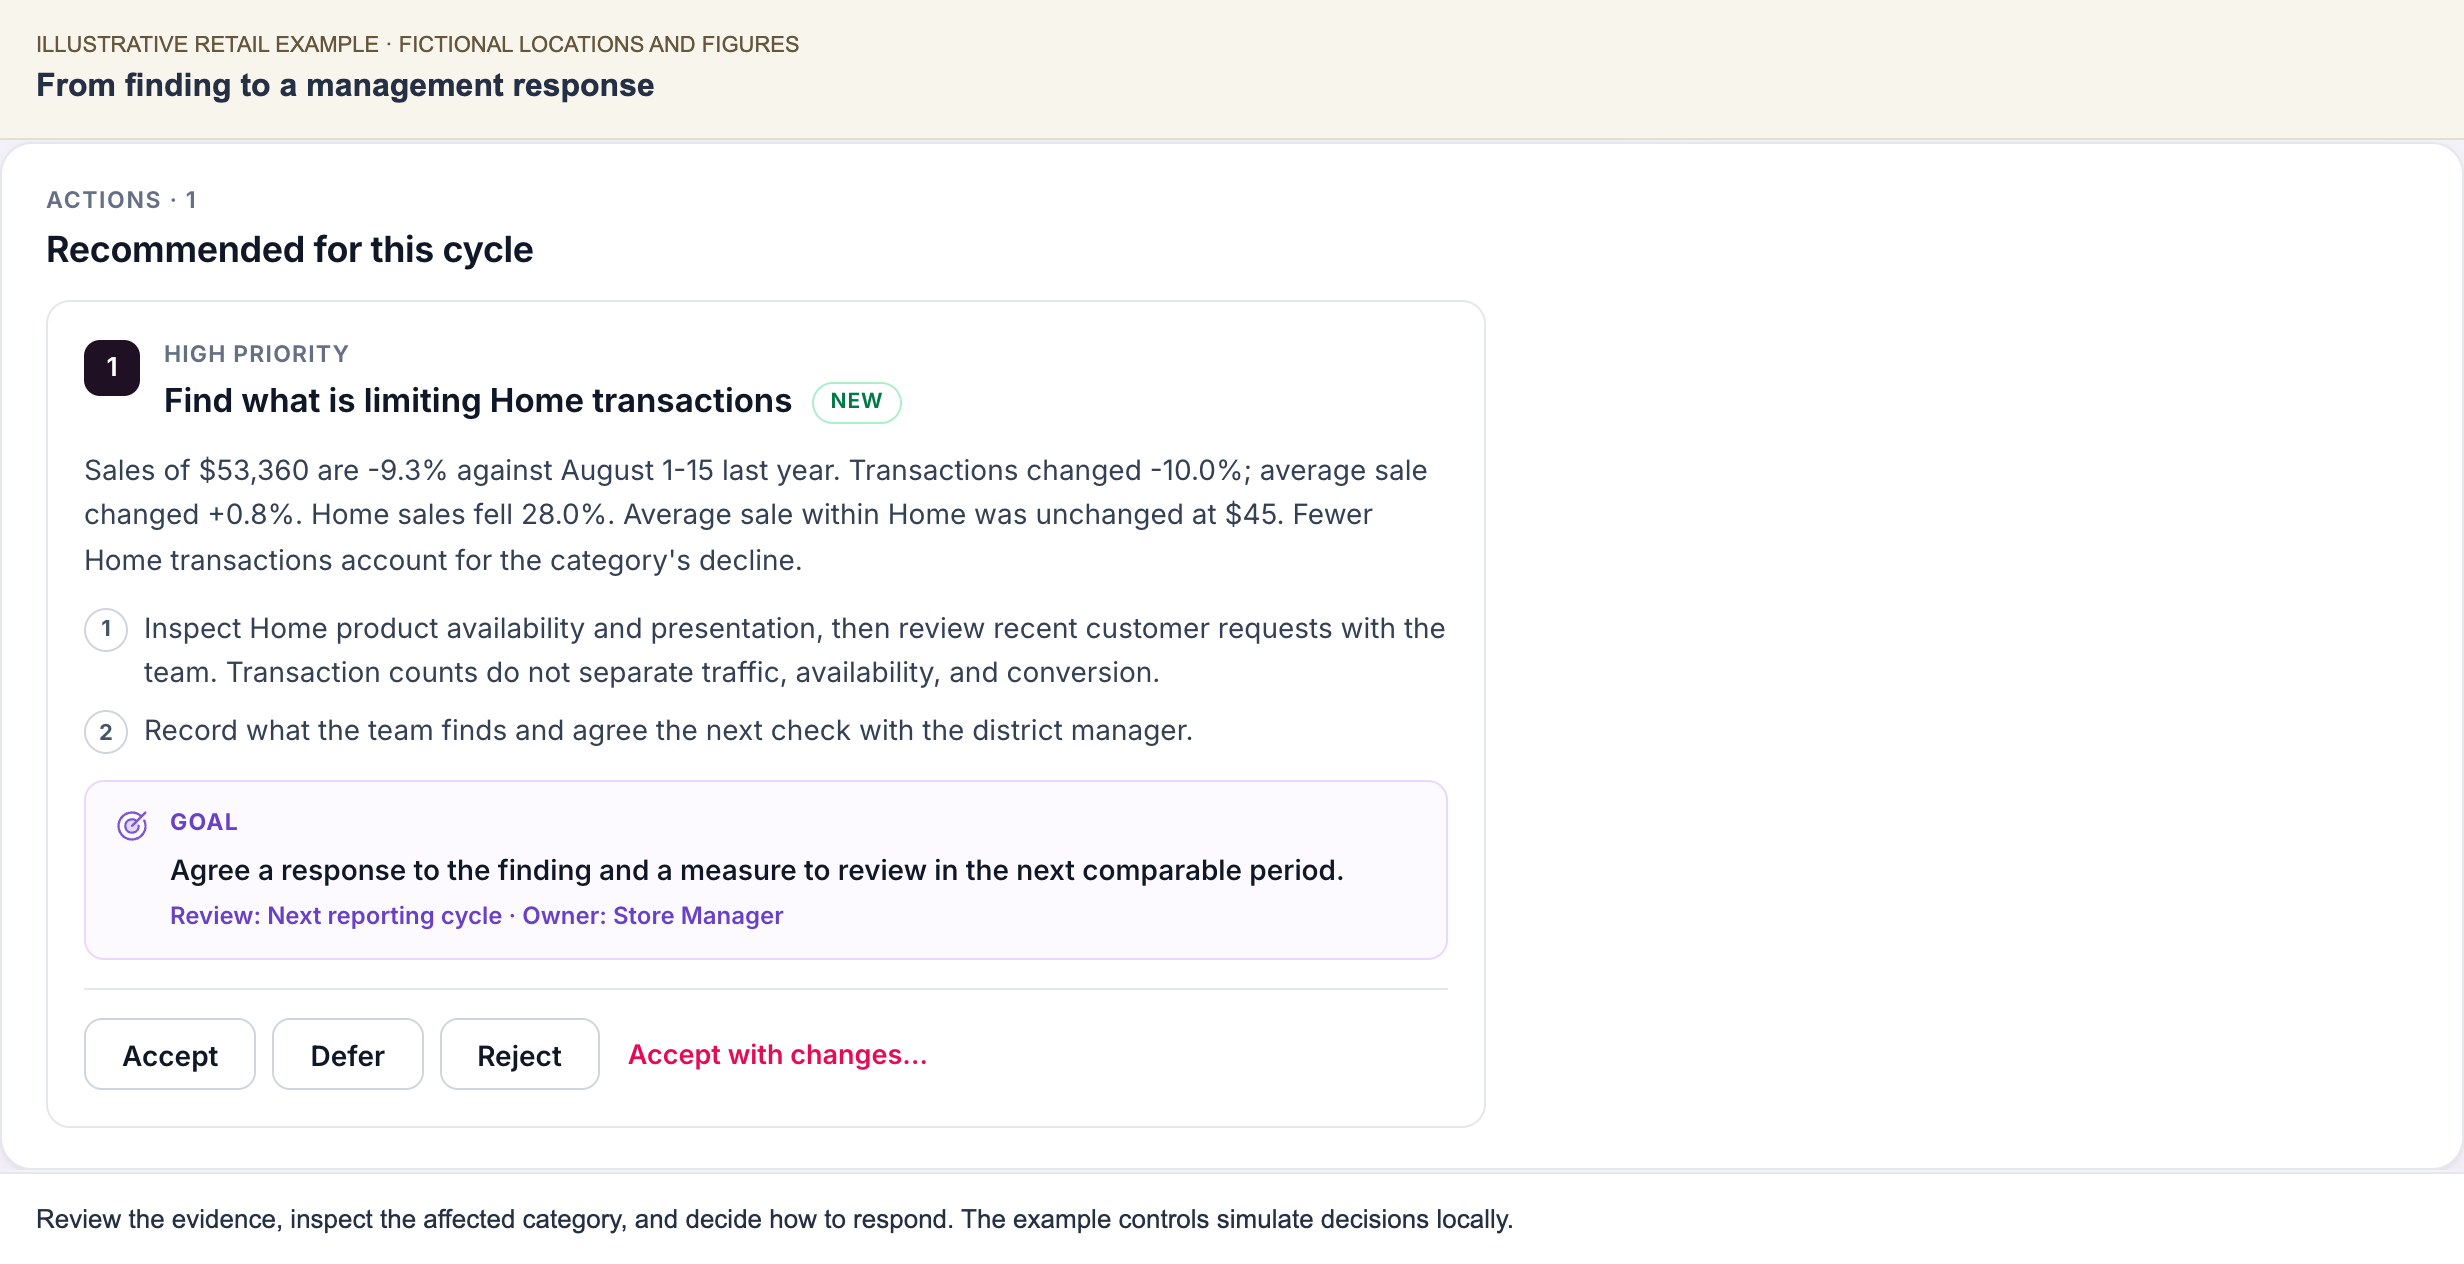
The recommendation retains its evidence, practical steps, owner, and review horizon. A proposed goal is something to agree and review.
For A1, the first step is to inspect Home availability and presentation, then review recent customer requests with the team. The manager can accept the recommendation, accept with changes, defer it, or reject it where those controls are enabled.
The example goal is to agree a response and a measure for the next comparable period. It does not invent a recovery target before the operational question has been answered. Working with Action Plans explains response and follow-up.
5. See why A2 gets a different response
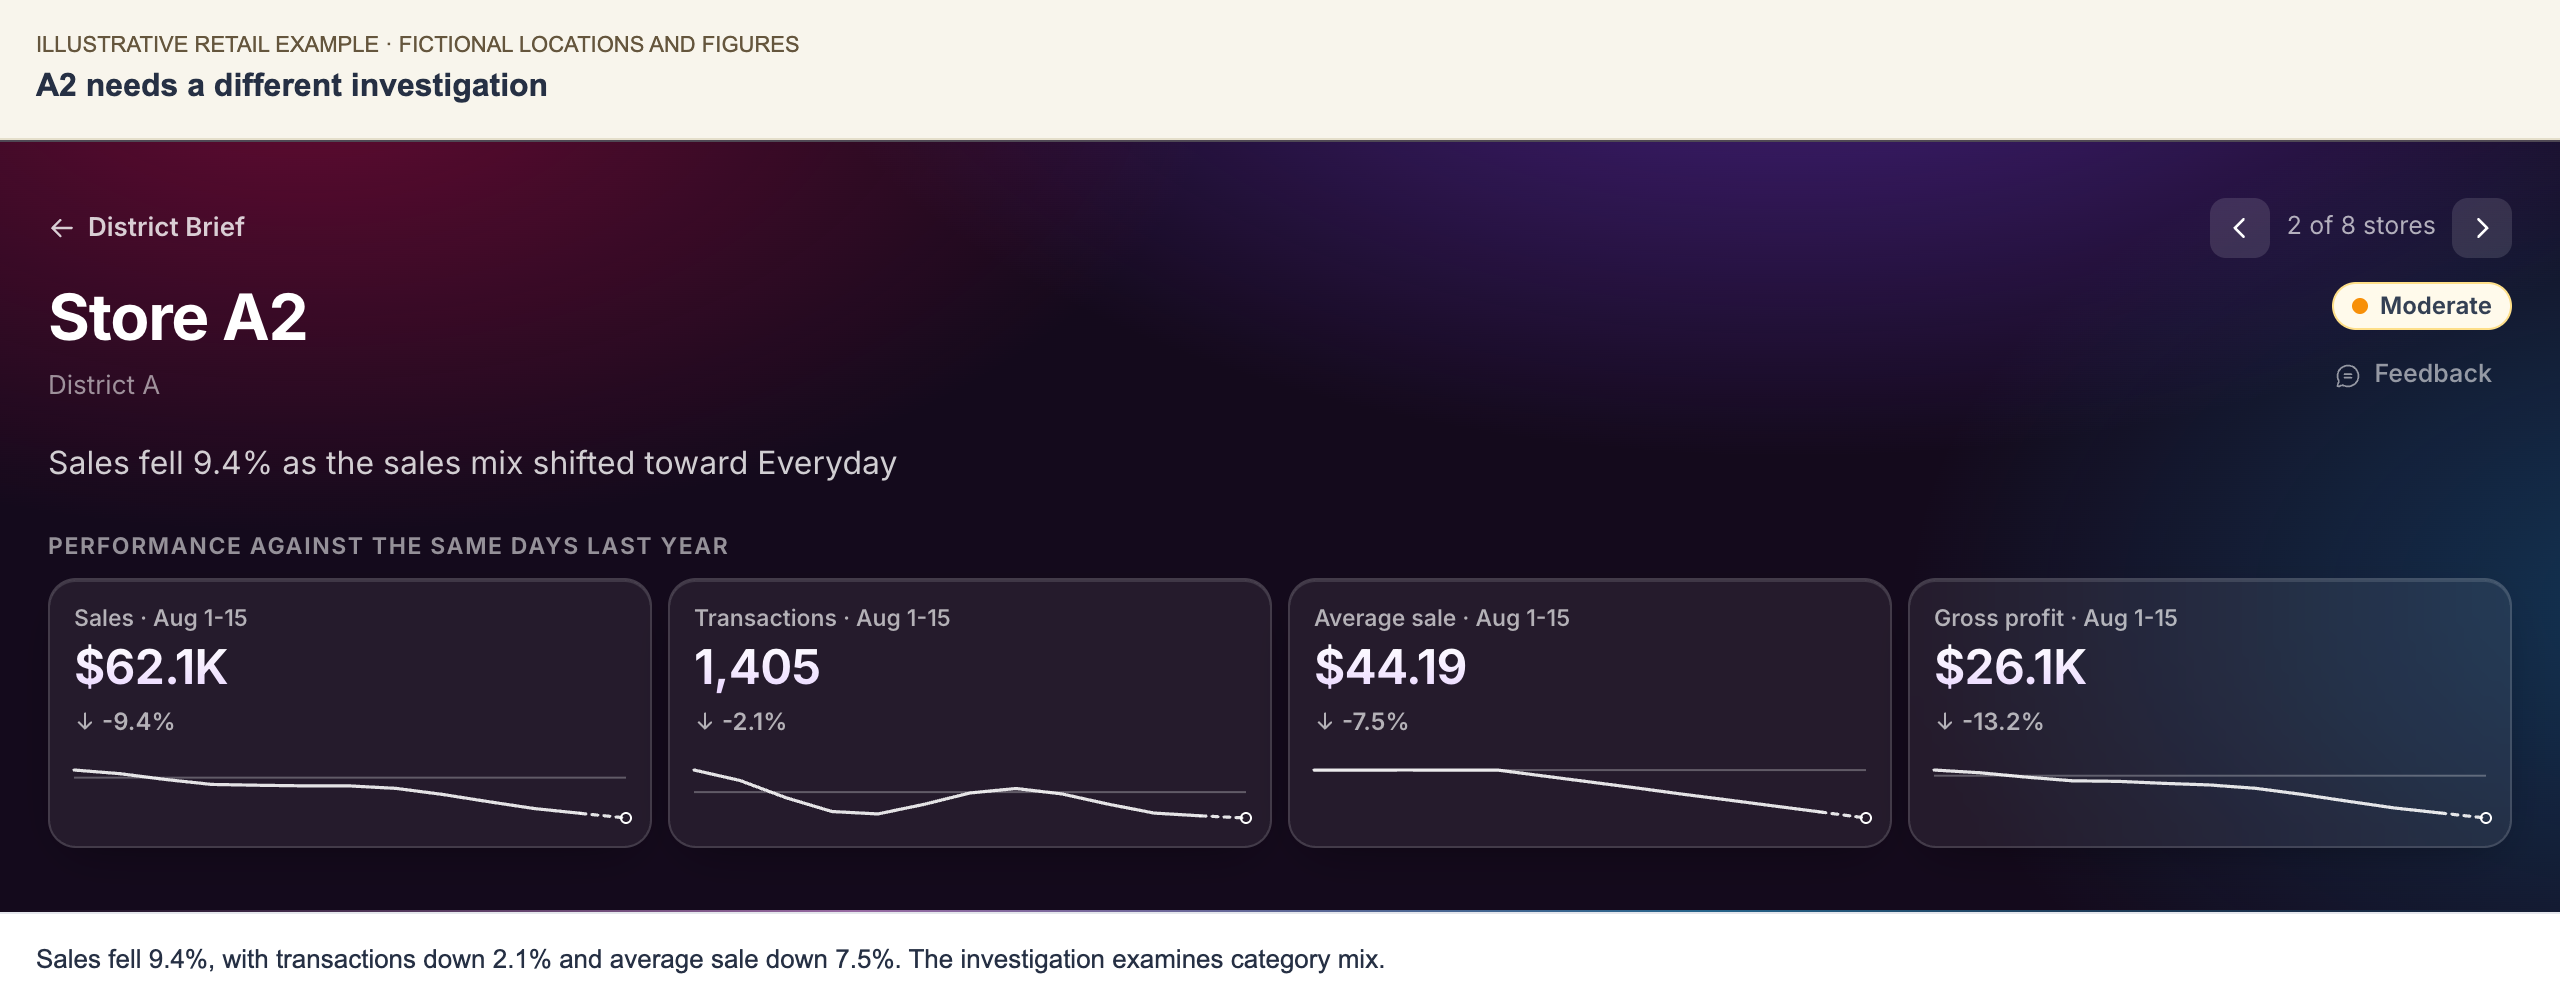
A2 has a similar sales decline, with a smaller transaction decline and a lower average sale.
At A2, Outdoor's share of sales fell from 39.3% to 30.3%. Everyday gained share. Category prices and margins are unchanged in the fictional data, but the mix shift reduced average sale and brought store gross margin from 44.0% to 42.1%.
A2's visit should examine why the mix changed. Cutting prices based only on the store's aggregate margin would address an explanation the evidence has not established. Follow both paths in Inside a Scoop Investigation.
6. Keep strengths visible too
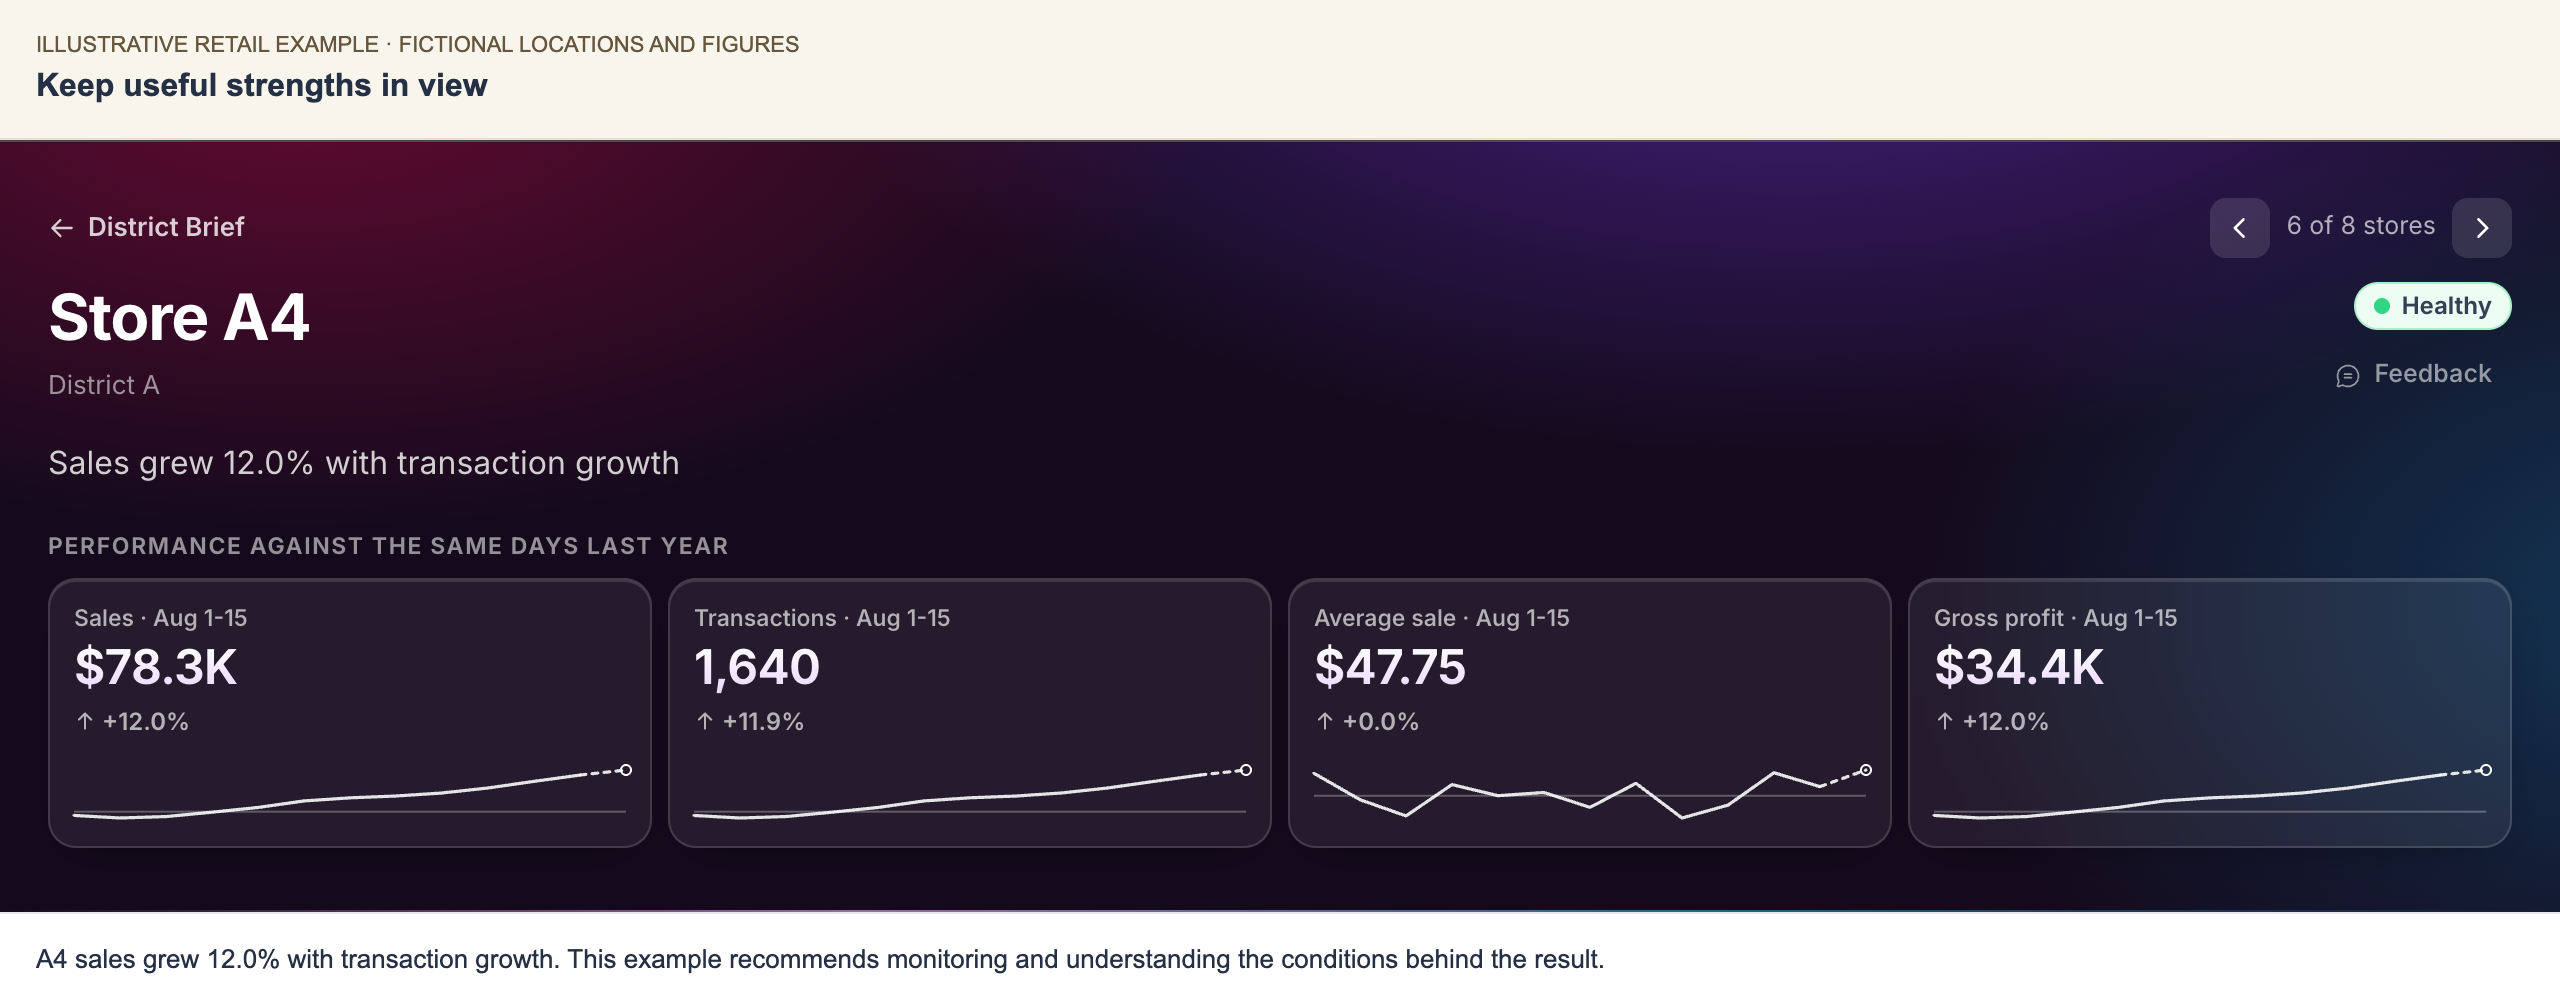
A4's sales grew 12.0% with transaction growth. The example calls for understanding and monitoring that result.
The district manager can ask what conditions supported A4's growth and whether they apply elsewhere. A stronger result alone does not prove which practice caused it. This example gives A4 no new corrective action.
The same evidence serves different decisions
The location manager checks the affected category. The district manager prepares different visits for A1 and A2 and decides which issues need coordination. A regional leader asks whether other districts show the same patterns before treating them as a regional issue. What You Receive shows how the emphasis changes with responsibility.
Features depend on your agreed scope, available data, and rollout. This example demonstrates the product; it is not a customer result or a promised business outcome.
How the example is measured
Current activity covers August 1–15, 2026, compared with August 1–15, 2025. Earlier trend points compare complete months with the same month a year earlier. The example contains 25 months of fictional supporting data for its 13 YoY trend points.
Sales equal transactions multiplied by average sale. Categories are mutually exclusive in this simplified example. Gross margin is sales less cost, divided by sales. Inventory is stock at cost on the stated date. Inventory turns annualize May–July cost of sales against average May–July inventory at cost. District changes use combined current and prior values, not an average of store percentages.
See Reading Your Briefing for interpreting the visuals. Book a discovery call to discuss a briefing built around your own business.