What is Scoop?
What Is Scoop?
Your AI Data Analyst That Thinks, Investigates, and Discovers
Scoop isn't another analytics tool. It's an autonomous AI analyst that investigates your data like a senior data scientist would - finding insights you didn't know to ask for.
The Reality of Traditional BI vs Your AI Analyst
Traditional BI (The Dashboard Maze):
Reality: 127 dashboards. Nobody knows which one to use.
You: "Why are sales down?"
BI Tool: [Silent. Dashboards can't answer questions]
You: Search through dashboards...
You: Find "Regional Sales Dashboard"
You: Wrong time period. No drill-down.
You: Find "Product Performance Dashboard"
You: Can't cross-reference with regions
You: Open Excel. Export data. Manual analysis.
You: 3 hours later... maybe found something?
Scoop (Your Interactive AI Analyst):

You: "Why are sales down?"
Scoop: "I'll investigate that for you. Analyzing..."
       [30 seconds later]
       "I found 3 key factors affecting sales:
       1. Your enterprise segment is underperforming
       2. There's a strong correlation with support response times
       3. A competitor entered your largest market"

You: "Tell me more about the support correlation"
Scoop: "Looking deeper... Customers with unresolved tickets
       over 7 days show significantly higher churn rates..."

You: "Which categories are most affected?"
Scoop: "Technical integration issues are the primary driver.
       Here's the breakdown by category and impact..."
That's the difference between static dashboards and an interactive AI analyst.
What Makes Scoop Revolutionary
1. Deep Reasoning That Shows Its Work
Unlike "black box" AI, Scoop shows exactly how it investigates:

The Investigation Process:
- Hypothesis Formation: Automatically generates multiple plausible explanations
- Systematic Testing: Applies appropriate statistical methods to each hypothesis
- Evidence Ranking: Quantifies correlation strength, statistical significance (p-values), and sample sizes
- Impact Analysis: Isolates and measures the contribution of each factor
- Confidence Scoring: Provides transparency on certainty levels (High/Medium/Low)
- Alternative Explanations: Shows what was considered and why certain paths were rejected
Example Investigation Process:
You: "Why did conversion drop last month?"

Scoop: 🔍 Investigating conversion rate decline...

Hypothesis 1: Checking for data quality issues... ✓ Data validated
Hypothesis 2: Analyzing traffic sources... ✓ No significant change
Hypothesis 3: Examining user behavior patterns... ⚠️ Pattern shift detected
Hypothesis 4: Testing technical performance... 🚨 Issue found

Root Cause Identified:
- Mobile page performance degraded significantly
- Primarily affecting mobile user segment
- Strong correlation with conversion drop
- Statistical Confidence: High (p < 0.001)

Recommendation: Investigate mobile site performance
Expected Impact: Significant conversion improvement possible
2. Enterprise-Grade Data Science Studio
Four core ML capabilities available to every user - no PhD required:

🎯 Predictive Relationships
- Automatically builds decision tree models (J48, Random Forest)
- Identifies top predictive factors with importance scores
- Provides "if-this-then-that" rules in plain English
- Example: "Discovers which deal characteristics predict success"
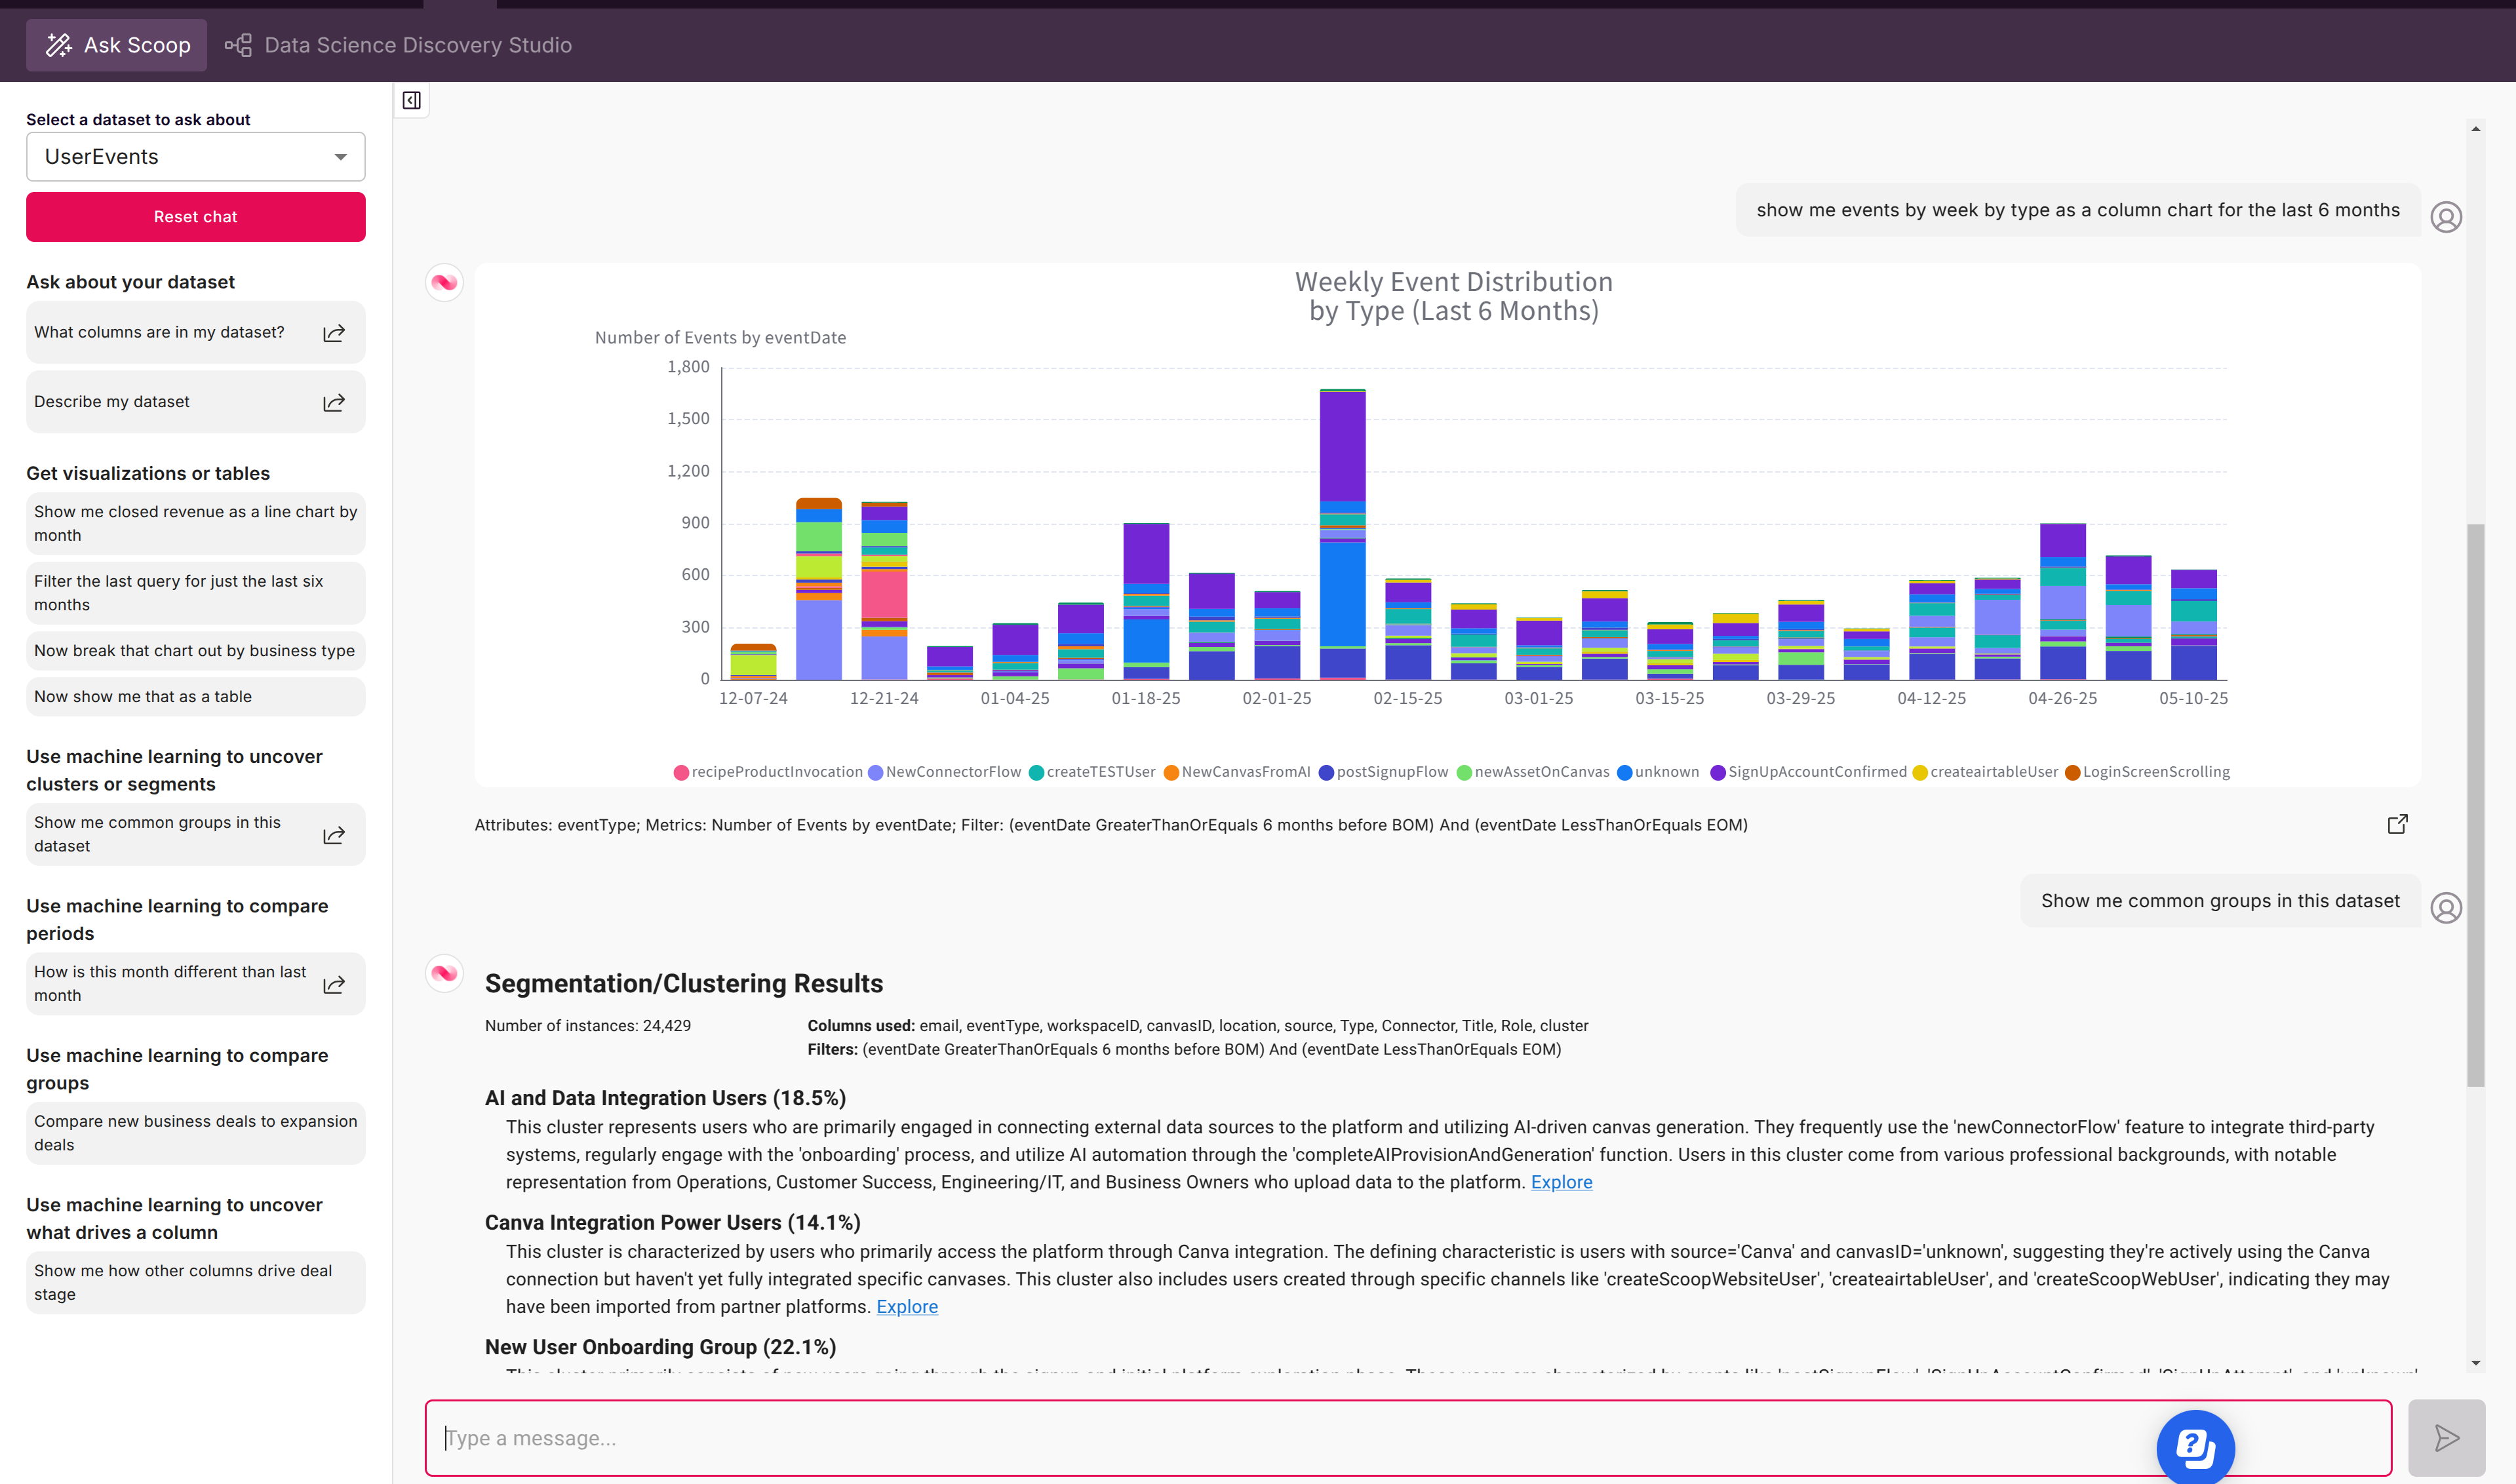
🔍 Smart Segmentation/Clustering
- Applies k-means and hierarchical clustering automatically
- Discovers natural groupings with business explanations
- Sizes each segment and profiles characteristics
- Example: "Automatically identifies natural customer segments with business characteristics"
📊 Group/Population Comparisons
- Statistically compares any two groups
- Highlights significant differences with effect sizes
- Controls for multiple variables automatically
- Example: "Reveals statistically significant differences between customer groups"
📈 Time Period Analysis
- Detects what changed between any two periods
- Quantifies impact of each change
- Separates signal from noise using statistical tests
- Example: "Breaks down period-over-period changes into contributing factors"
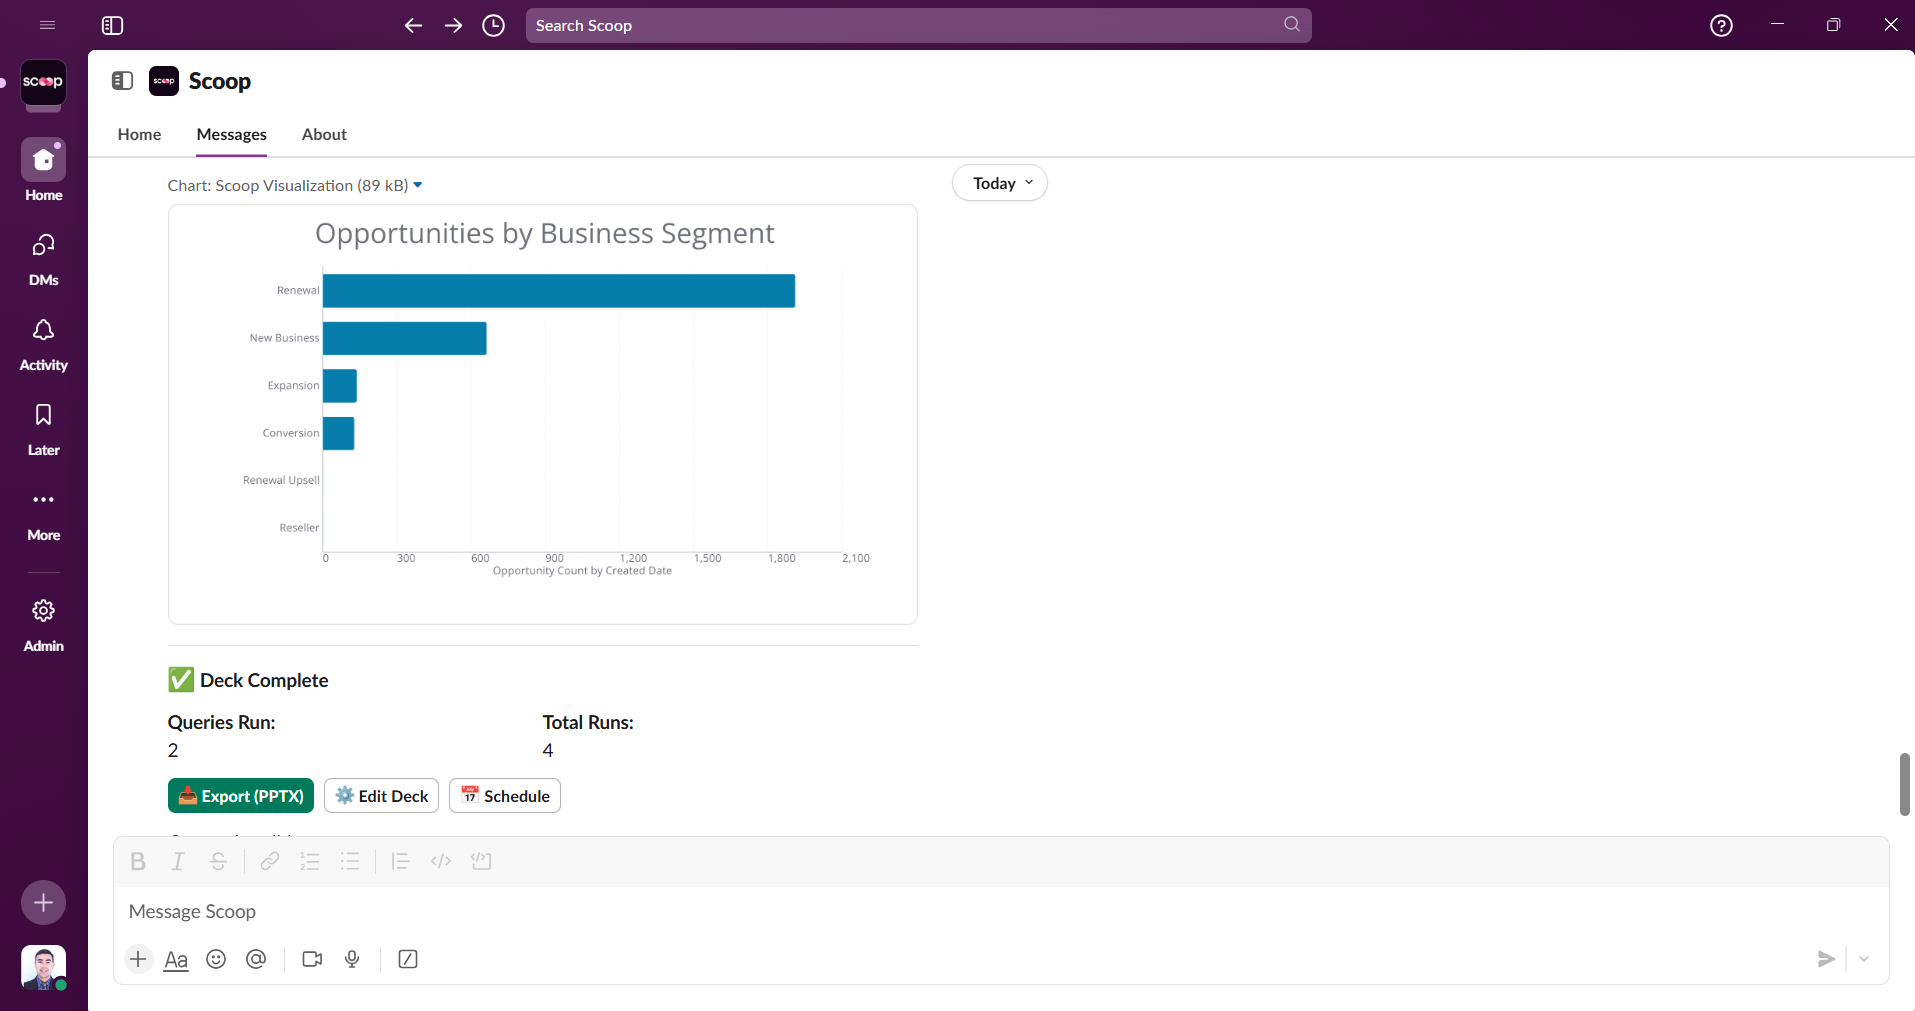
3. Process Mining & Evolution Tracking
Traditional BI captures "now"—Scoop tracks change:

- Automated Snapshots: Daily/periodic data capture
- Evolution Analysis: How opportunities progress through stages
- Process Flows: Visualize with Sankey diagrams
- Bottleneck Detection: Where things get stuck
- Conversion Funnels: Stage-by-stage analysis
- Cycle Time: How long each step takes
4. Interactive Conversations, Not Static Views
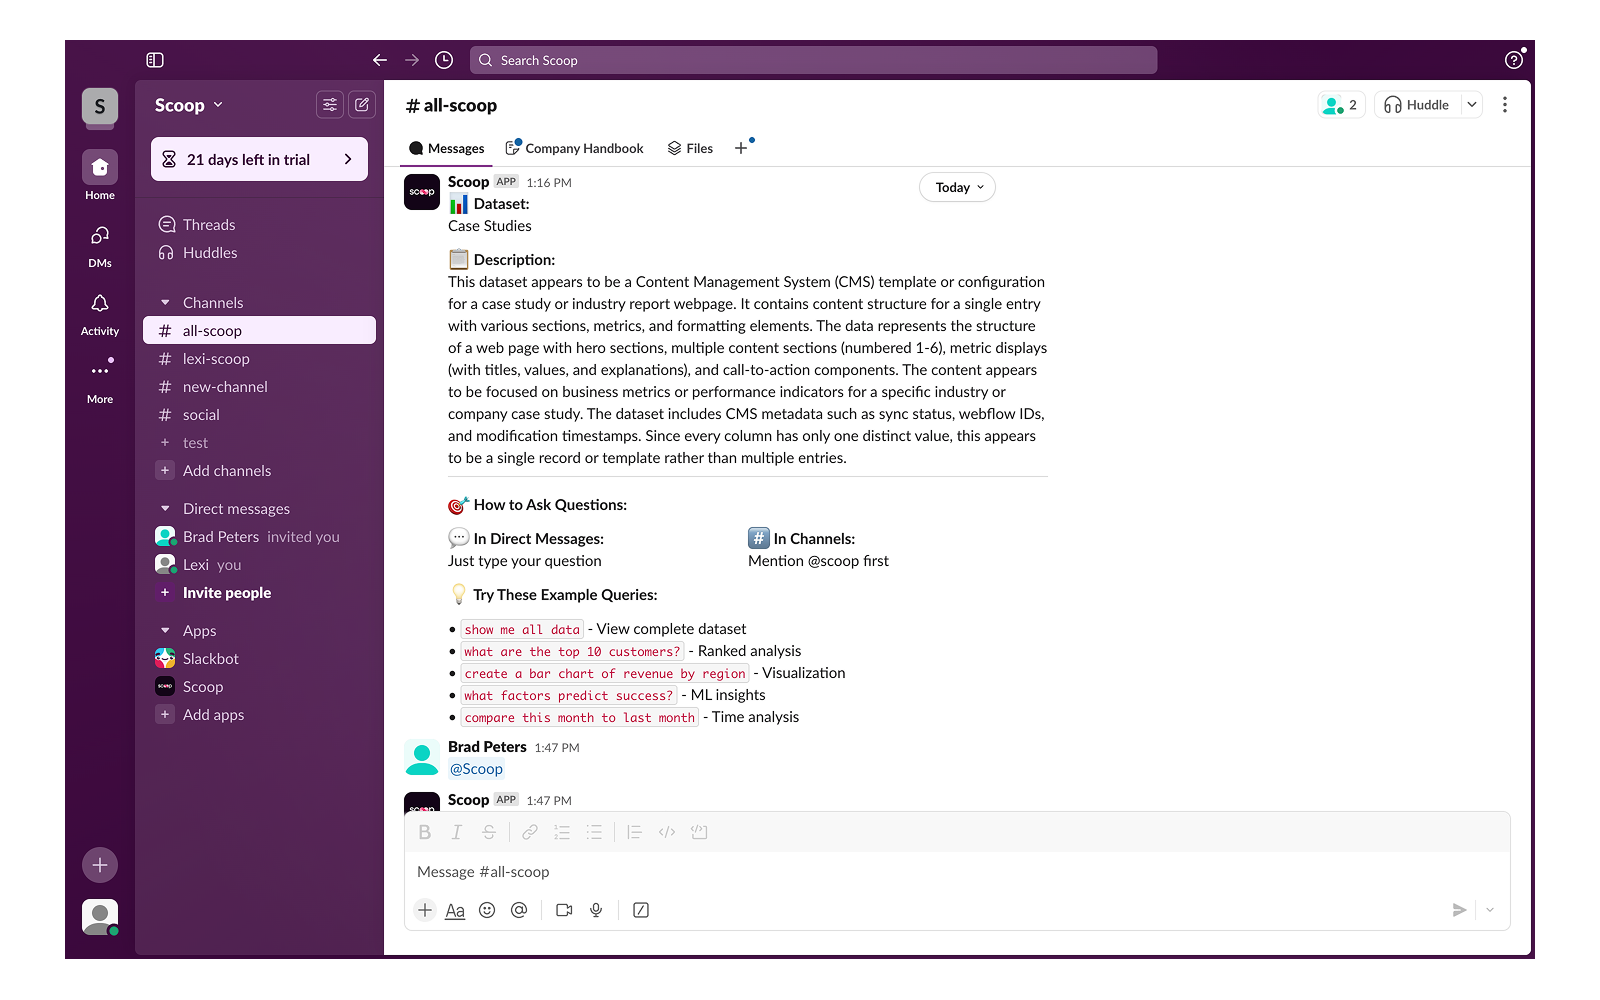
Real conversation in Slack - ask, drill down, explore
This isn't keyword matching. Scoop has real conversations:
- Intent Understanding: "Why are we losing customers?" triggers churn investigation
- Context Memory: "Show that by month" - Scoop remembers what "that" refers to
- Follow-up Questions: Each answer leads to deeper exploration
- Business Language: "Pipeline velocity" maps to your specific metrics
How Scoop Works
Step 1: Connect Your Data - 100+ Sources

File Uploads: CSV, Excel, JSON, PDF
Databases: PostgreSQL, MySQL, Redshift, Snowflake, BigQuery
CRM/Sales: Salesforce, HubSpot, Pipedrive, Close.com
Marketing: Google Analytics, Meta Ads, Google Ads
Finance: QuickBooks, Stripe, NetSuite
Support: Zendesk, Intercom, Freshdesk
Project: Jira, Monday, Asana
And 75+ more...
Step 2: Automatic Data Preparation
No ETL required. Scoop automatically:
- Detects data types and relationships
- Handles dates intelligently (business vs transaction vs load dates)
- Creates calculated fields with spreadsheet formulas
- Blends multiple data sources
- Manages snapshot vs simple datasets
Step 3: Have a Conversation with Your Data
Ask questions naturally, get visual answers, drill down interactively
The Interactive Difference:
- You: "Show me sales performance"
- Scoop: [Shows visualization]
- You: "Why did Q3 underperform?"
- Scoop: "Investigating... Found 3 factors..."
- You: "Focus on the enterprise segment"
- Scoop: "The enterprise decline started in July when..."
Step 4: Get Insights You Can Trust
- No Hallucinations: Real data, real calculations, traceable to source
- Statistical Rigor: P-values, confidence intervals, sample sizes shown
- Transparent Process: See exactly how conclusions were reached
- Business Language: Technical insights explained clearly
The Dashboard Maze Problem (And How We Solve It)
The Reality at Most Companies:
- Hundreds of dashboards that nobody can navigate
- Nobody knows which dashboard has the answer
- New question? Wait days or weeks for a new report
- One-time reports built for single questions, then abandoned
- Drill-down? Click through multiple dashboards, lose context
The Scoop Solution: Just Ask

No dashboards to navigate. Just natural conversation.
Instead of:
- Finding the right dashboard
- Learning the filters
- Exporting to Excel when stuck
- Building a report for one question
You simply:
- Ask your question
- Get an answer
- Ask follow-ups
- Drill down naturally
- Share insights instantly
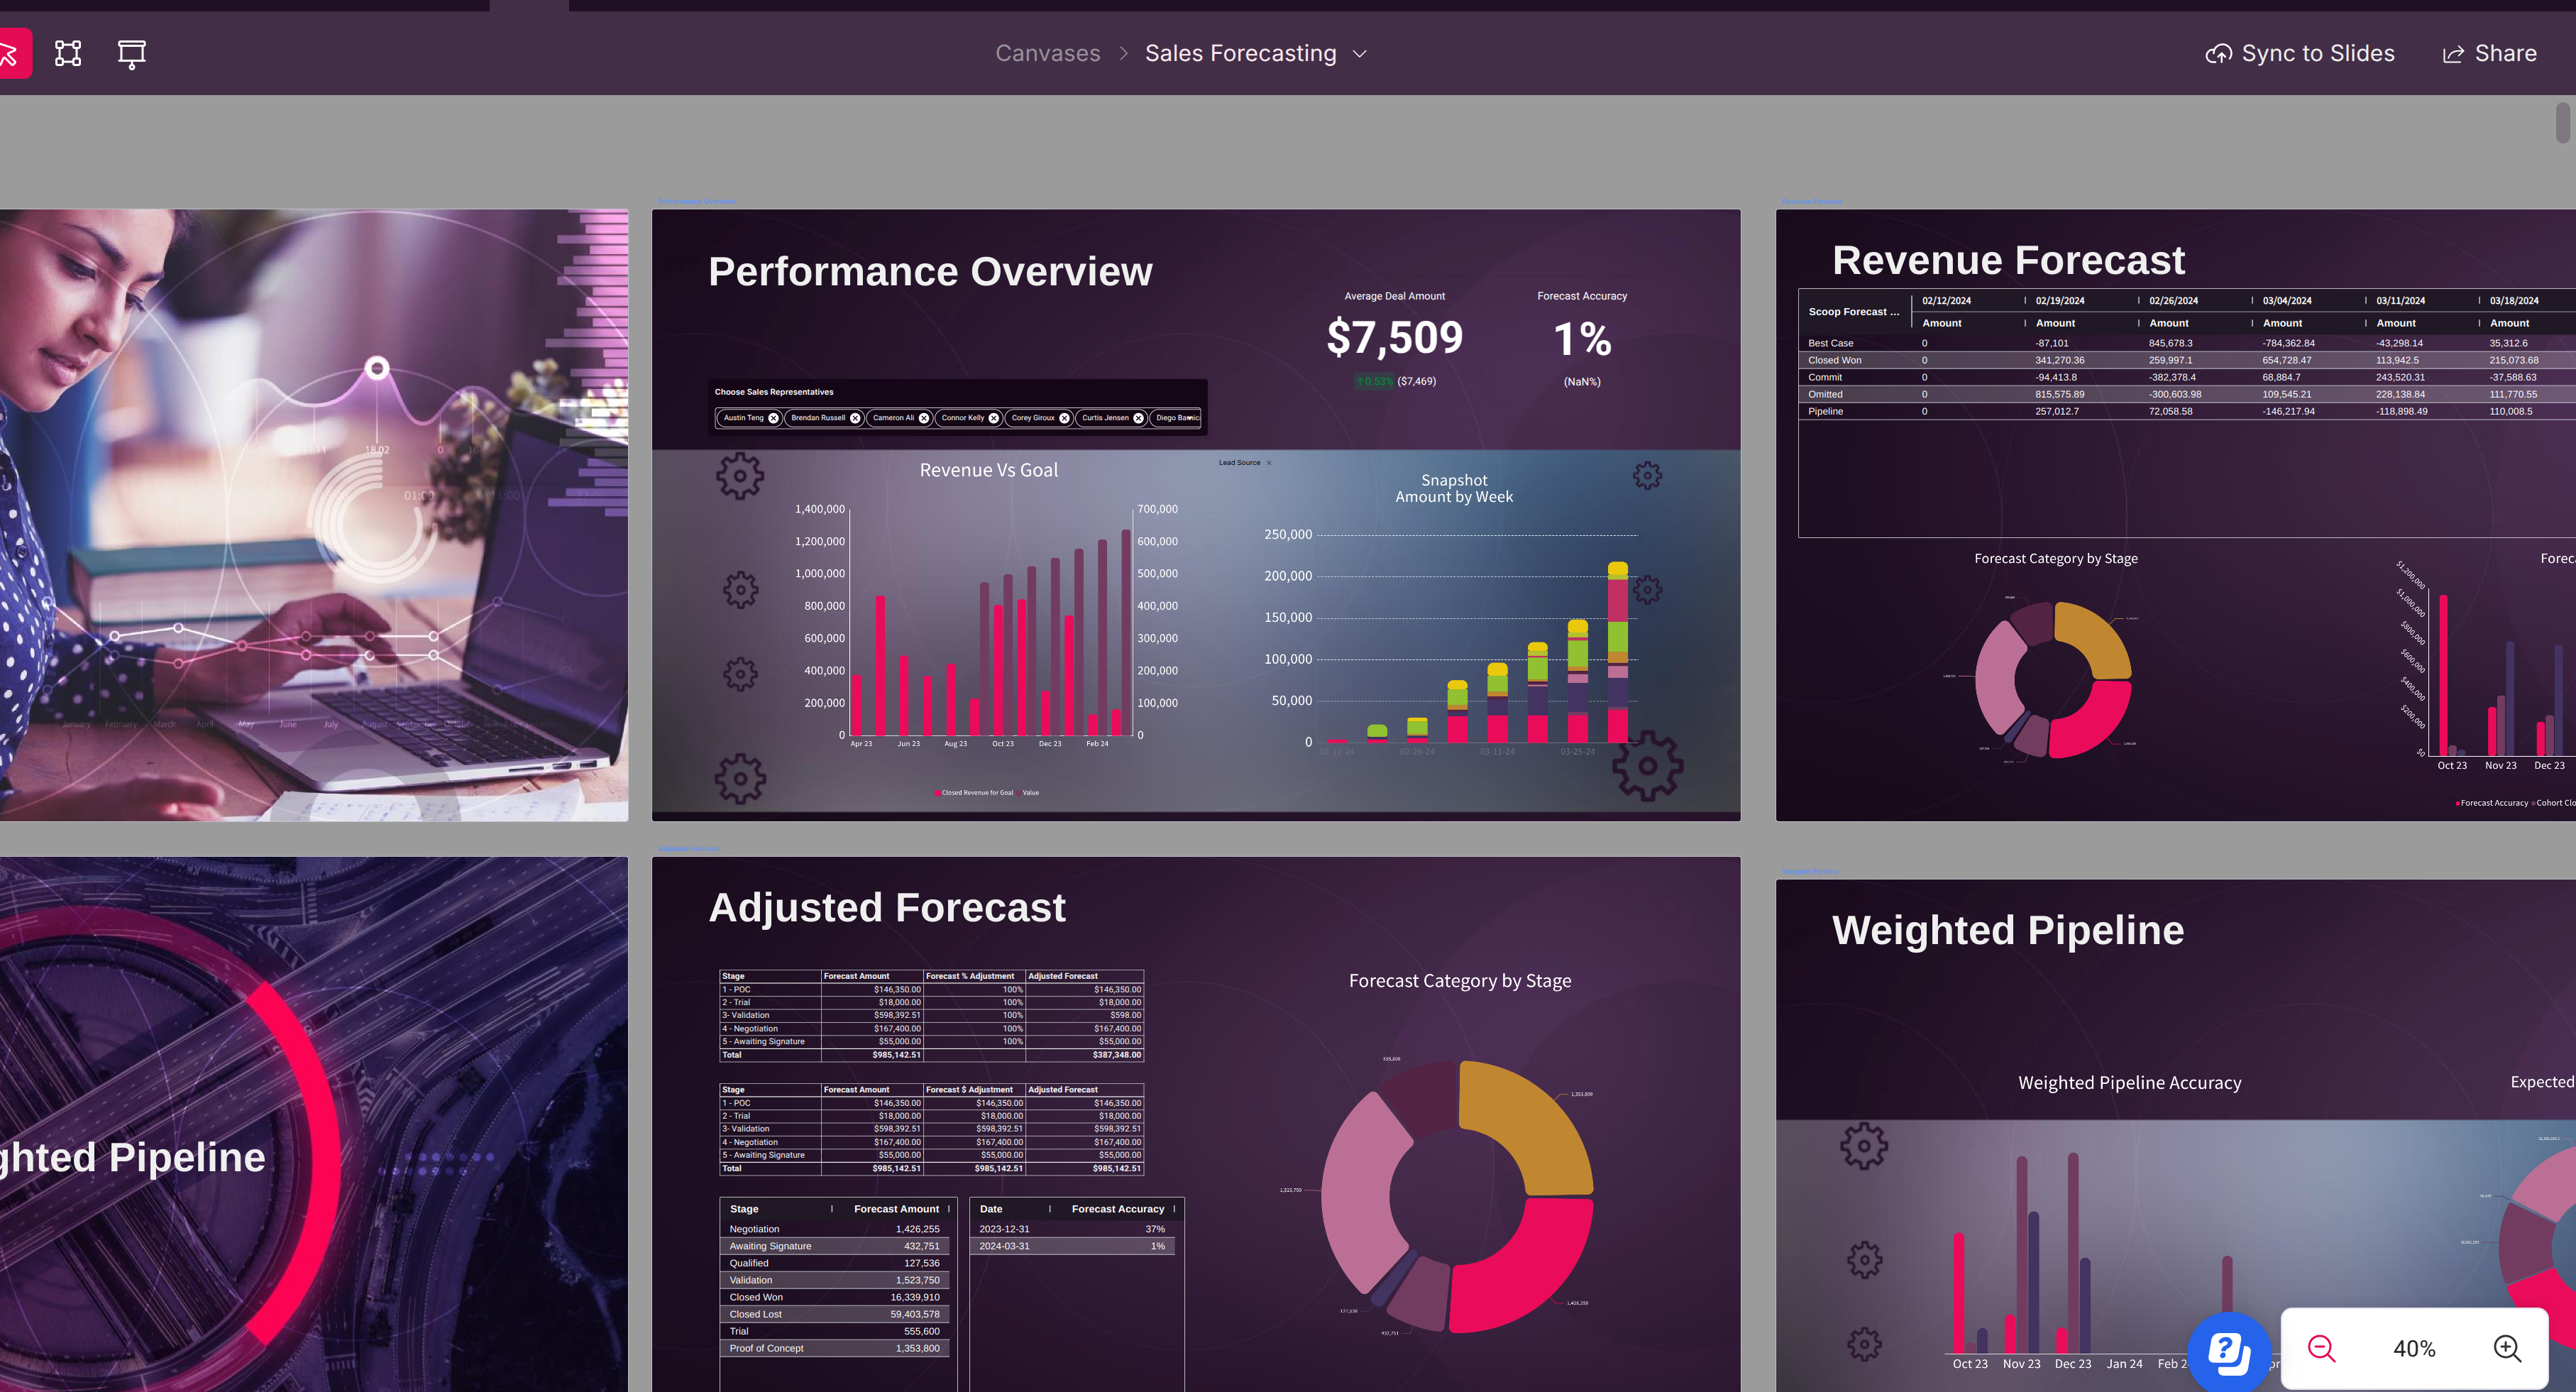
Transform Data into Action
Live Presentations & Storytelling

- Import your PowerPoint/Slides templates
- AI matches your brand colors and styling
- Live data overlays on your slides
- Auto-update when data changes
- Export or present directly from Scoop
CRM Write-Back

Push insights back to your systems:
- Customer scores to Salesforce
- Churn predictions to HubSpot
- Segment tags to marketing tools
- Custom KPIs to any CRM field
Live Worksheets
Connect spreadsheets to Scoop's engine:
- Two-way sync with Google Sheets
- Excel 365 integration
- Named ranges become live data
- "What-if" analysis at scale
Access Scoop Your Way
Web Application
Full power for deep analysis:
- Spreadsheet interface for data prep
- Visual canvas for presentations
- Complete ML studio access
- Advanced configuration
Slack Integration
Analytics where your team works:
Exclusive Slack Features:
- Personal Query Libraries - Save any analysis
- Personal Analytics Decks - One-click dashboards
- Dual Workspaces - Personal + organizational data
- Progressive Sharing - Preview privately first
- Thread context maintained
- 30-second setup, no account required
API Access
- REST endpoints for all capabilities
- Embed in your applications
- Programmatic analysis
- Custom integrations
Why Business Leaders Choose Scoop
vs Traditional BI (Tableau, PowerBI, Looker)
| Capability | Traditional BI | Scoop |
|---|---|---|
| Interface | Static dashboards | Interactive conversations |
| Questions | Pre-built only | Ask anything |
| Drill-down | Click through dashboards | Natural follow-ups |
| Discovery | You search manually | AI investigates |
| Dashboard Count | 100s (maze to navigate) | Zero (just ask) |
| New Questions | Build new report/dashboard | Just type it |
| Time to Answer | Hours of searching | Seconds |
| Expertise Needed | Know which dashboard | Know your business |
vs "AI-Powered" BI Tools
Most BI vendors added chatbots to their dashboards. We built an AI analyst from the ground up:
Their "AI":
- "Here's how to find that dashboard"
- "Try filtering by region"
- "Would you like a pie chart?"
Scoop's AI:
- Investigates root causes autonomously
- Has multi-turn conversations
- Remembers context throughout session
- Suggests what to explore next
- Discovers insights you didn't ask for
vs ChatGPT/Claude
- They: Can't access your data
- Scoop: Direct database connections
- They: Might hallucinate numbers
- Scoop: Real calculations, no hallucinations
- They: Generic responses
- Scoop: Your data, your context
Enterprise-Grade Security & Scale
Data Handling
- SOC 2 Type II certified
- End-to-end encryption
- No data mixing between workspaces
- Role-based access control
Performance
- Handles millions of rows
- In-memory column store
- Automatic query optimization
- Scales with your growth
Deployment Options
- Cloud SaaS (standard)
- VPC deployment available
- API-first architecture
Real Customer Use Cases
Global Events Platform
- Combined data from Salesforce (sales), HubSpot (marketing), and Snowflake (transactions)
- Key needs: Understanding year-over-year changes, analyzing event creators by industry and size
- Why Scoop: Natural language queries like "list all UK customers in specific industry"
Private Equity Portfolio Enablement
- Challenge: Enable portfolio companies without heavy implementation
- Solution: Light-touch analytics across Salesforce instances
- Result: Non-technical users can analyze their own data
Master Record Strategy
- Approach: Using contact records as master, enriching with multiple data sources
- Sources: Apollo, Amplitude, Google Analytics data unified
- Capability: Calculate new fields and write back to HubSpot/Salesforce for campaigns
Who Uses Scoop
Business Users
Finally get answers without waiting on data teams. No SQL, no training, just questions and insights.
Data Analysts
Skip the grunt work. Let AI handle data prep and initial analysis while you focus on strategy.
Sales Teams
Understand pipeline health, predict deals, identify risks - all in natural language.
Marketing Teams
Attribution analysis, campaign optimization, customer segmentation - without technical skills.
Customer Success
Predict churn, identify expansion opportunities, understand usage patterns.
Executives
Real-time answers to strategic questions. From "why" to root cause in minutes.
Start Your AI Analytics Journey
Option 1: Web Application
Full features, free trial, no credit card
Option 2: Slack Integration
Add to Slack in 1 click, no signup
Option 3: Book a Demo
See Scoop investigate your actual business questions
The Bottom Line
In a world where everyone claims "AI-powered analytics," Scoop delivers something fundamentally different: an AI that thinks like an analyst, investigates like a data scientist, and communicates like a trusted advisor.
This isn't the future of analytics. It's here now.

Your AI Data Analyst is waiting. What will you discover today?
Updated 8 months ago