Interactive Charts and Tables
Add live, drillable visualizations to your canvas
Charts and tables on your canvas aren't static images—they're live, interactive elements connected to your data. Users can drill down, filter, and explore without leaving your presentation.
Adding Charts and Tables
From Explorer
Create visualizations in Explorer, then add them to your canvas:
- Build your chart or table in Explorer
- Click Save and name the visualization
- Open your canvas in edit mode
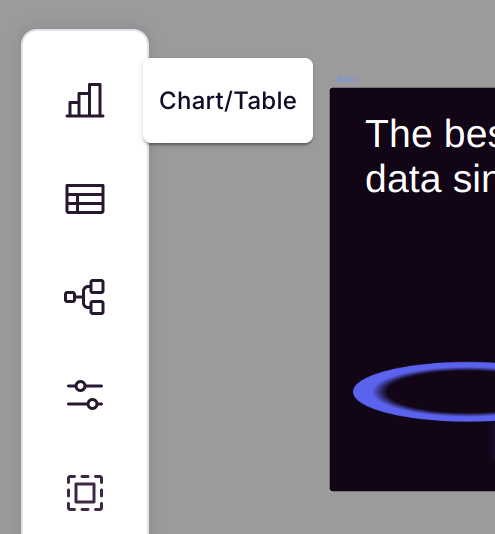
- Click + Add → Insight (for charts) or Worksheet (for tables)
- Select your saved visualization
Result on Canvas
Your visualization appears as an interactive element:
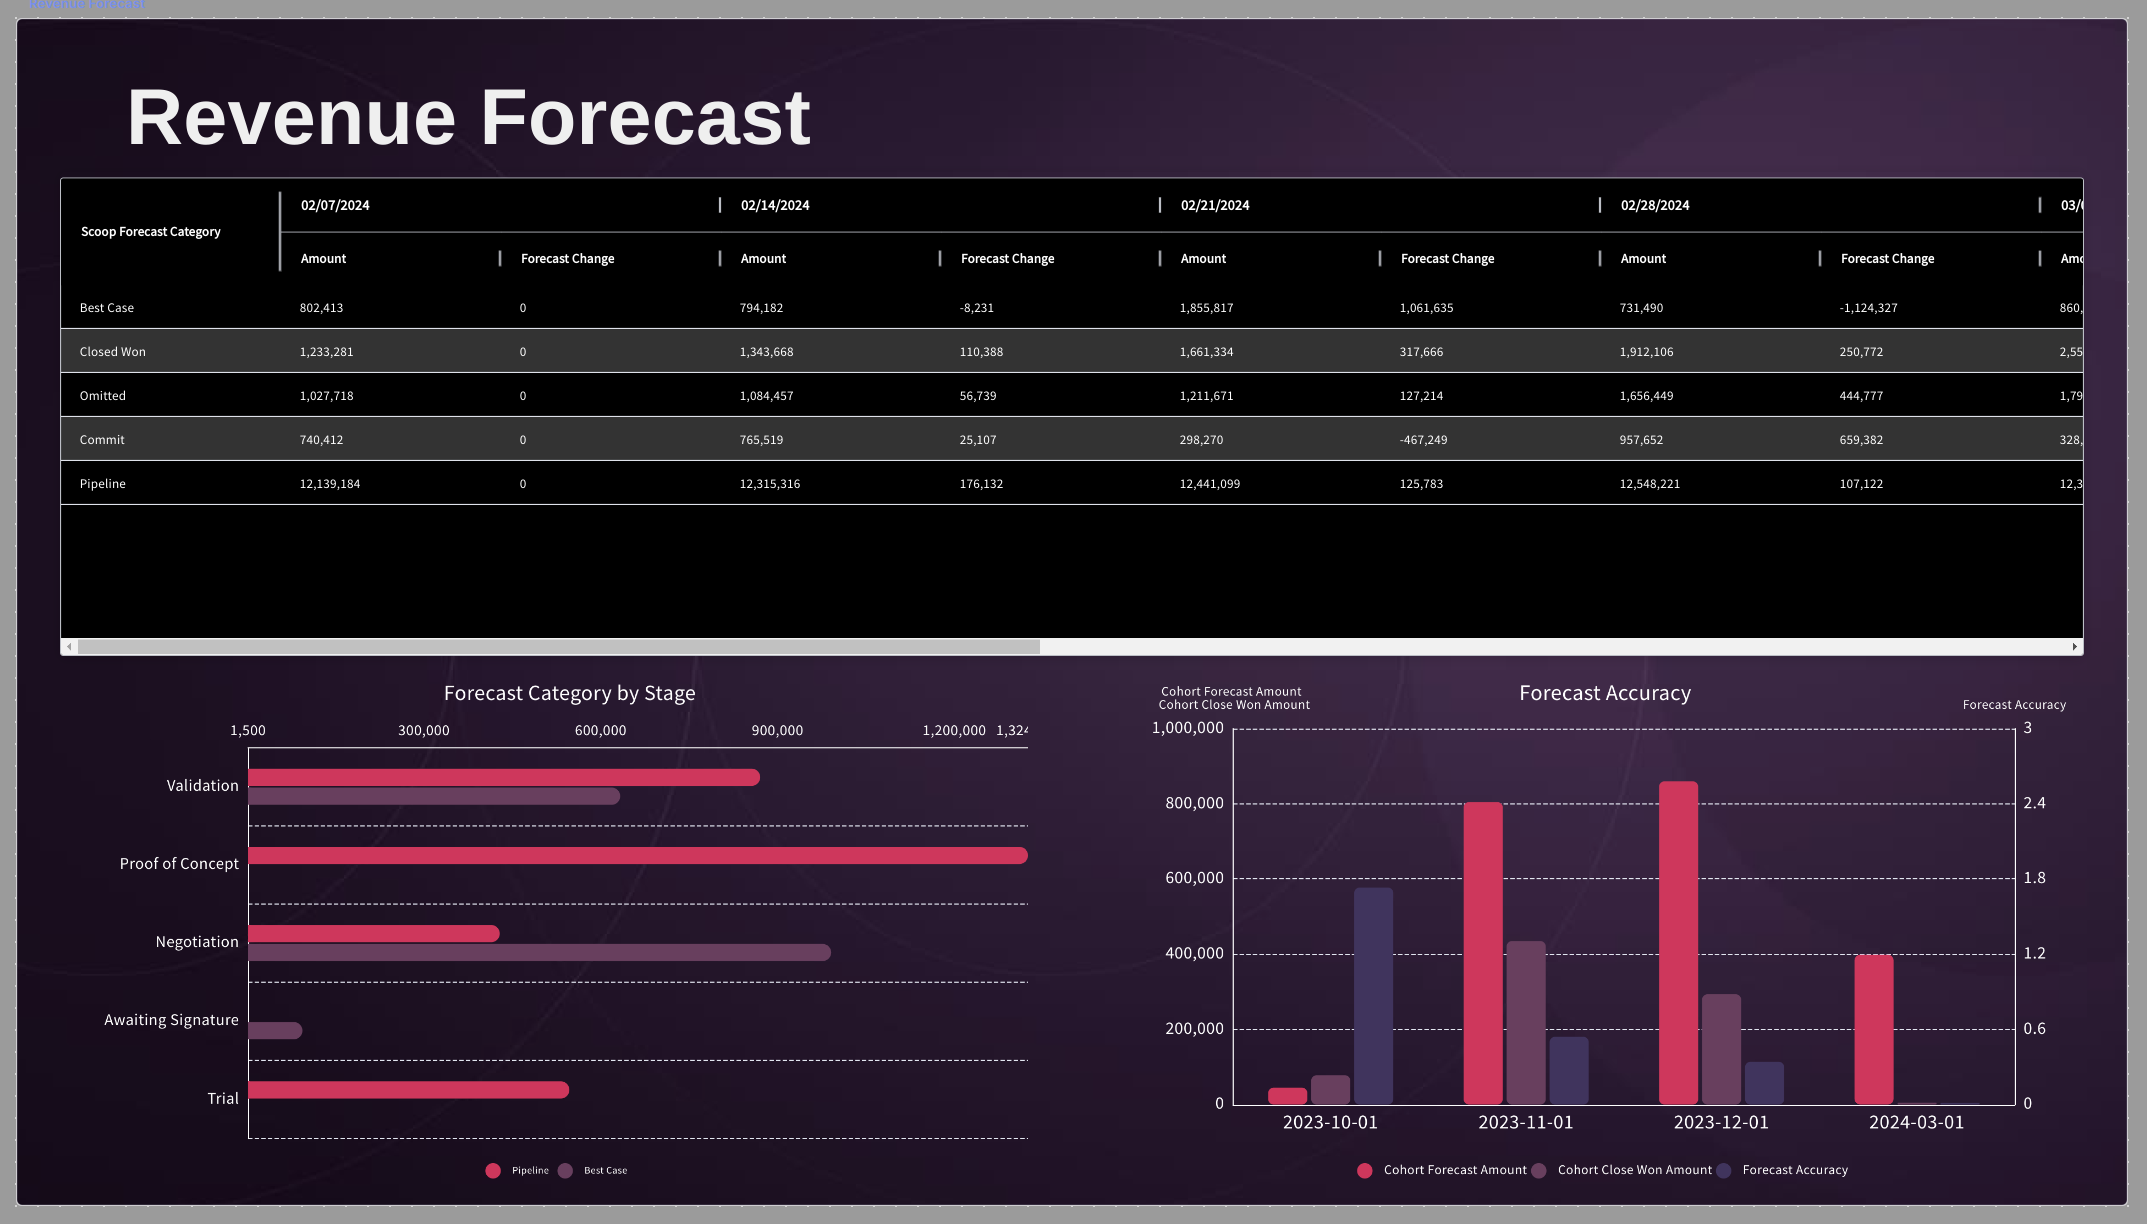
Drilling Into Data
Because visualizations are backed by full datasets, you can drill into any dimension present in the source data.
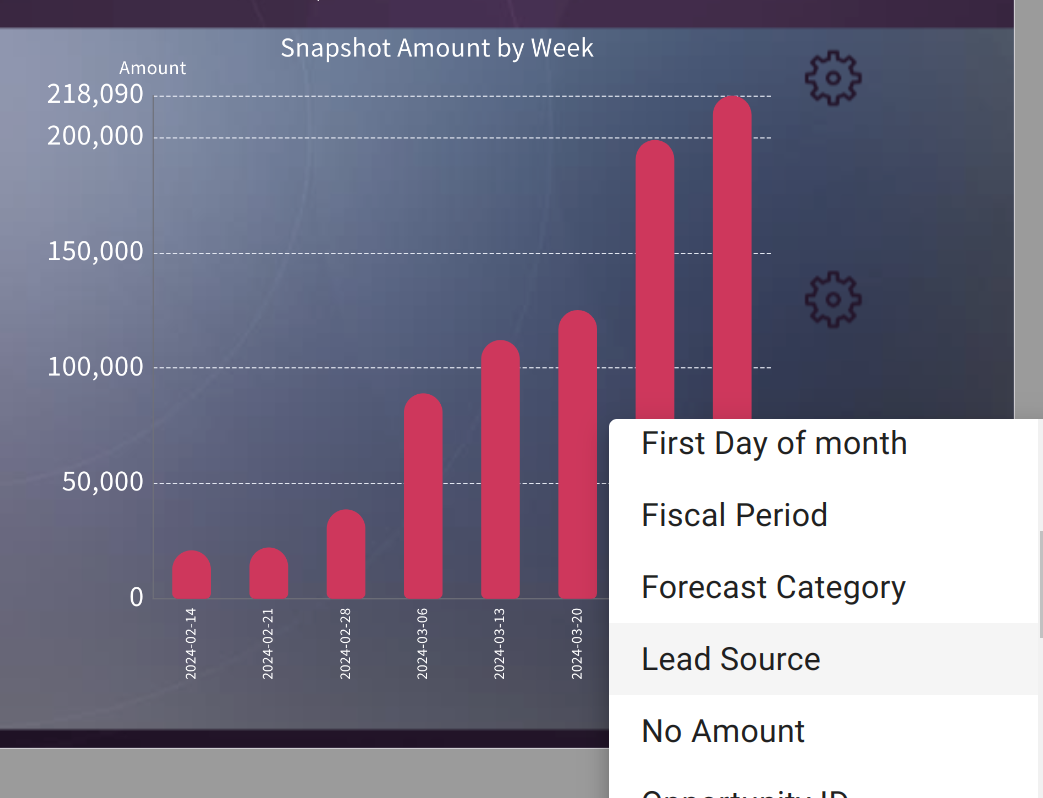
How to Drill
- Click on any element (bar, slice, point, row)
- A drill menu appears with available dimensions
- Select the attribute to drill by
- The visualization updates to show the breakdown
Drill Example
Starting view: Revenue by Region
Click: West region bar
Drill by: Sales Rep
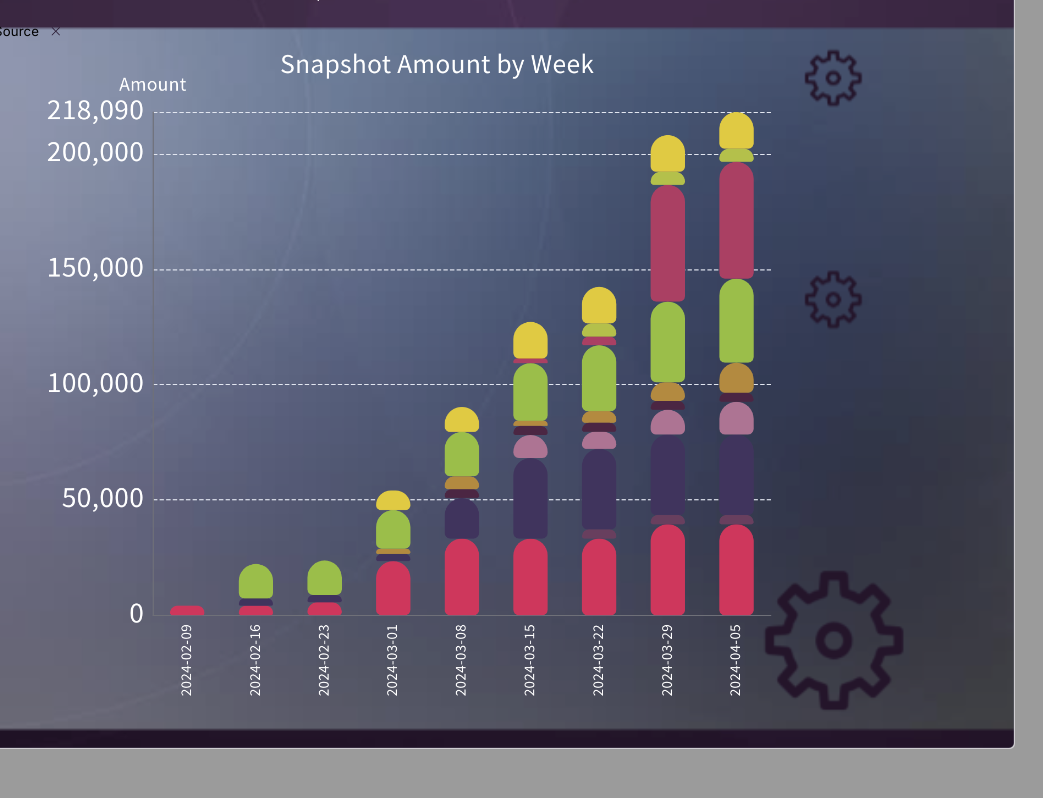
Result: West region revenue broken down by each rep
Drill Navigation
- Breadcrumbs: Track your drill path (upper left)
- Back: Click breadcrumb to return to previous level
- Reset: Click first breadcrumb to return to original view
- Multiple drills: Continue drilling deeper (Region → Rep → Deal)
Available Drill Dimensions
You can drill by any attribute in your source dataset:
| Category | Example Dimensions |
|---|---|
| Organization | Region, Department, Team |
| People | Rep, Manager, Customer |
| Time | Month, Quarter, Week |
| Product | Category, SKU, Line |
| Status | Stage, Type, Priority |
Note: Only columns included in your dataset appear as drill options.
Chart Types That Support Drilling
| Chart Type | Drill Behavior |
|---|---|
| Bar Chart | Click any bar to drill |
| Line Chart | Click any point to drill |
| Pie/Donut | Click any slice to drill |
| Area Chart | Click any area segment |
| Table | Click any row to drill |
| KPI | Click the metric to see breakdown |
Interactivity During Presentations
When presenting a canvas, all interactivity remains active:
Live Exploration
- Click charts to drill during your presentation
- Audience can ask "show me more detail" and you can drill in real-time
- No need to switch to other tools or applications
Data Updates
- Visualizations reflect latest data sync
- Present with confidence that numbers are current
- Changes made to source data appear automatically
Collaborative Exploration
When sharing a canvas with others:
- They can drill and explore independently
- Each user's exploration is independent
- Original visualization remains unchanged
Linking Charts and Tables
Create connected dashboards where selections in one element affect others:
Using Prompts for Cross-Filtering
- Add a prompt to your canvas (e.g., Region selector)
- Link multiple charts/tables to that prompt
- When a user selects "West," all linked elements filter
See Prompts for detailed setup instructions.
Drill Relationships
When charts share the same dataset:
- Drilling on one provides context for others
- Use this for investigation-style dashboards
- Combine overview charts with detail tables
Best Practices
Design for Exploration
- Include multiple drill dimensions in your datasets
- Don't over-filter source data—keep dimensions available
- Add columns that enable meaningful breakdowns
Visual Cues
- Add "Click to drill" labels during onboarding
- Use consistent chart types for similar data
- Position related charts near each other
Performance
- Large datasets may take a moment to drill
- Consider pre-aggregating very large sources
- Test drill performance before presenting
Dashboard Layout
┌────────────────────────────────┐
│     Overview Chart (drillable) │
├──────────────┬─────────────────┤
│  Detail      │   Detail        │
│  Chart 1     │   Table         │
│  (drillable) │   (drillable)   │
└──────────────┴─────────────────┘
Troubleshooting
No Drill Options Appear
- Verify dataset has additional columns beyond what's charted
- Check that columns are included (not excluded) in dataset settings
- Ensure you're clicking directly on a chart element
Drill Shows Unexpected Results
- Check if filters are applied to the visualization
- Verify the drill dimension has data for the selected element
- Look for null values that may not group correctly
Chart Doesn't Update
- Refresh the canvas
- Check dataset sync status
- Verify source data has changed
Related Topics
- Prompts - Add filter controls to your canvas
- Sheetlets - Include editable spreadsheet data
- KPI Summaries - Highlight key metrics
- Presenting a Canvas - Present with live data
Updated 8 months ago