Presenting a Canvas
Deliver live, interactive data presentations
Scoop presentations go beyond static slides. Present with live data that updates in real-time, drill into charts during your presentation, and respond to audience questions by exploring data on the fly.
What Makes Scoop Presentations Different
| Traditional Presentations | Scoop Presentations |
|---|---|
| Static screenshots of data | Live, current data |
| Fixed views only | Drill into any chart |
| Updates require re-export | Data refreshes automatically |
| Q&A requires switching apps | Answer questions in real-time |
| One-way delivery | Interactive exploration |
Understanding Frames
Frames are containers on your canvas that become slides in presentation mode. Each frame captures a portion of your canvas to display full-screen during presentation.
Creating Frames
- Open your canvas in edit mode
- Click Add Frame in the left toolbar
- Click where you want to place the frame
- Drag to position and resize
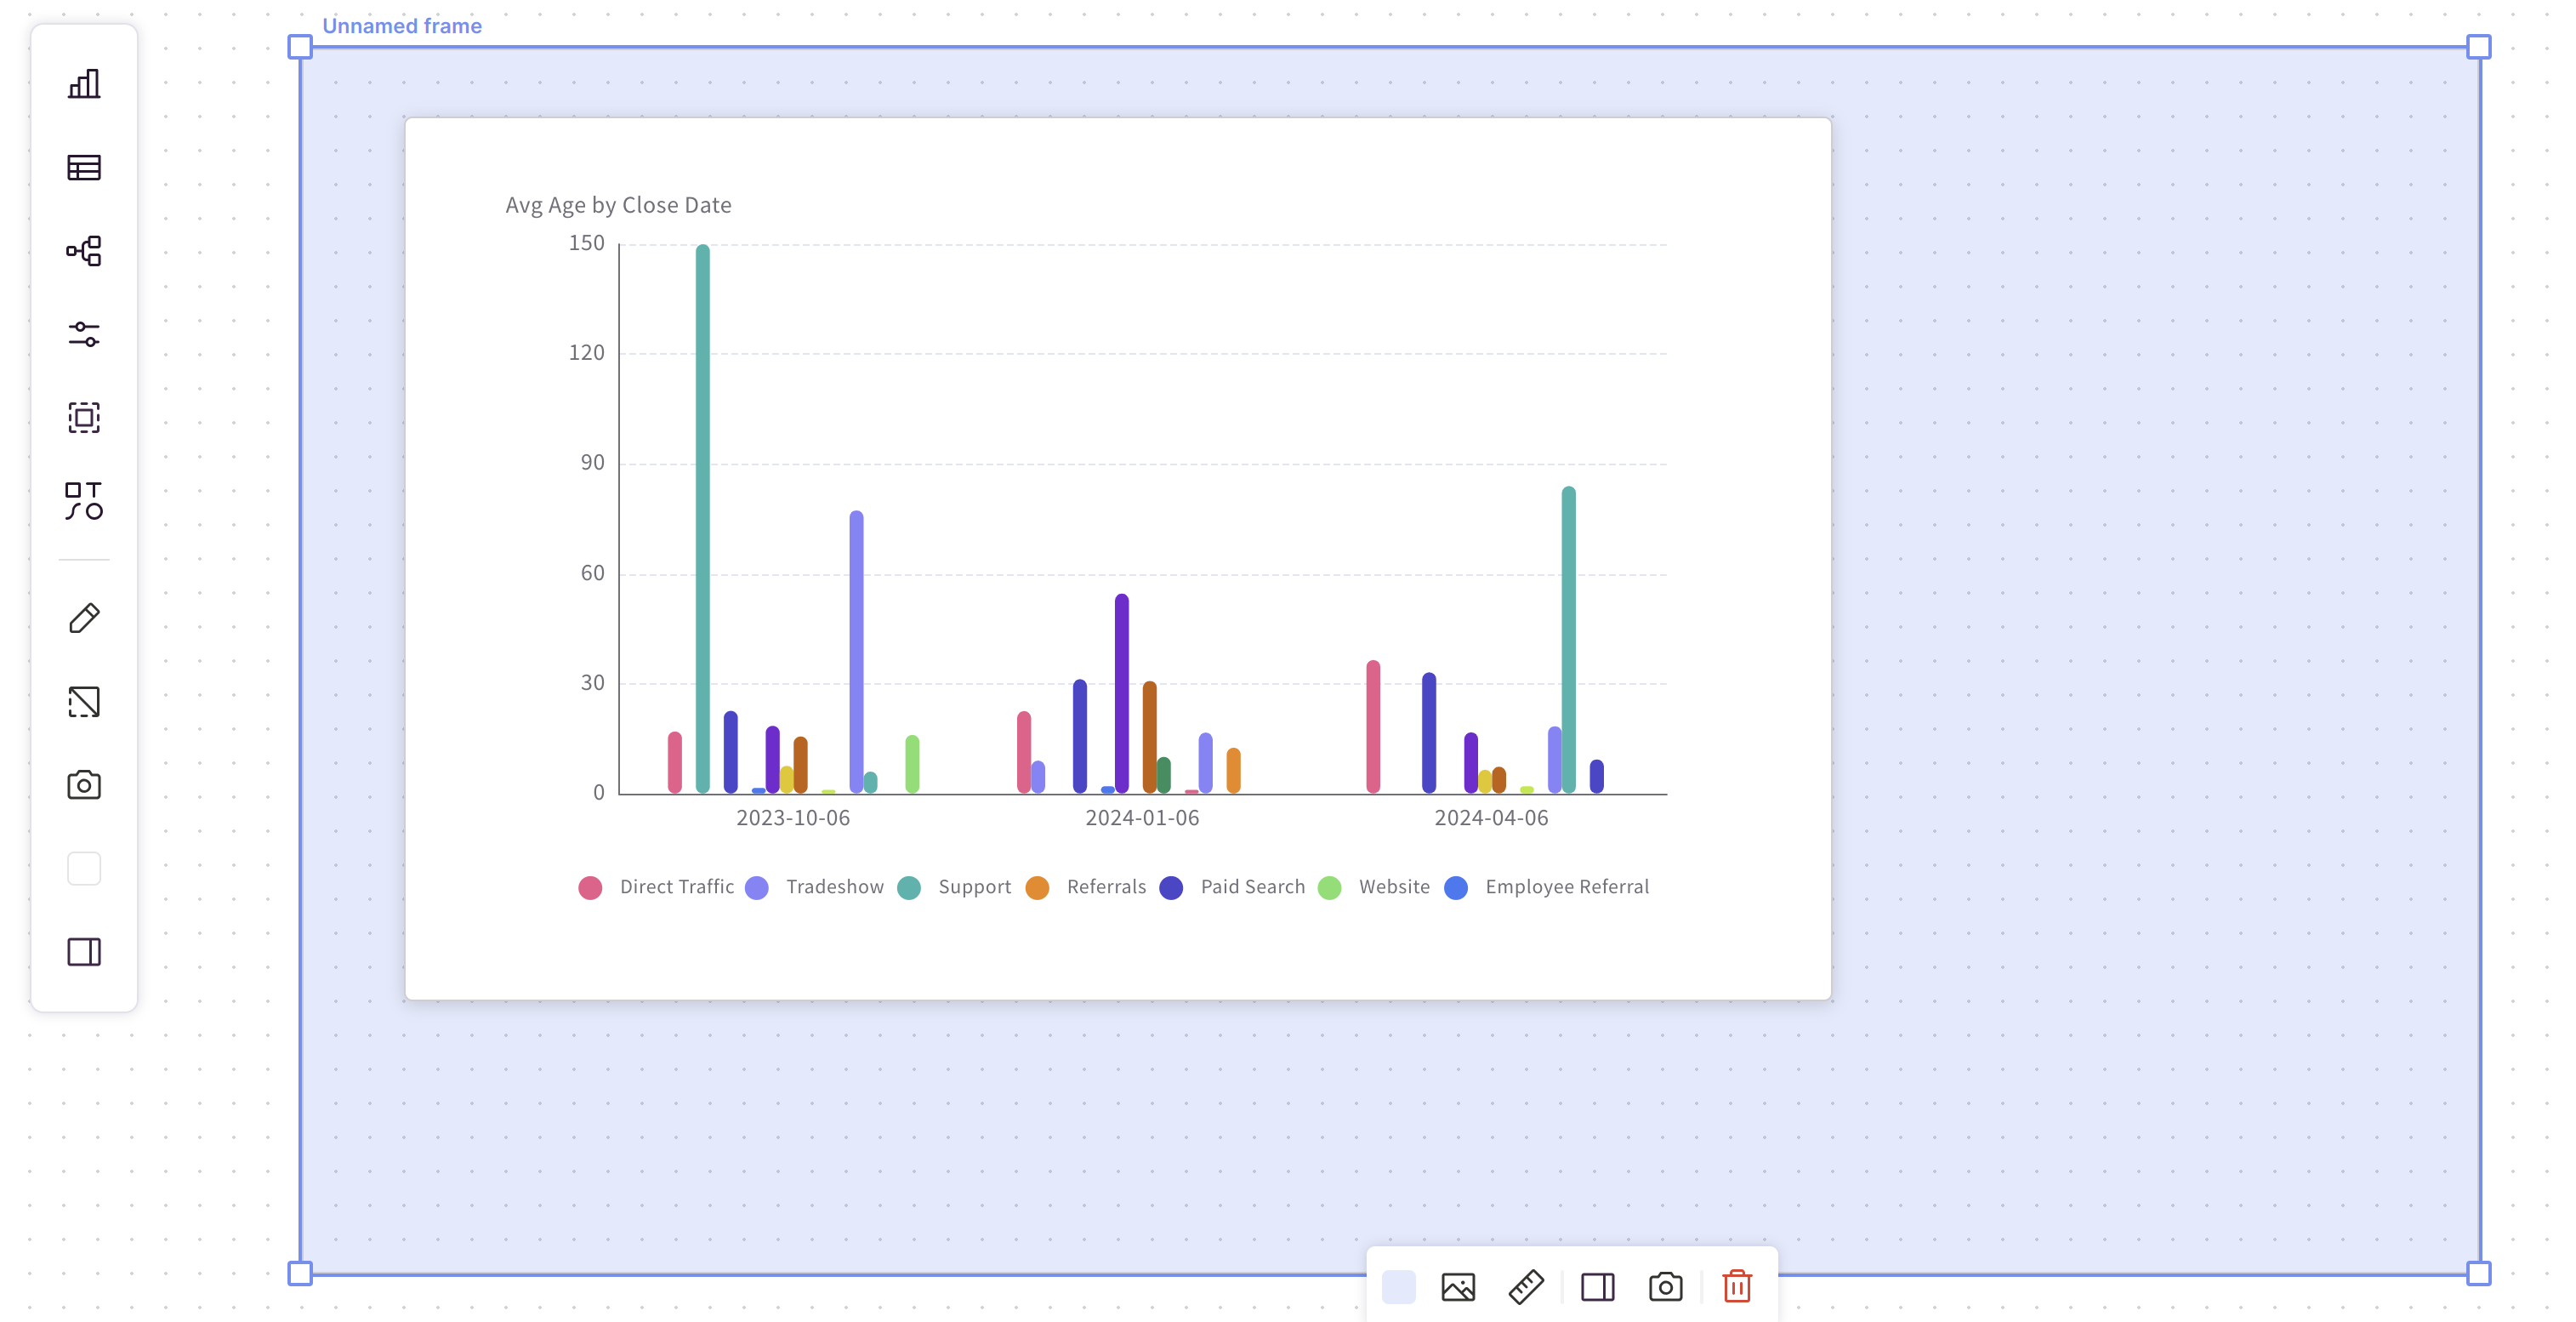
Frame Properties
When a frame is selected, the frame toolbar appears at the bottom:
| Option | Description |
|---|---|
| Background color | Set solid color background |
| Background image | Use an image for stylized backgrounds |
| Size | Choose Large, Medium, or Small |
| Manage frames | Open the frame management window |
| Set as thumbnail | Use this frame as canvas thumbnail |
| Delete | Remove the frame |
Naming Frames
Double-click the frame name in the upper left to rename it. Use descriptive names like:
- "Executive Summary"
- "Q4 Revenue"
- "Regional Breakdown"
- "Pipeline Analysis"
Presenting Your Canvas
Starting a Presentation
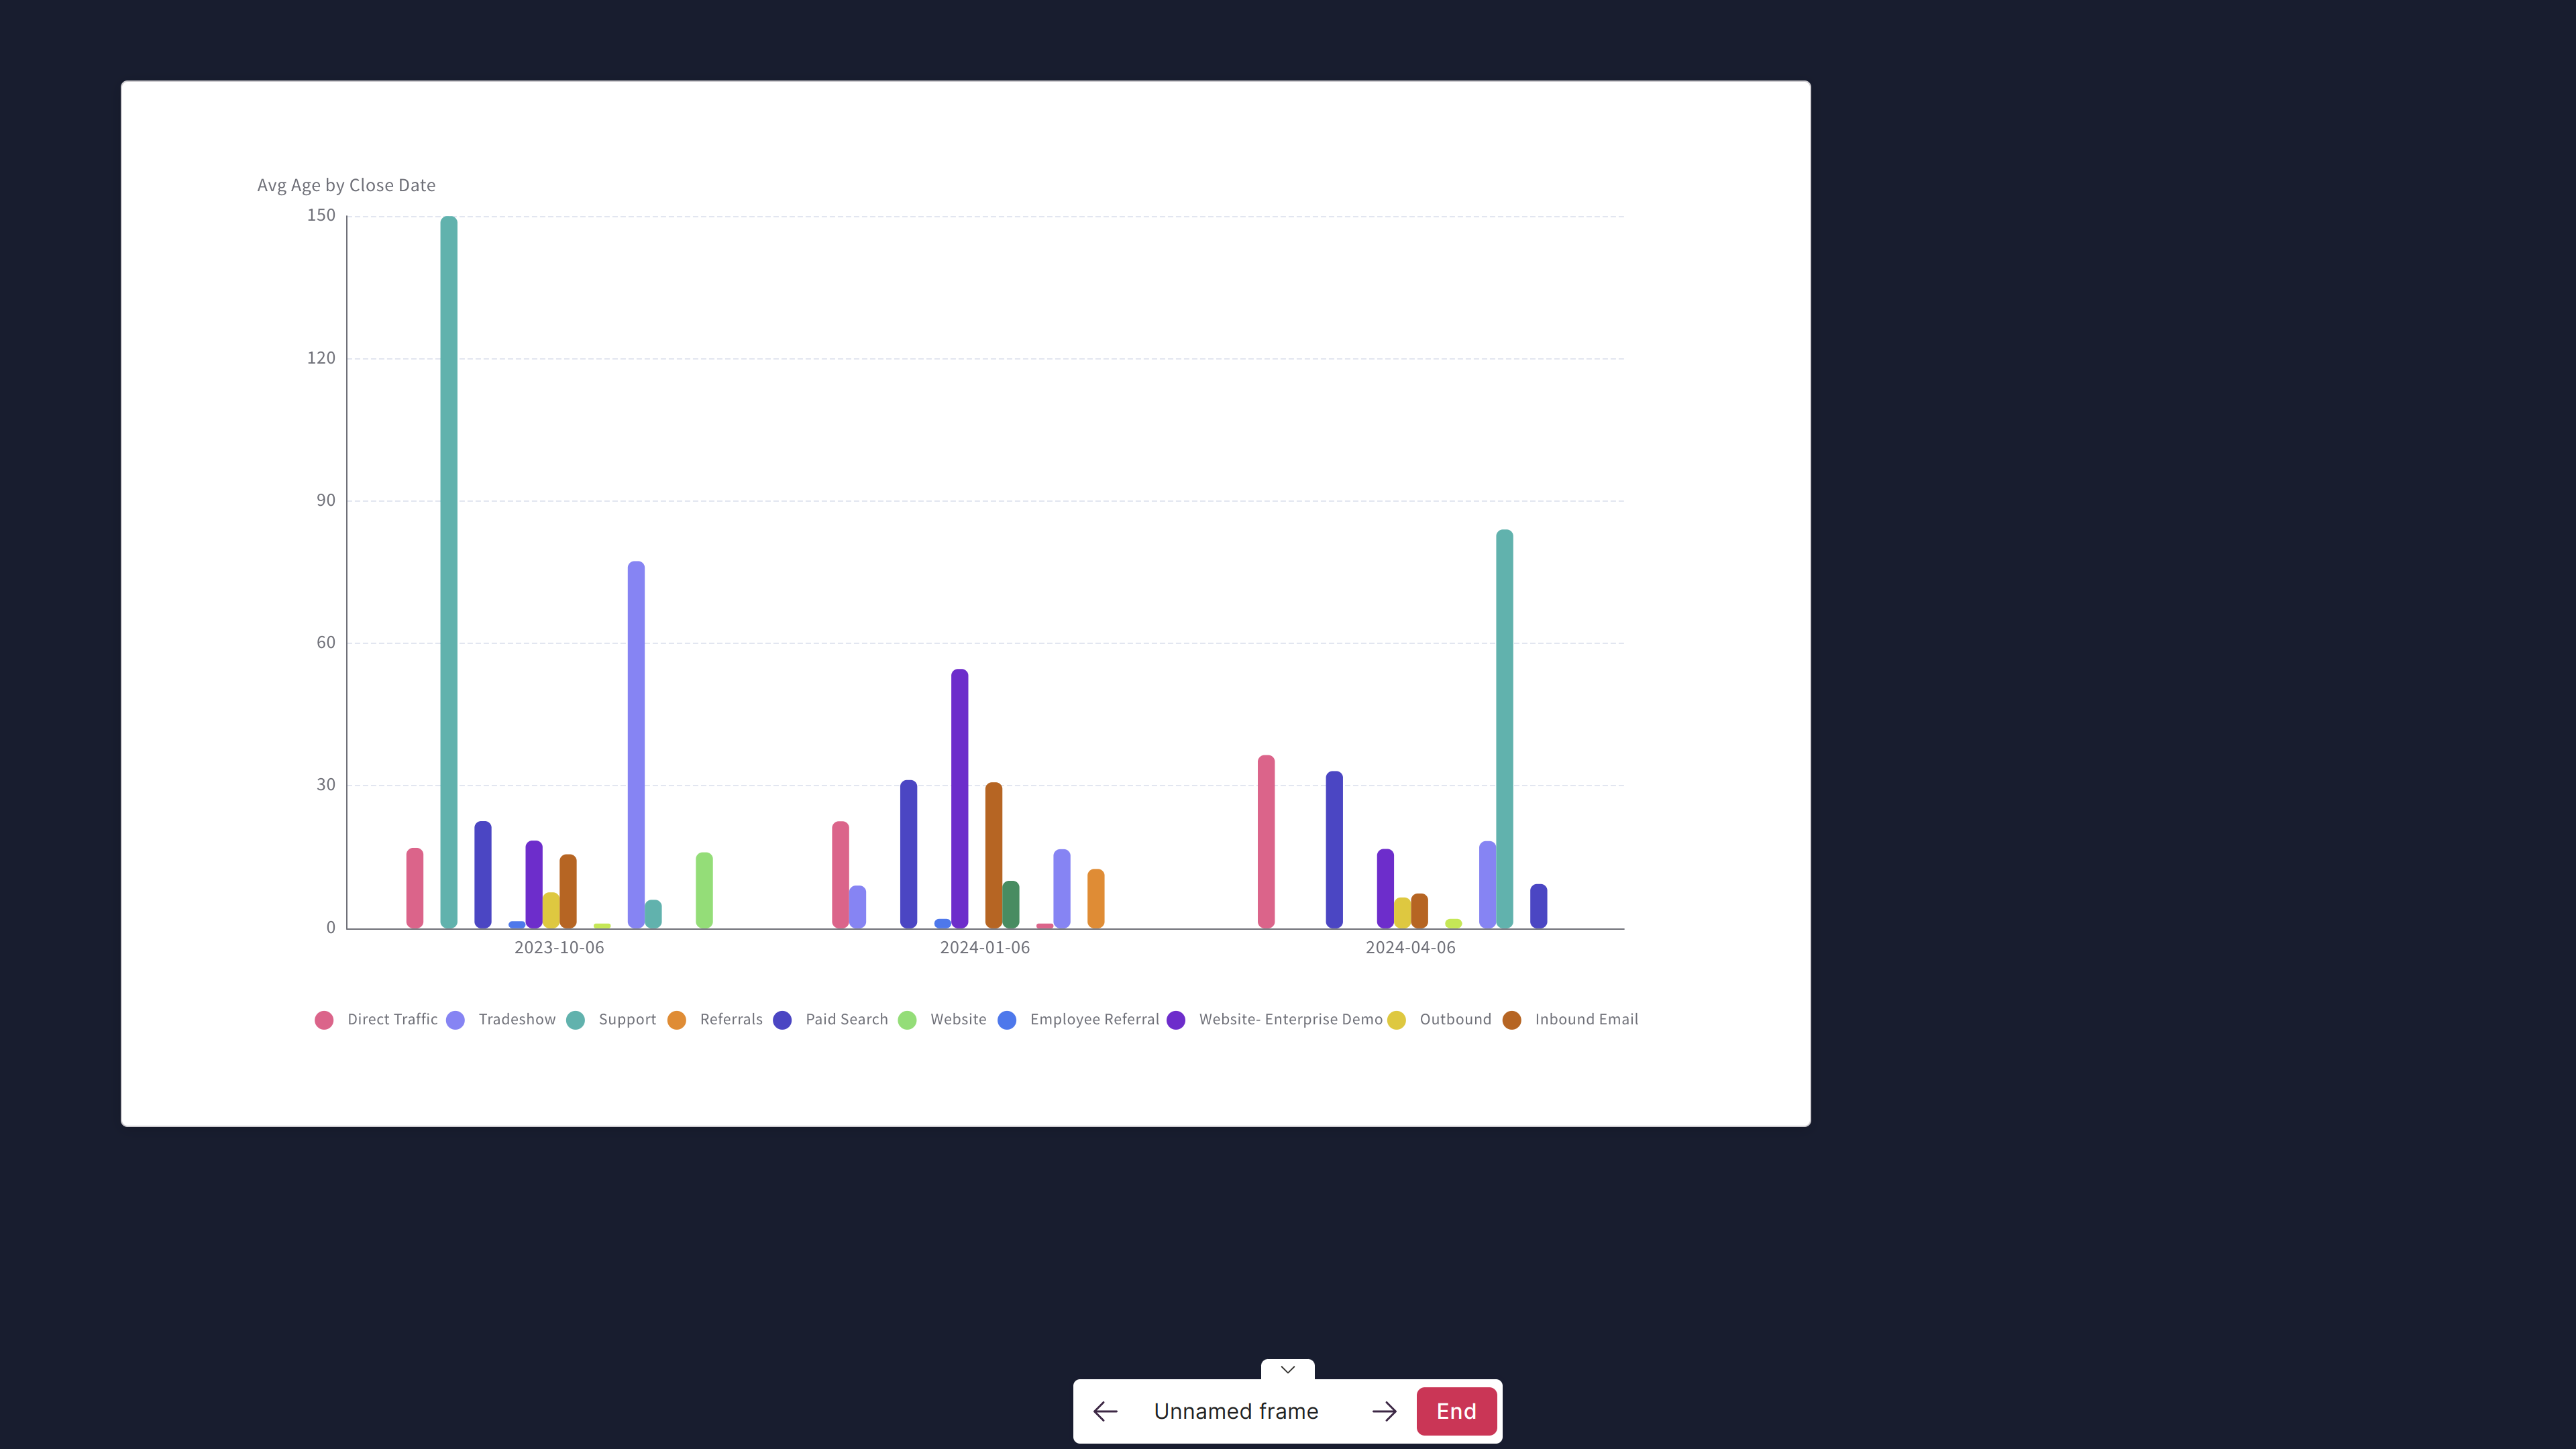
Click the Present icon in the upper toolbar to enter presentation mode.
Your presentation:
- Goes full-screen
- Shows frames in the order defined in Manage Frames
- Keeps all interactivity active
Navigation Controls
| Control | Action |
|---|---|
| Right arrow / Click forward | Next slide |
| Left arrow / Click back | Previous slide |
| Escape key | End presentation |
| Navigation arrows | Bottom of screen controls |
Live Interactivity During Presentations
The defining feature of Scoop presentations is that everything remains live:
Drilling Into Charts
Click any chart element to drill down:
- Click a bar to see breakdown by another dimension
- Use breadcrumbs to navigate back
- Explore data in response to audience questions
Editing Sheetlets
Change values in sheetlets during presentation:
- Click a cell and type a new value
- Watch dependent calculations update
- See linked charts reflect the change instantly
Adjusting Filters
Use prompts and filters while presenting:
- Change region to show different territory data
- Adjust date ranges to compare periods
- Filter to specific segments for focused analysis
Frame Design Best Practices
Layout Principles
┌─────────────────────────────────────────────┐
│  Title (clear, concise)                      │
├─────────────────────────────────────────────┤
│  ┌──────────────────┐  ┌──────────────────┐ │
│  │                  │  │                  │ │
│  │   Main Visual    │  │  Supporting      │ │
│  │                  │  │  Visual          │ │
│  └──────────────────┘  └──────────────────┘ │
│                                             │
│  Key Insight or Annotation                  │
└─────────────────────────────────────────────┘
Content Guidelines
- One main message per frame — Don't overcrowd
- Clear titles — State the insight, not just the data
- Visible interactivity — Show drillable elements
- Consistent layout — Use similar structure across frames
Visual Considerations
- Ensure text is readable at presentation distance
- Use contrasting colors for visibility
- Test on the actual presentation display
- Consider room lighting conditions
Managing Frames
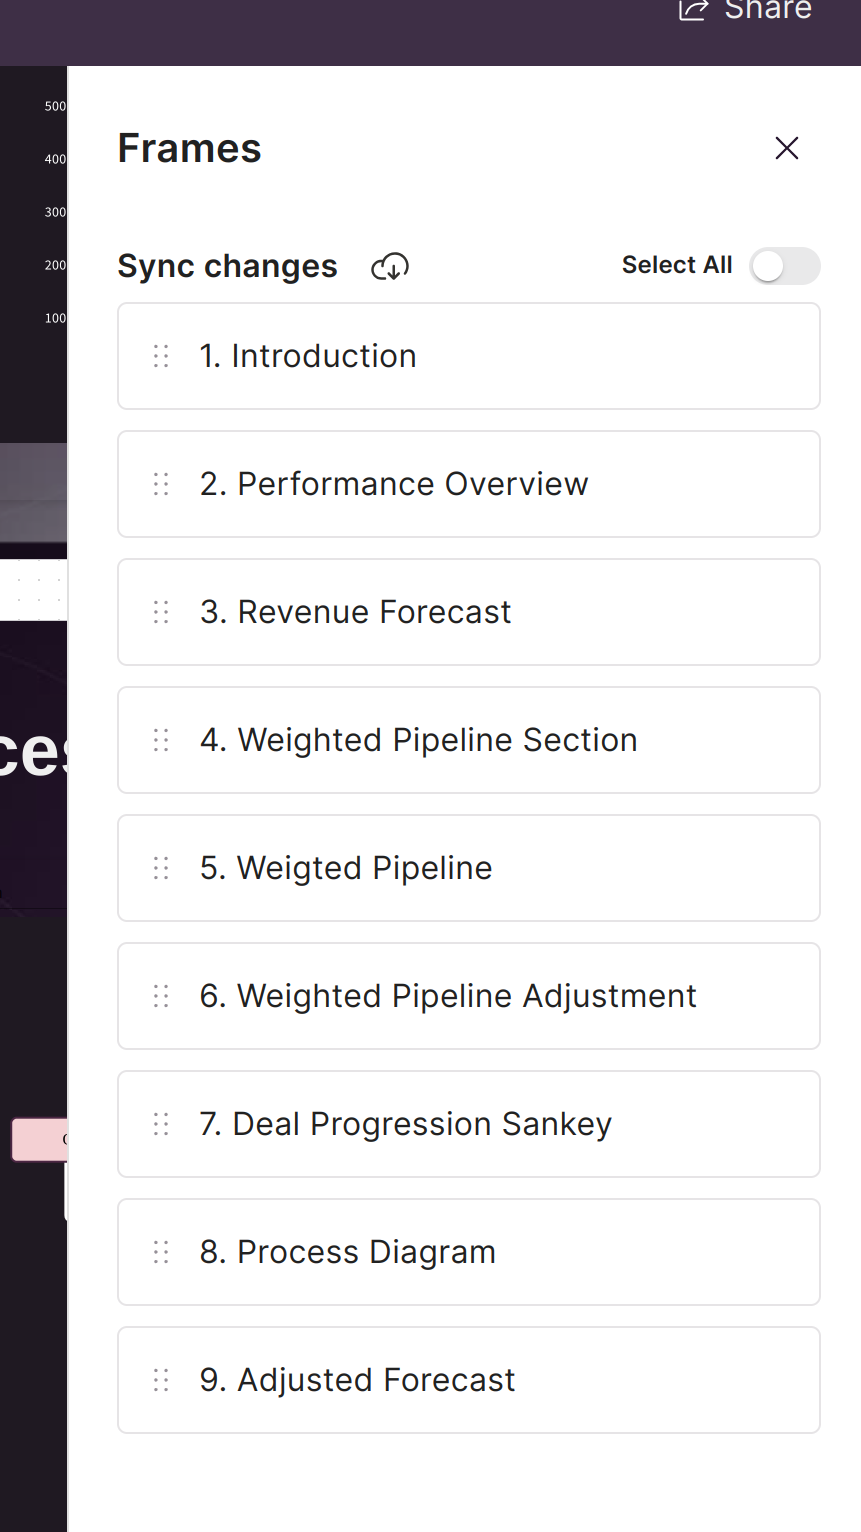
Accessing Frame Management
Click Manage Frames in the frame toolbar or canvas menu to open the management window.
Frame Operations
| Operation | How To |
|---|---|
| Reorder | Drag frames to change sequence |
| Hide | Toggle visibility for frames you want to skip |
| Sync | Update from Google Slides (imported presentations) |
| Delete | Remove unwanted frames |
Presentation Flow
The order in Manage Frames determines your presentation sequence:
- First frame shown when presentation starts
- Arrow keys move through in order
- Hidden frames are skipped
Working with Imported Presentations
If you imported from PowerPoint, frames can sync with Google Slides:
- Make edits in Google Slides
- Open Manage Frames in Scoop
- Select frames to synchronize
- Click Sync to update backgrounds
This lets you:
- Update branding without reimporting
- Fix text or images in slides
- Keep Scoop data visualizations intact
See Importing PowerPoint for details.
Presentation Scenarios
Board Meeting
- Pre-build frames with key metrics
- During Q&A, drill into any chart
- Change filters to show specific segments
- Update assumptions in sheetlets to model scenarios
Sales Review
- Show pipeline with live CRM data
- Drill by rep, region, or product
- Compare to previous periods on the fly
- Adjust forecast assumptions live
Executive Dashboard Review
- Present KPIs frame by frame
- Investigate anomalies by drilling down
- Answer "why" questions with real-time exploration
- No need to say "I'll get back to you on that"
Tips for Effective Presentations
Before Presenting
- Test all interactive elements
- Verify data is current
- Check prompts have appropriate defaults
- Preview on the actual display
During Presentation
- Use drilling to answer questions
- Let the audience guide exploration
- Don't over-click—stay focused on the narrative
- Use sheetlets to model "what if" scenarios
Handling Questions
- Drill into relevant data immediately
- Use filters to focus on specific segments
- Show the data rather than promising to follow up
- Return to your flow using frame navigation
Troubleshooting
Presentation Won't Start
- Ensure at least one frame exists
- Check frames aren't all hidden
- Verify browser allows full-screen
Charts Not Responding
- Confirm charts are from datasets (not images)
- Check drilling is enabled
- Refresh the canvas if data seems stale
Navigation Issues
- Use keyboard arrows if on-screen controls don't work
- Press Escape if stuck
- Check frame order in Manage Frames
Related Topics
- Sharing a Canvas - Share presentations with others
- Interactive Charts - Drillable visualizations
- Prompts - Filter controls
- Importing PowerPoint - Import existing decks
Updated 8 months ago