Dataset Queries
Filter, aggregate, and shape data from your Scoop datasets
Dataset queries let you extract, filter, and transform data from your Scoop datasets. Use them when blending datasets, pulling data into Google Sheets, or creating aggregated views of your data.
Where Queries Are Used
| Context | Purpose |
|---|---|
| Blending Datasets | Define source data for each input |
| Google Sheets Plugin | Pull live data into spreadsheets |
| Aggregated Datasets | Create summarized views |
Query Configuration
Basic Options
Date Range
Control the time period of data returned:
| Option | Behavior | Best For |
|---|---|---|
| Use latest snapshot | Only the most recent snapshot | Current-state analysis |
| Start date | All data from date forward | Historical analysis |
| All data | Everything in dataset | Complete exports |
Snapshot datasets: "Use latest snapshot" gives you point-in-time state, while a date range gives you historical snapshots.
Dataset Source
Select which dataset and table to query:
- Dataset — The Scoop dataset to pull from
- Table — If dataset has multiple tables, select which one
Column Selection
Check the columns you want in your query results. Only selected columns appear in the output.
Tips:
- Select only needed columns for better performance
- Include key columns for blending
- Deselect sensitive columns for sharing
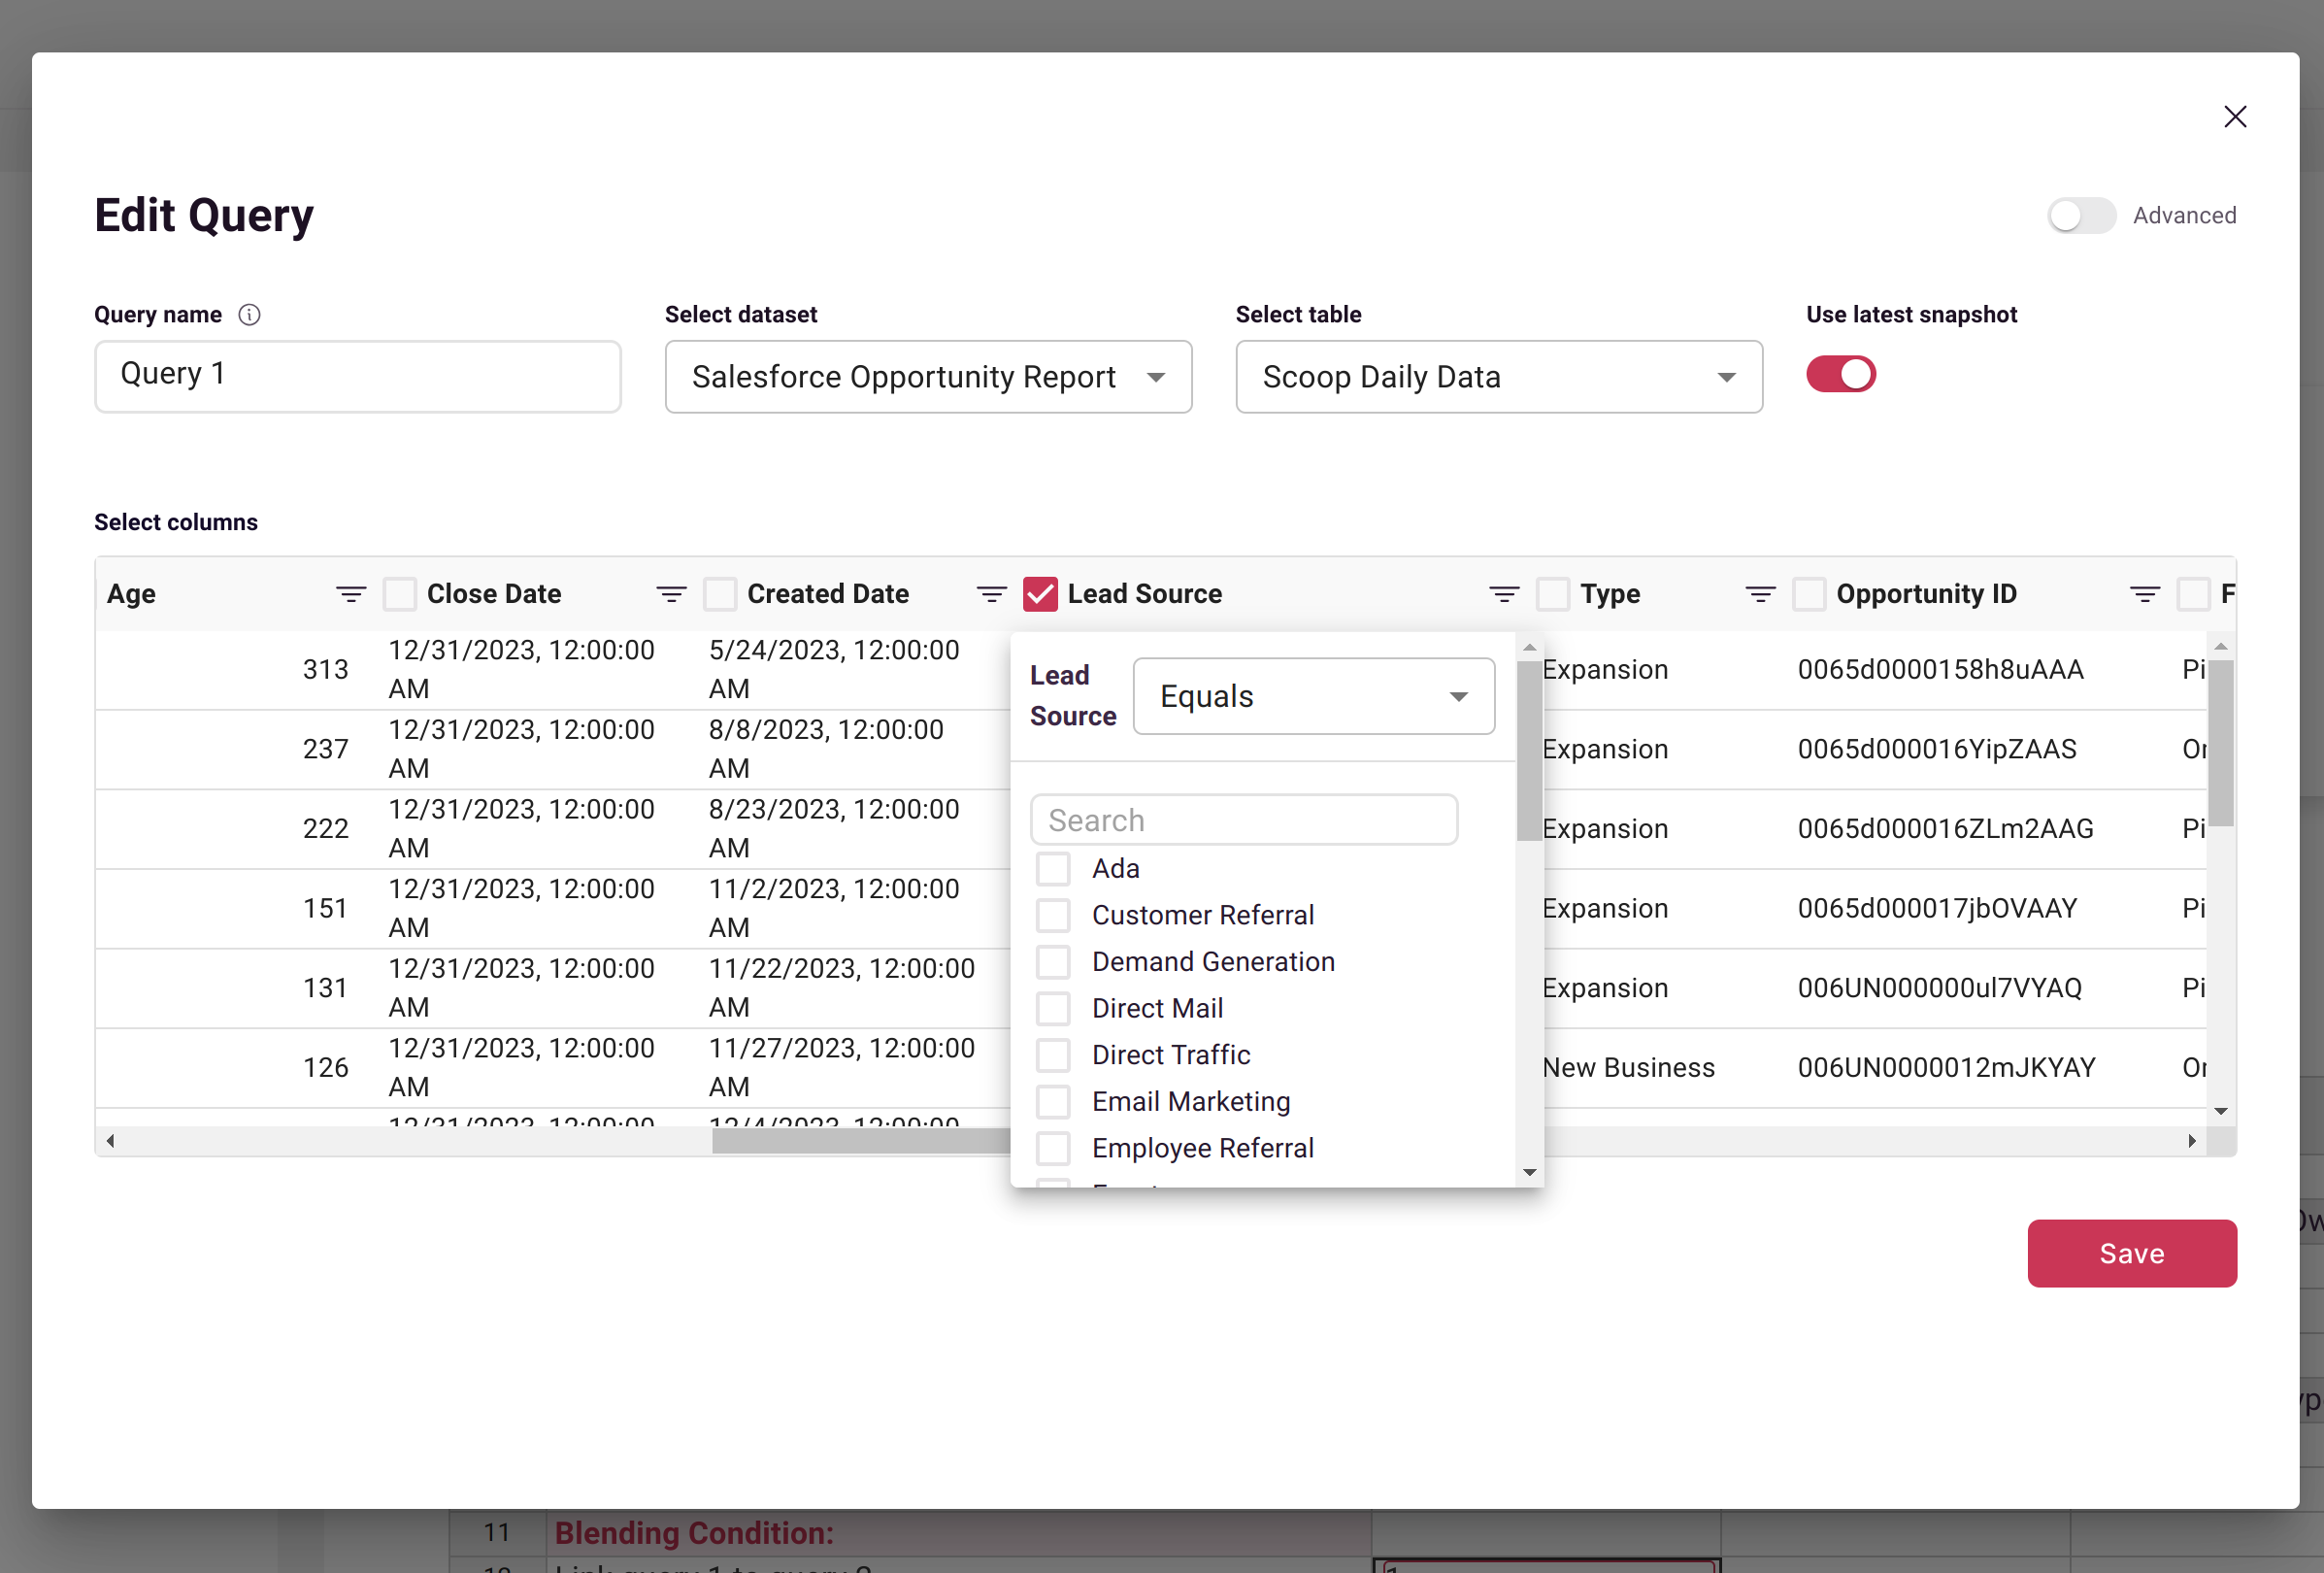
Column Filters
Click the filter icon next to any column to add conditions:
| Filter Type | Example |
|---|---|
| Equals | Stage = "Closed Won" |
| Not equals | Status ≠ "Cancelled" |
| Contains | Name contains "Corp" |
| Greater/Less than | Amount > 10000 |
| In list | Region in (West, East) |
| Date range | Created after 2024-01-01 |
Multiple filters combine with AND logic.
Advanced Options
Click Advanced to access additional query capabilities:
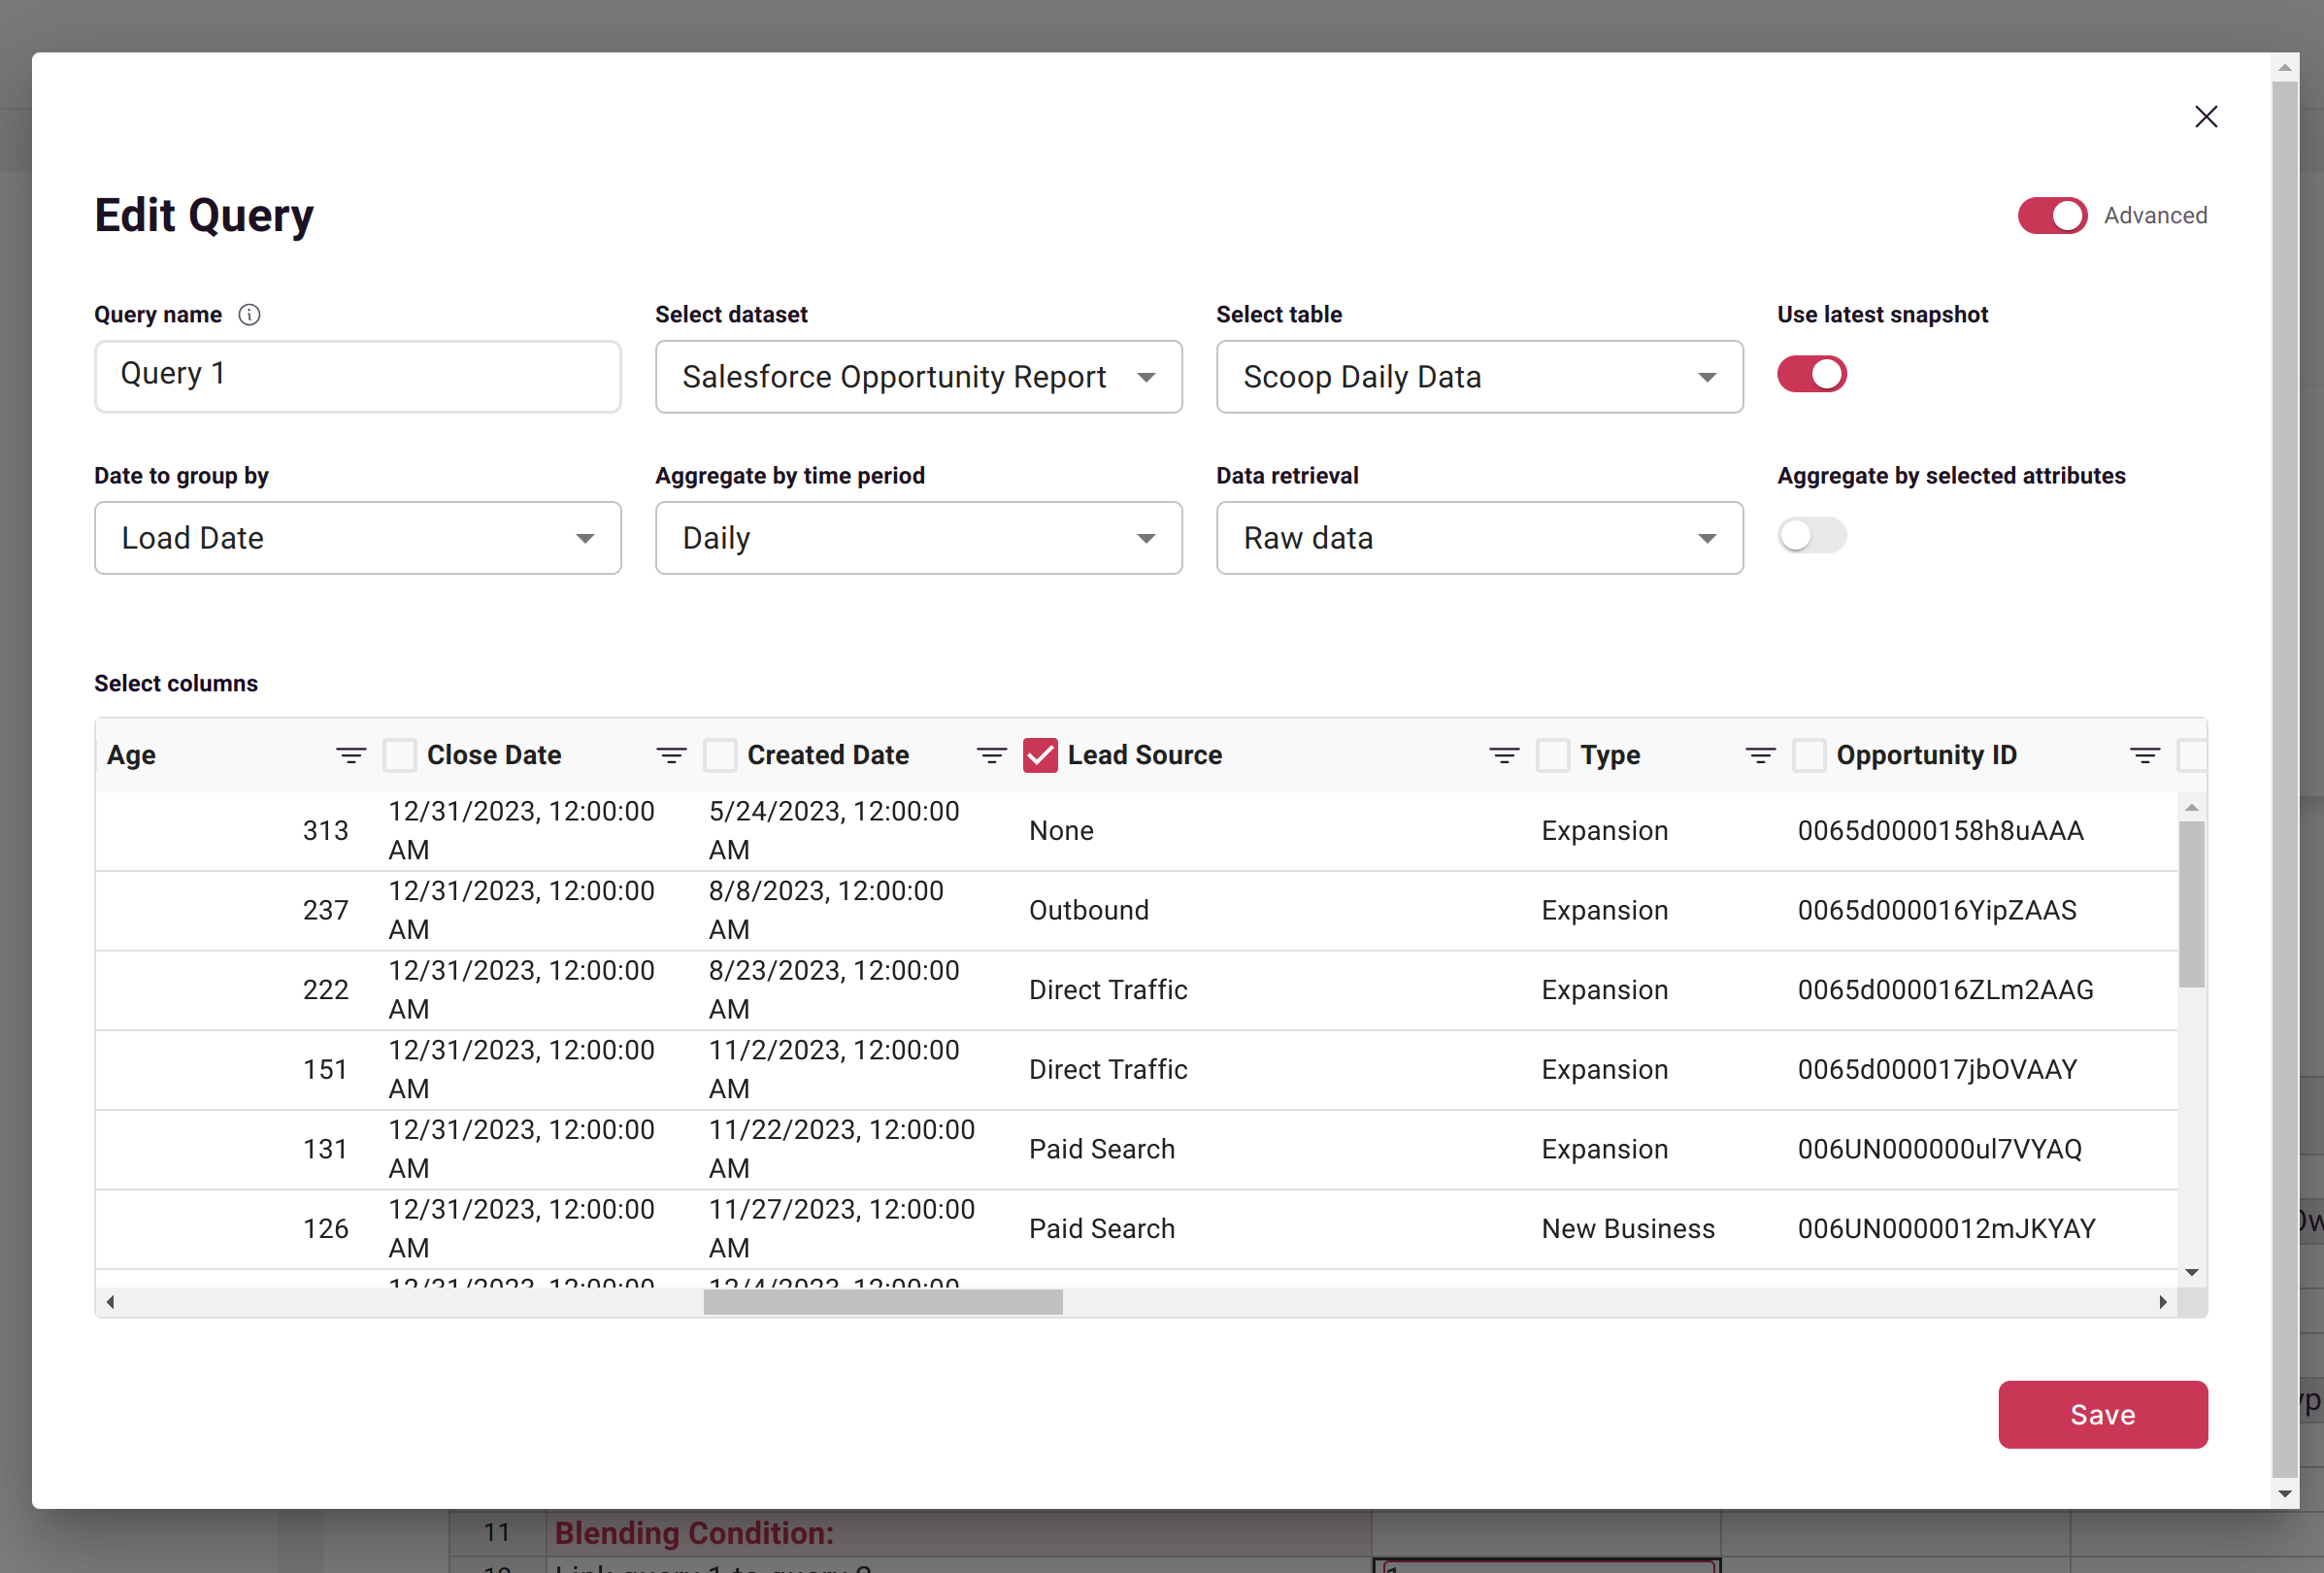
Date to Group By
By default, Scoop uses the load date (when data was ingested). Switch to a business date in your data for more meaningful analysis.
| Date Type | Example | Use When |
|---|---|---|
| Load date | When CSV was uploaded | Tracking data freshness |
| Close date | When deal closed | Revenue by close period |
| Created date | When record created | Volume over time |
| Custom date | Any date column | Domain-specific analysis |
See Intelligent Date Handling for details.
Aggregation
Aggregate by Selected Attributes
When enabled, numbers are summed and grouped by selected text columns:
Example: Sales data with Rep, Region, Amount
| Without Aggregation | With Aggregation |
|---|---|
| Row-by-row detail | Totals by Rep + Region |
| 10,000 rows | 50 rows |
| Individual transactions | Grouped summaries |
Why aggregate?
- Reduce data volume for blending
- Match aggregation levels between datasets
- Create summary views
Aggregate by Time Period
Control the time granularity of aggregated data:
| Period | Result |
|---|---|
| Daily | One row per day |
| Weekly | One row per week |
| Monthly | One row per month |
| Quarterly | One row per quarter |
| Annual | One row per year |
Example: Daily transactions → Monthly totals
Data Retrieval Mode
For snapshot datasets, choose what data to retrieve:
| Mode | Returns | Use For |
|---|---|---|
| Snapshots | Point-in-time states | Current state analysis |
| Changes | Detected transitions | Change analysis, process flows |
Changes mode returns:
- What value changed (column)
- From what value
- To what value
- When the change occurred
Useful for detailed lifecycle analysis without building custom queries.
Query Examples
Simple Filter Query
Goal: Get all closed-won deals from Q4
Configuration:
- Date range: 2024-10-01 to 2024-12-31
- Columns: Deal ID, Name, Amount, Rep
- Filter: Stage = "Closed Won"
Aggregated Summary
Goal: Monthly revenue by region
Configuration:
- Columns: Region, Amount
- Aggregate by: Region
- Time period: Monthly
- Date: Close Date
Result: One row per region per month with total amount
Change Analysis
Goal: Track deal stage changes
Configuration:
- Data retrieval: Changes
- Columns: Deal ID, Stage, Change Date
- Filter: Stage column changes
Result: Every stage transition with before/after values
Blending Preparation
Goal: Summarize support tickets by account for blending with CRM
Configuration:
- Columns: Account ID, Ticket Count, Avg Resolution Time
- Aggregate by: Account ID
- Time period: Monthly
Result: One row per account with ticket metrics, ready to blend with CRM account data
Filter Syntax Reference
Text Filters
| Condition | Syntax |
|---|---|
| Equals | = "value" |
| Not equals | ≠ "value" |
| Contains | contains "text" |
| Starts with | starts with "text" |
| Ends with | ends with "text" |
| Is empty | is empty |
| Is not empty | is not empty |
Numeric Filters
| Condition | Syntax |
|---|---|
| Equals | = 100 |
| Greater than | > 100 |
| Less than | < 100 |
| Between | 100 to 500 |
| Is empty | is empty |
Date Filters
| Condition | Syntax |
|---|---|
| After | > 2024-01-01 |
| Before | < 2024-12-31 |
| Between | 2024-01-01 to 2024-06-30 |
| This month | this month |
| Last 30 days | last 30 days |
Best Practices
Performance
- Filter data as early as possible
- Select only needed columns
- Use aggregation to reduce row counts
- Choose appropriate date ranges
Data Quality
- Verify filters return expected results
- Test with preview before processing
- Check for NULL handling in filters
Maintainability
- Use consistent date column choices
- Document complex filter logic
- Name blended datasets descriptively
Troubleshooting
No Data Returned
Causes:
- Filters too restrictive
- Date range doesn't contain data
- Wrong table selected
Solutions:
- Remove filters and verify base data exists
- Expand date range
- Check table selection
Too Much Data
Causes:
- Aggregation not enabled
- Too wide date range
- Missing filters
Solutions:
- Enable aggregation by attributes
- Narrow date range
- Add appropriate filters
Wrong Aggregation
Causes:
- Wrong date column selected
- Missing grouping columns
- Incorrect time period
Solutions:
- Verify date column choice
- Select all needed attribute columns
- Adjust time period granularity
Related Topics
- Blending Datasets - Combine data from multiple sources
- Google Sheets Plugin - Pull live data into sheets
- Intelligent Date Handling - Date intelligence
- Snapshot Datasets - Change tracking
Updated 8 months ago