Recipes in Scoop Analytics are pre-built, customizable analytics workflows that transform raw data into complete, ready-to-use dashboards and presentations. Instead of building analysis from scratch, start with a proven template and customize it to your needs.
Recipes are complete analytics packages that include:
| Component | Description |
|---|
| Data Requirements | What fields your data needs |
| Transformations | Calculations and aggregations applied |
| Visualizations | Charts, tables, and KPIs pre-configured |
| Canvas/Presentation | Ready-to-use dashboard layout |
| AI Insights | Automated analysis and recommendations |
Your Data → Recipe → Complete Analytics
   ↓           ↓            ↓
 Raw CSV    Template    Dashboard + Insights
   or       with        ready in minutes
 API Data   logic
- Select a recipe matching your analysis goal
- Connect your data (file upload or app connection)
- Map fields to recipe requirements
- Generate complete canvas with visualizations
- Customize as needed (optional)
| Recipe | What It Does | Data Source |
|---|
| Sales Forecasting | Pipeline analysis, forecast accuracy, deal velocity | CRM opportunities |
| Pipeline Waterfall | Track adds, removes, wins, losses, resizes | CRM opportunities |
| Rep Performance | Individual and team sales metrics | CRM opportunities + users |
| Win/Loss Analysis | Patterns in won vs. lost deals | CRM opportunities |
| Recipe | What It Does | Data Source |
|---|
| Cost Per Lead | Marketing efficiency by channel/campaign | Marketing + Finance |
| Campaign Performance | Campaign ROI and attribution | Marketing platform |
| Lead Conversion | Lead to opportunity conversion rates | Marketing + CRM |
| Funnel Analysis | Stage-by-stage conversion rates | CRM leads/opportunities |
| Recipe | What It Does | Data Source |
|---|
| Customer Health | Health scores and risk indicators | Product usage + CRM |
| Churn Analysis | Patterns in churned vs. retained customers | Subscription data |
| Support Operations | Ticket metrics and agent performance | Support platform |
| NPS Analysis | Score trends and driver analysis | Survey data |
| Recipe | What It Does | Data Source |
|---|
| Inventory Analysis | Stock levels, turnover, reorder alerts | Inventory system |
| Order Fulfillment | Order processing times and bottlenecks | Order management |
| Resource Utilization | Team workload and capacity | Project management |
| Benefit | Description |
|---|
| Speed | Complete analytics in minutes, not days or weeks |
| Best Practices | Built on proven analytical frameworks |
| Consistency | Standardized approach across teams |
| Accuracy | Pre-tested calculations reduce errors |
| Customizable | Adjust anything after generation |
| Reusable | Apply same recipe to updated data |
| Aspect | Recipe | From Scratch |
|---|
| Time to value | Minutes | Hours to days |
| Expertise needed | Minimal | Moderate to high |
| Best practices | Built-in | Must know them |
| Customization | After generation | During build |
| Maintenance | Recipe updates available | Manual updates |
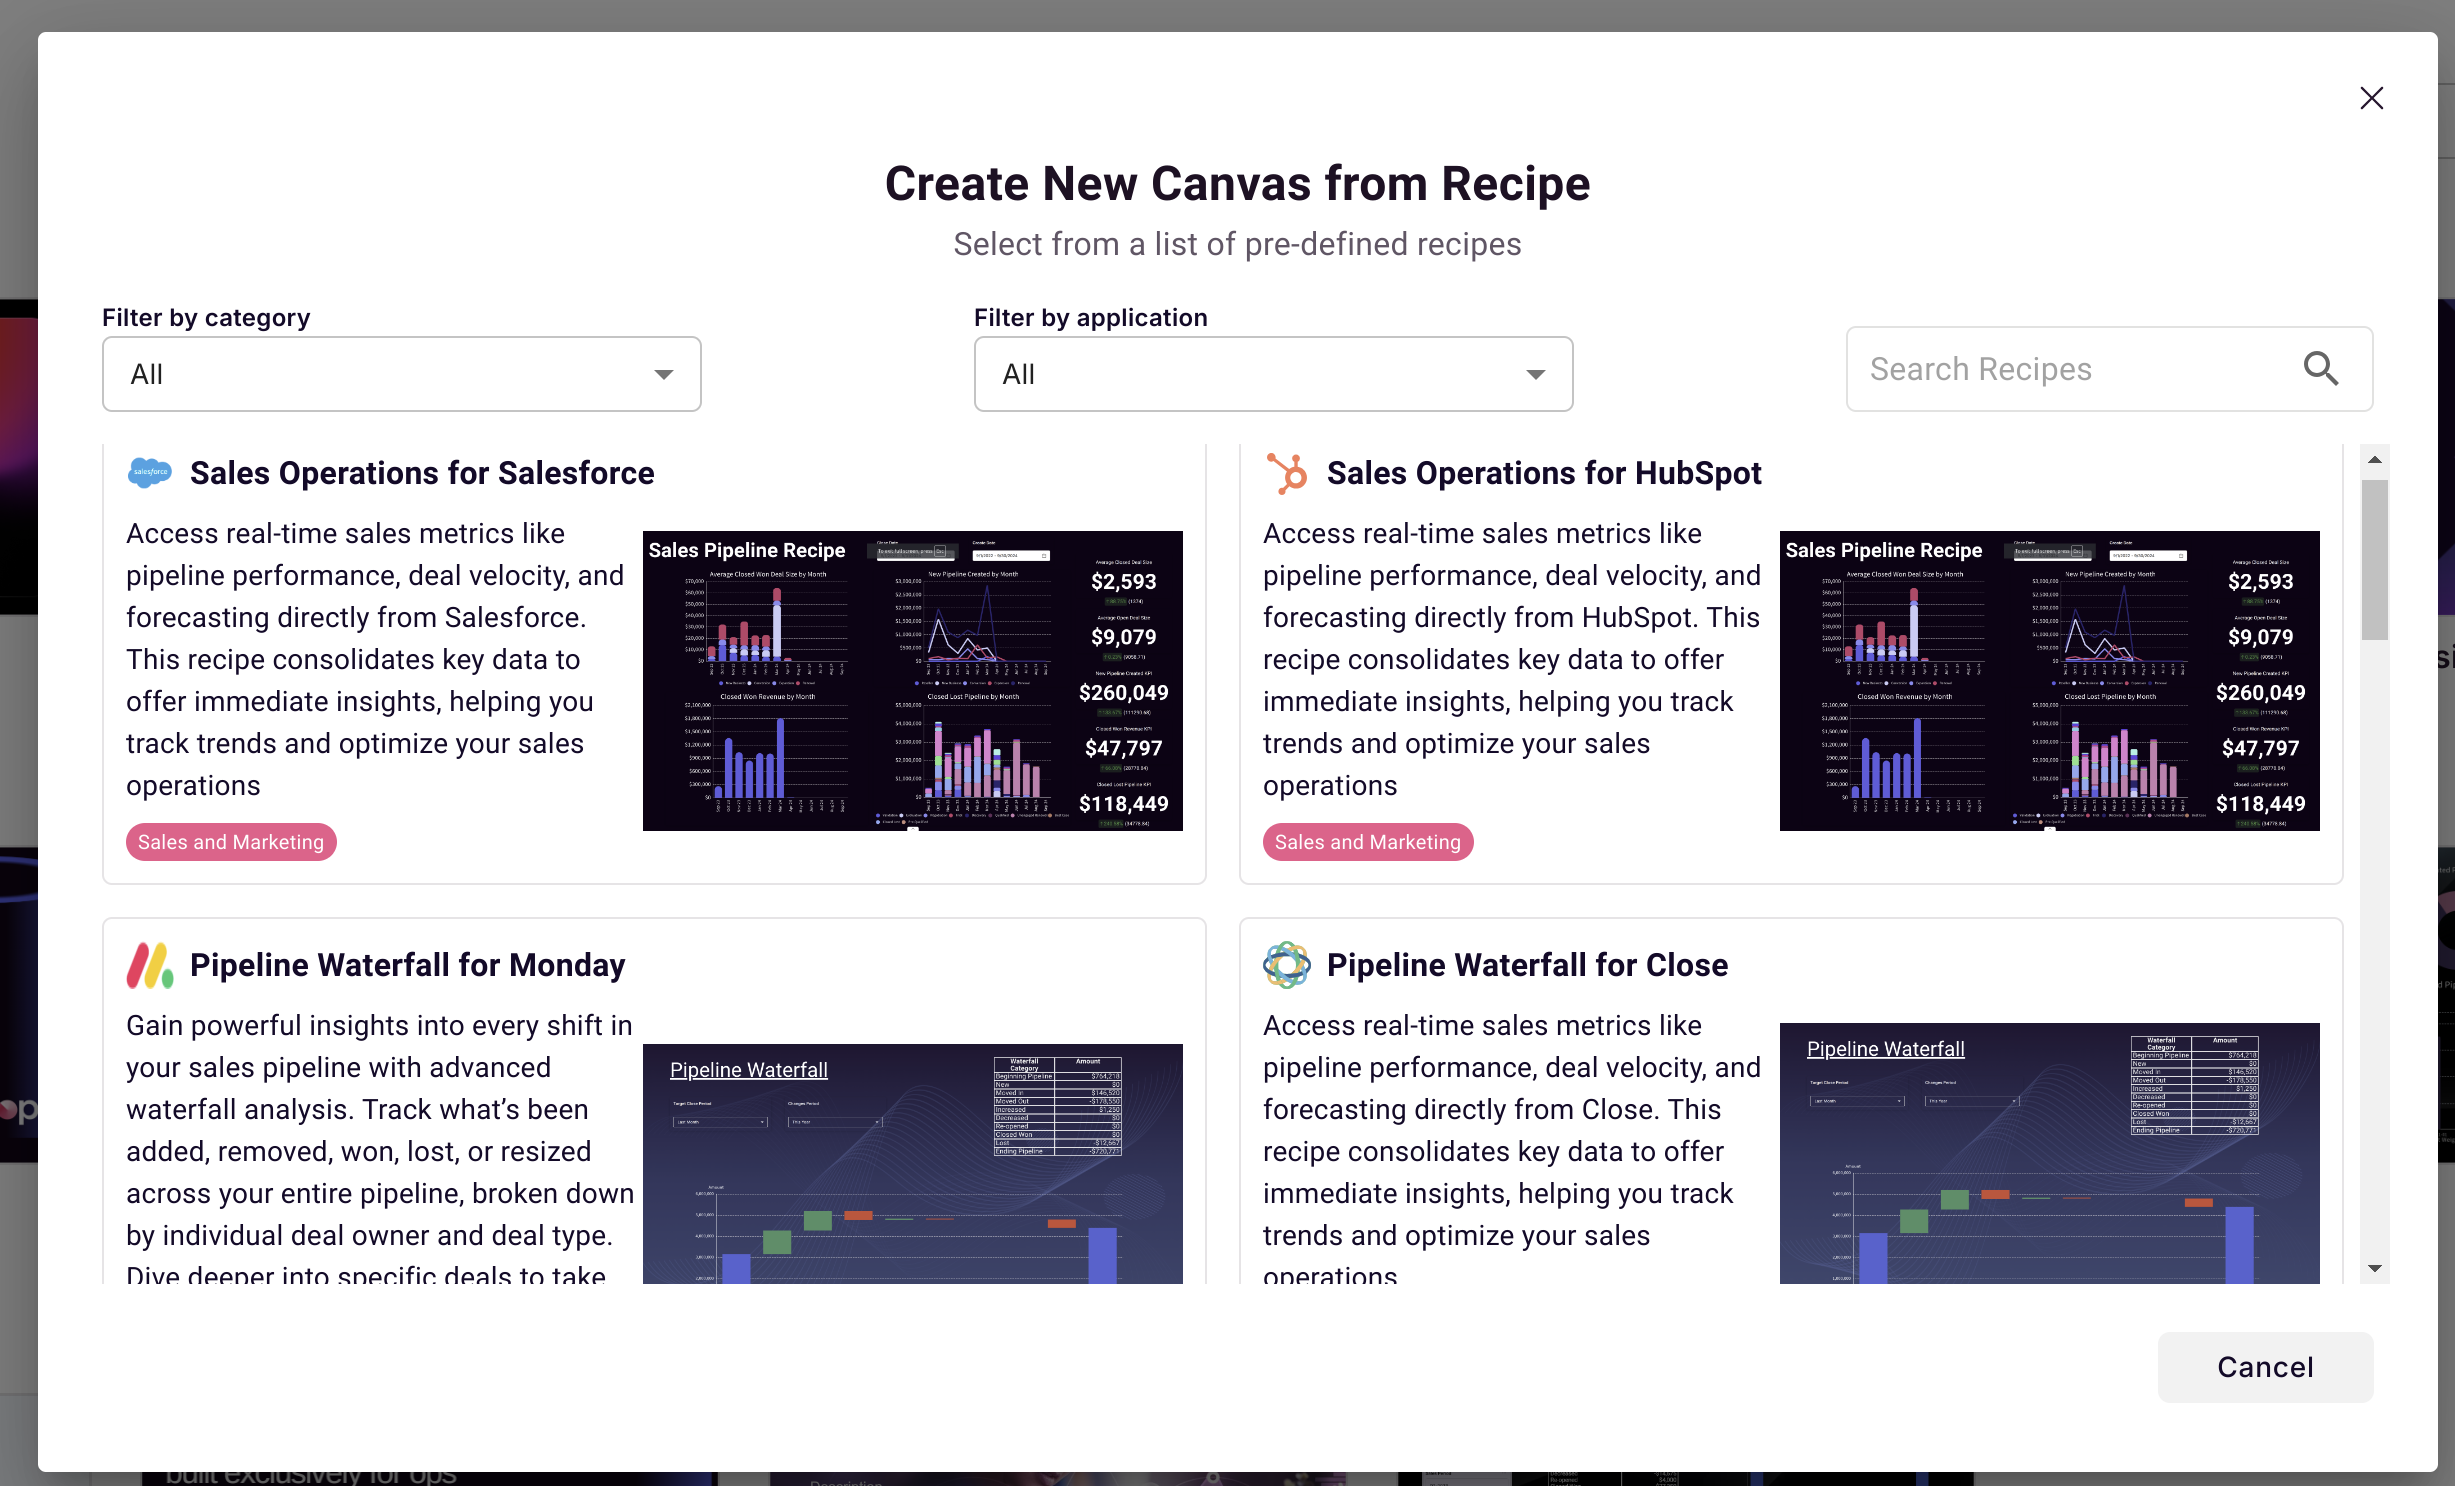
Navigate to Recipes in Scoop and browse available options:
- Filter by category (Sales, Marketing, etc.)
- Read recipe descriptions
- Check data requirements
Each recipe specifies required data:
| Connection Type | Example |
|---|
| SaaS Connector | Salesforce, HubSpot, Jira |
| File Upload | CSV or Excel with required columns |
| Existing Dataset | Previously loaded Scoop data |
Match your data fields to recipe requirements:
| Recipe Expects | Your Field Name |
|---|
| Opportunity ID | deal_id |
| Amount | contract_value |
| Stage | sales_stage |
| Close Date | expected_close |
Scoop automatically suggests mappings based on column names.
Click Generate and Scoop creates:
- All calculated columns and metrics
- Configured visualizations
- Laid-out canvas with interactive elements
- AI-generated insights
The generated canvas is fully editable:
- Move or resize visualizations
- Add additional charts
- Modify calculations
- Apply your visual theme
The Sales Forecasting recipe demonstrates how recipes work in practice.
A single CRM export with these fields:
| Field | Purpose | Example |
|---|
| Opportunity ID | Unique identifier for snapshotting | OPP-001 |
| Opportunity Name | Human-readable reference | Acme Corp Deal |
| Amount | Deal value | $50,000 |
| Stage | Current pipeline stage | Proposal |
| Owner | Assigned rep | Jane Smith |
| Expected Close | Forecast date | 2024-03-15 |
| Created Date | When opened | 2024-01-01 |
| Chart | Shows |
|---|
| Pipeline Waterfall | Adds, wins, losses, resizes |
| Stage Funnel | Conversion rates between stages |
| Forecast vs. Actual | Prediction accuracy over time |
| Deal Velocity | Time in each stage |
| Rep Performance | Pipeline by rep |
| Metric | Calculation |
|---|
| Win Rate | Won / (Won + Lost) |
| Average Deal Size | Sum(Amount) / Count(Won) |
| Average Sales Cycle | Days from Create to Close |
| Pipeline Coverage | Pipeline / Quota |
- Deals at risk of slipping
- Stages with bottlenecks
- Forecast accuracy trends
- Rep performance patterns
Once generated, you can:
- Add filters for specific segments
- Include additional metrics
- Blend with financial data
- Create derived analyses
| Customization | How |
|---|
| Rename fields | Map any column name to requirements |
| Filter data | Include only relevant records |
| Select date range | Focus on specific period |
Everything in the generated canvas is editable:
| Element | Customization Options |
|---|
| Charts | Change type, colors, labels |
| Calculations | Modify formulas, add new metrics |
| Layout | Move, resize, add elements |
| Filters | Add interactive filter controls |
| Theme | Apply your brand colors |
Recipes are starting points. Extend them by:
- Blending additional data sources
- Adding calculated columns
- Creating new visualizations
- Building custom KPIs
For recurring analysis patterns:
- Build your analysis using standard Scoop tools
- Document requirements (data fields, calculations)
- Save as template for reuse
- Share with team for standardization
| Practice | Why |
|---|
| Clean data first | Recipes work best with quality data |
| Include all fields | More fields enable more analysis |
| Use consistent naming | Easier field mapping |
| Check data types | Dates as dates, numbers as numbers |
| Tip | Description |
|---|
| Review suggestions | Scoop auto-maps similar names |
| Map all required fields | Don't skip required fields |
| Include optional fields | Enables additional analysis |
| Tip | Description |
|---|
| Review metrics | Verify calculations match expectations |
| Check visualizations | Ensure data displays correctly |
| Test interactions | Confirm filters and drills work |
| Save before editing | Preserve original as backup |
- Verify all required fields are mapped
- Check data has rows matching requirements
- Ensure date fields are recognized as dates
- Review field mappings for accuracy
- Check for data quality issues
- Verify expected values in source data
- Some charts require specific data patterns
- Check if required fields have data
- Review minimum data requirements