Adding Calculated Columns
Use spreadsheet formulas to add derived columns to your datasets
Calculated columns let you add derived fields to your datasets using spreadsheet formulas. Transform raw data into business-ready metrics—categorize values, calculate ratios, extract date parts, perform lookups, and more—all using familiar Excel/Google Sheets syntax.
Why Use Calculated Columns?
| Use Case | Example |
|---|---|
| Categorization | Convert numeric ranges to buckets (Small/Medium/Large) |
| Lookups | Map product IDs to product names from a reference table |
| Date extraction | Get month, quarter, or year from a date field |
| Calculations | Compute margins, ratios, differences |
| Text manipulation | Extract portions of strings, combine fields |
| Conditional logic | Apply different calculations based on conditions |
Accessing Calculated Columns
- Open your dataset
- Click the Calculated Columns tab
- View the template spreadsheet
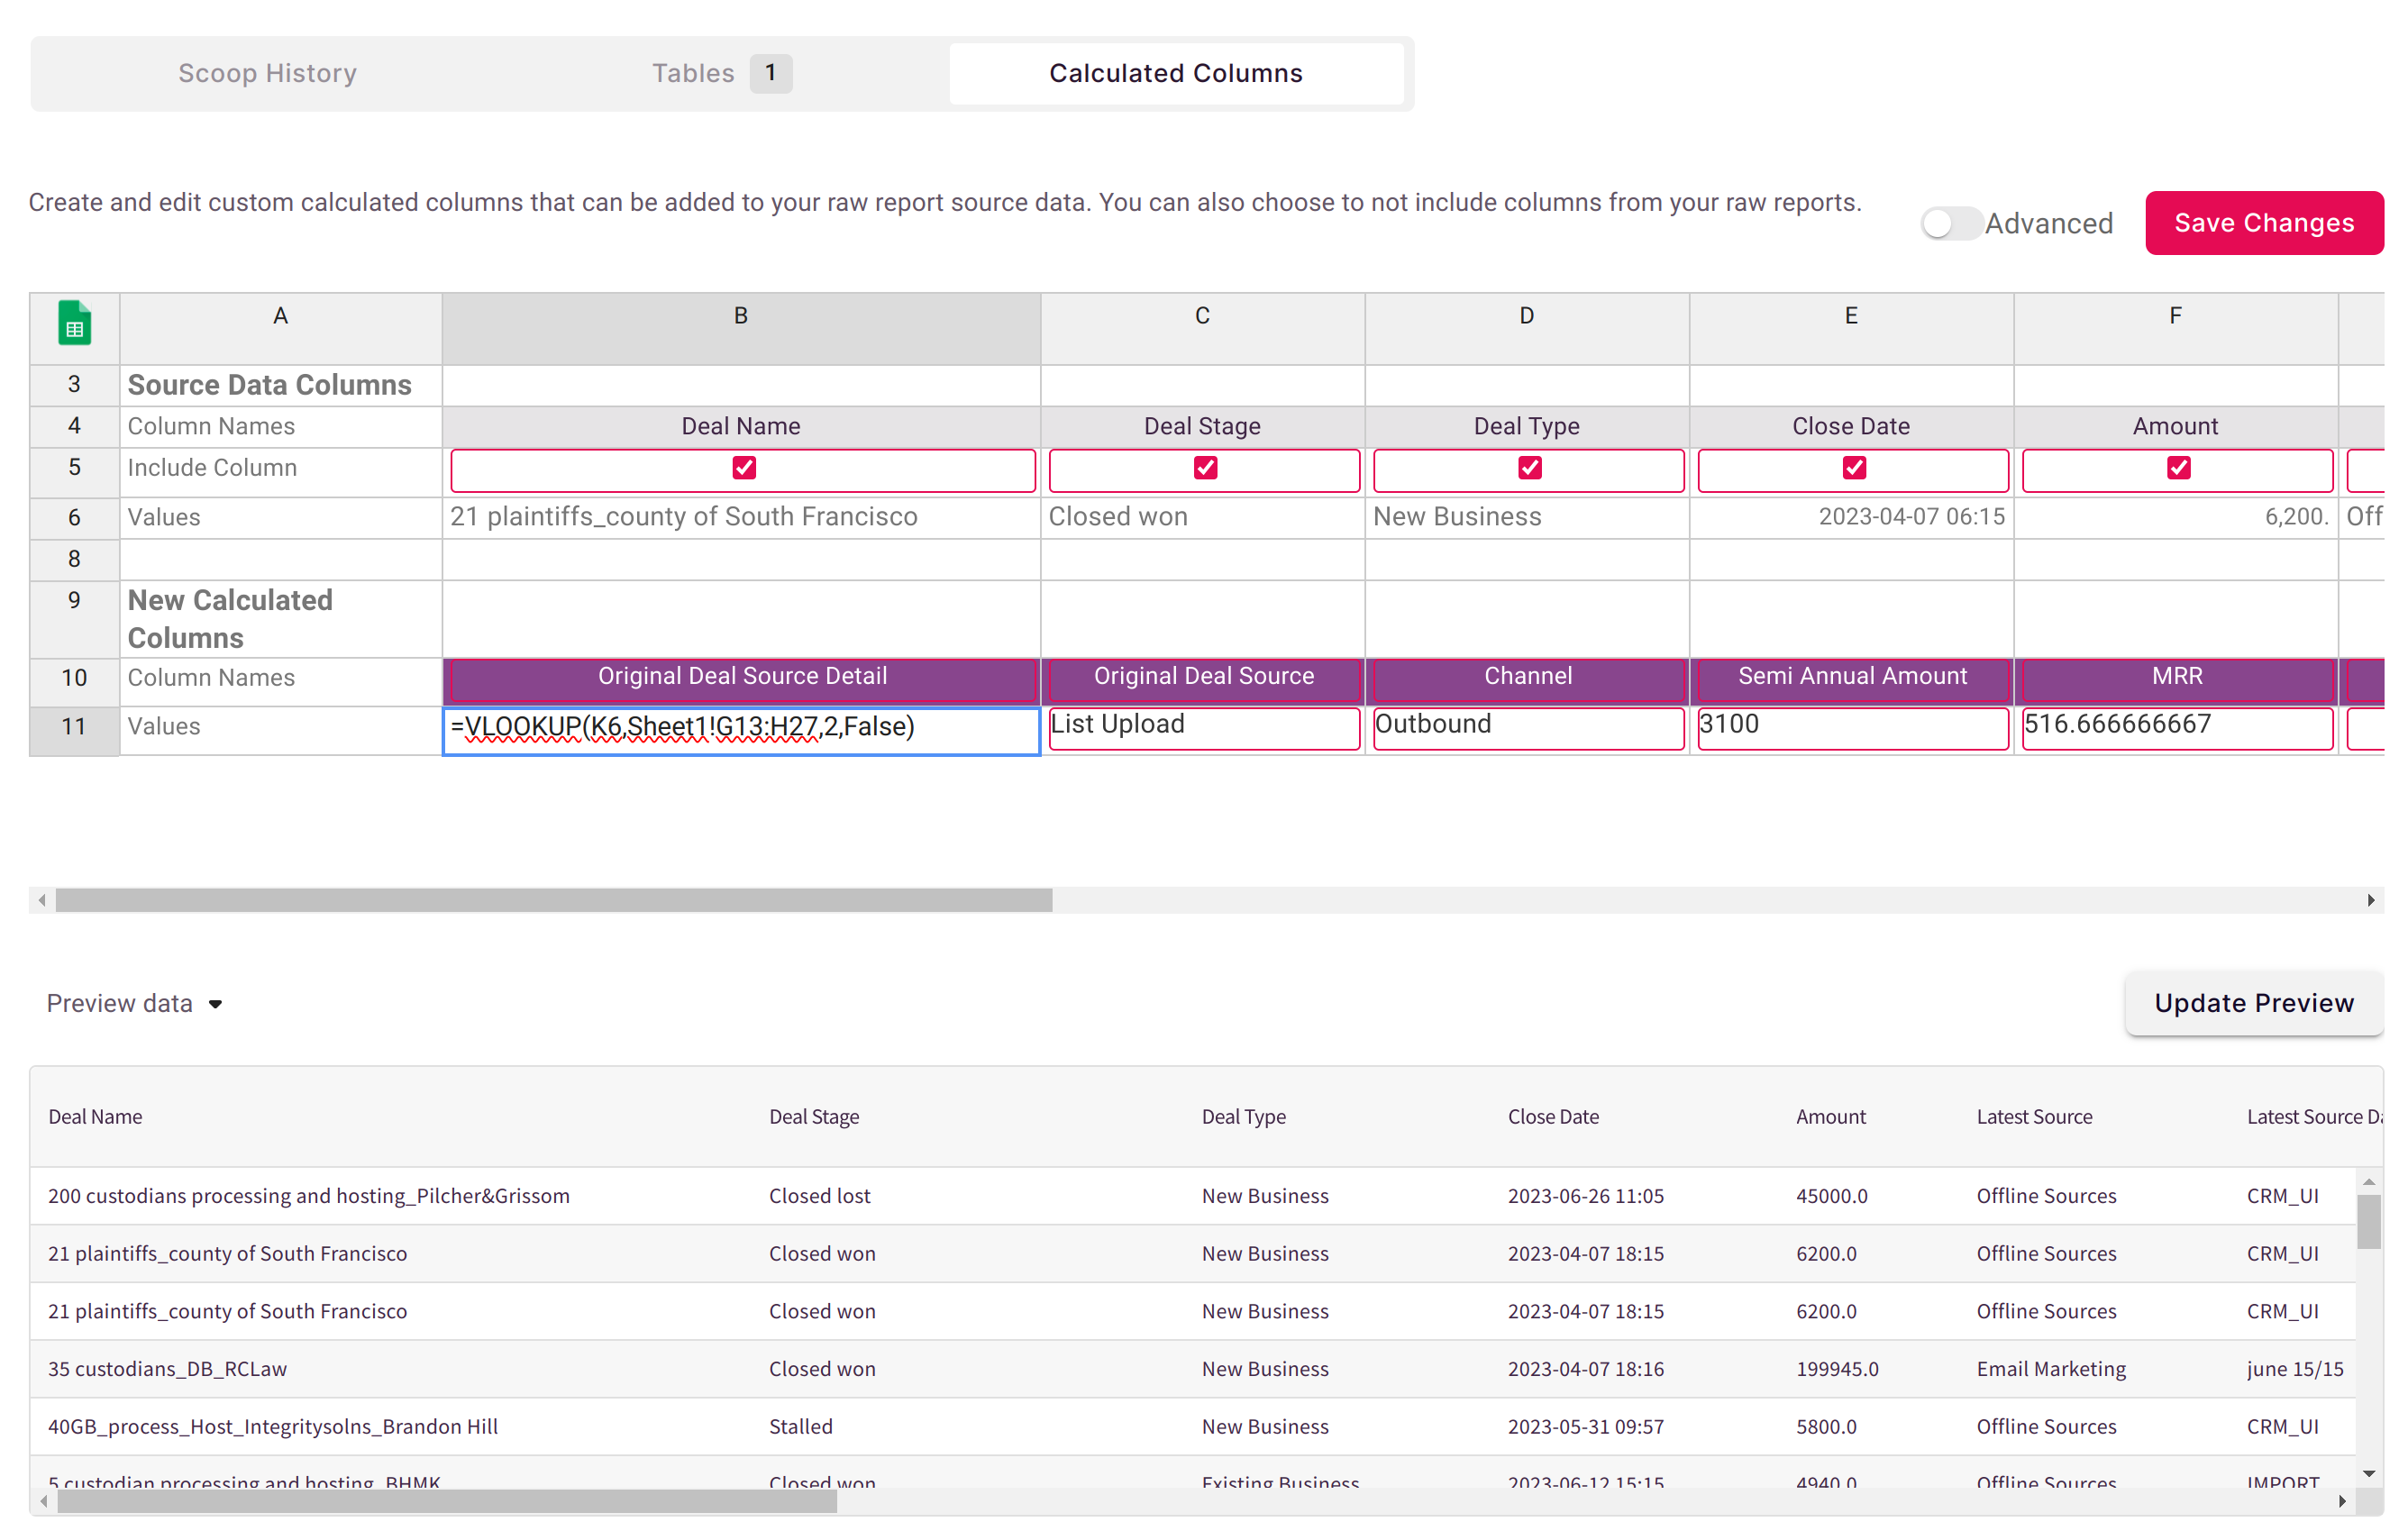
Understanding the Template
The template has two main sections:
┌─────────────────────────────────────────────────────────────┐
│ SOURCE DATA COLUMNS                                         │
├─────────────────────────────────────────────────────────────┤
│ Column Names:    | Col A    | Col B    | Col C    | ...     │
│ Include Column:  | TRUE     | TRUE     | FALSE    | ...     │
│ Values:          | [sample] | [sample] | [sample] | ...     │
├─────────────────────────────────────────────────────────────┤
│ NEW CALCULATED COLUMNS                                       │
├─────────────────────────────────────────────────────────────┤
│ Column Names:    | NewCol1  | NewCol2  |          |         │
│ Values:          | =formula | =formula |          |         │
└─────────────────────────────────────────────────────────────┘
Source Data Columns Section
| Row | Purpose | Editable? |
|---|---|---|
| Column Names | Lists all columns from your source data | No - reference only |
| Include Column | TRUE/FALSE to include column in dataset | Yes |
| Values | Sample data from first row | Yes - for testing |
New Calculated Columns Section
| Row | Purpose | Editable? |
|---|---|---|
| Column Names | Names for your new calculated columns | Yes |
| Values | Formulas that calculate the column values | Yes |
How Processing Works
When you save and reprocess your dataset:
- Scoop loads each row from your source data into the Values row
- Formulas in New Calculated Columns calculate against that row
- Results are added as new columns in your dataset
- This repeats for every row in your source data
Source Row 1 → Template → Calculate → Row 1 + New Columns
Source Row 2 → Template → Calculate → Row 2 + New Columns
...
Source Row N → Template → Calculate → Row N + New Columns
For large datasets (over 1,000 rows), Scoop uses multi-threading to process rows in parallel for faster performance.
Creating Calculated Columns
Step 1: Name Your Column
In the New Calculated Columns section, enter a column name:
Column Names: | Deal Size Bucket |Naming tips:
- Use descriptive names
- Avoid special characters
- Keep names concise but clear
Step 2: Enter Your Formula
Enter a formula in the Values row below your column name:
Values: | =IF(B3>100000,"Large",IF(B3>25000,"Medium","Small")) |The formula references cells in the Values row of Source Data Columns.
Step 3: Test with Sample Data
The Values row in Source Data Columns shows sample data. You can:
- Change these values to test edge cases
- Verify your formula handles different scenarios
- Check for errors before processing
Step 4: Preview Results
Click Preview Data to run your formulas against actual data:
Review the preview to confirm calculations are correct.
Step 5: Save and Reprocess
- Click Save Changes
- Navigate to the dataset overview
- Click Reprocess to apply calculations to all data
See Reprocessing Data for details.
Common Formula Patterns
Categorization with IF
=IF(Amount>100000,"Large",IF(Amount>25000,"Medium","Small"))Date Extraction
=YEAR(CloseDate)
=MONTH(CloseDate)
=QUARTER(CloseDate)
=TEXT(CloseDate,"MMMM")
Text Manipulation
=LEFT(AccountID,3)
=CONCATENATE(FirstName," ",LastName)
=UPPER(Region)
Lookups
=VLOOKUP(ProductID,ProductTable!A:B,2,FALSE)
=INDEX(Categories,MATCH(Type,TypeList,0))
Calculations
=Revenue-Cost
=Revenue/Units
=(CloseDate-CreateDate)
=ROUND(Amount*0.08,2)
Conditional Calculations
=IF(Status="Won",Amount,0)
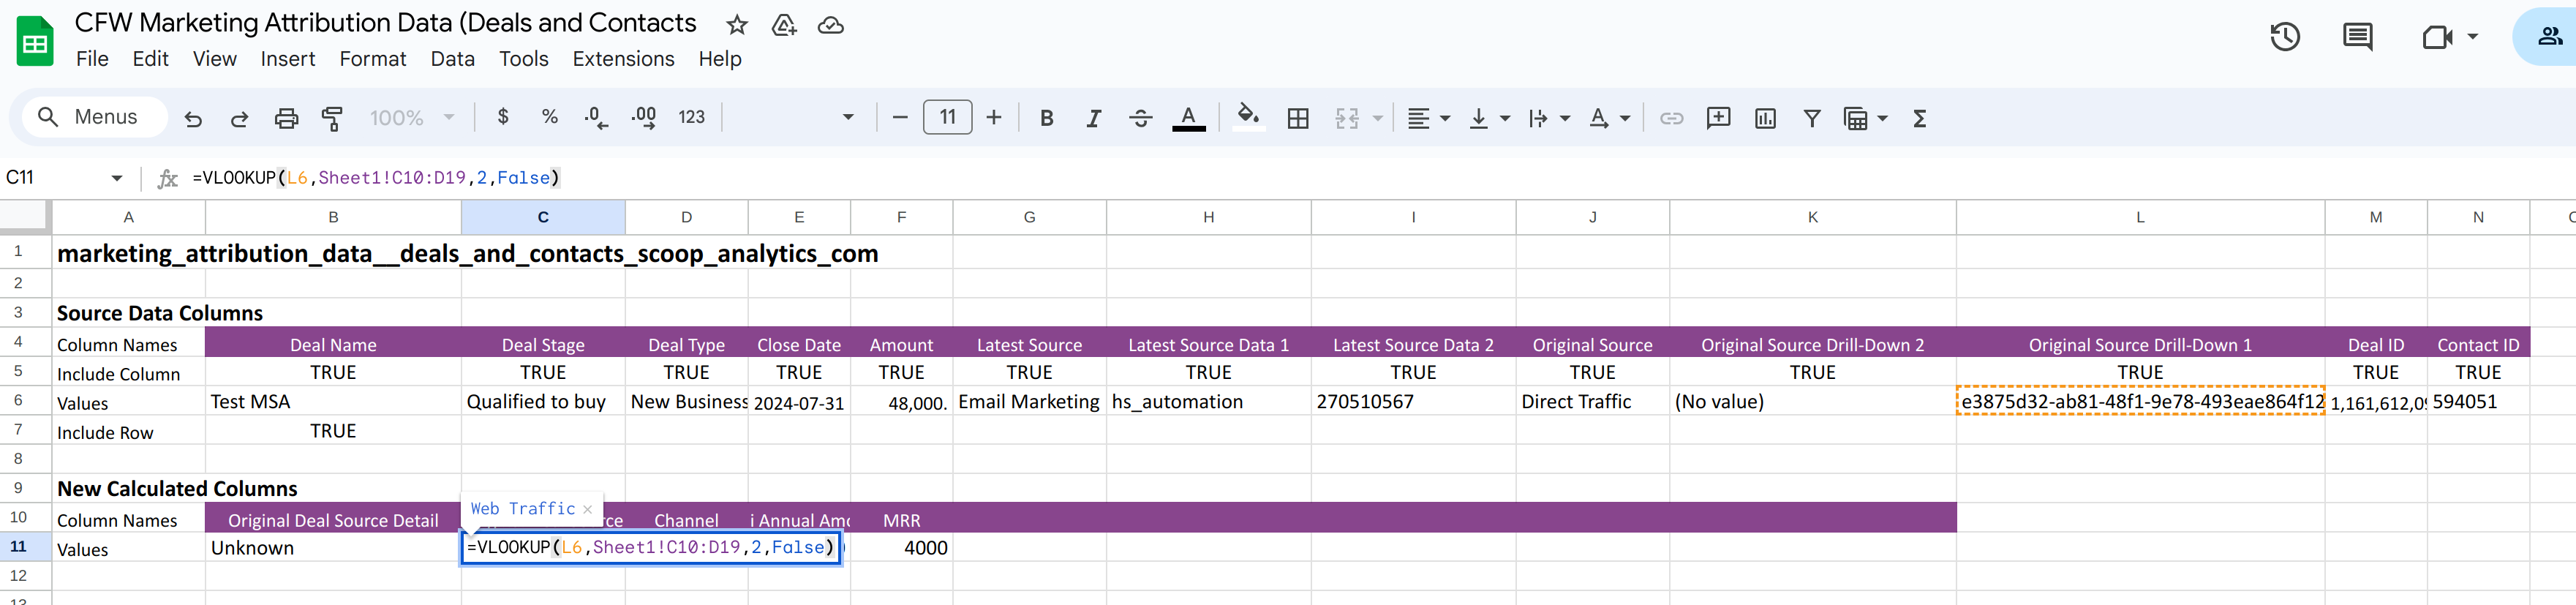
=IF(AND(Region="West",Amount>50000),"Priority","Standard")Using Reference Tables (Lookups)
The template is backed by a full Google Sheets workbook. You can:
- Click the spreadsheet icon in the upper left
- Google Sheets opens with your template
- Add additional sheets for lookup tables
- Use VLOOKUP, INDEX/MATCH to reference those tables
- Refresh Scoop to see your changes
Example: Product Category Lookup
Step 1: Add a "Product Categories" sheet:
| Product ID | Category |
|---|---|
| P001 | Electronics |
| P002 | Apparel |
| P003 | Home |
Step 2: In your calculated column formula:
=VLOOKUP(A3,'Product Categories'!A:B,2,FALSE)This maps raw product IDs to friendly category names.
Excluding Columns
To remove a column from your dataset:
- Find the column in Source Data Columns
- Change the Include Column value to FALSE
- That column won't appear in your processed dataset
Use this to:
- Remove sensitive data (like SSN, internal IDs)
- Exclude columns you don't need
- Reduce dataset size
AI-Generated Formulas
Scoop can suggest formulas using AI:
- Describe what you want in natural language
- Scoop generates an Excel formula
- Review and insert into your template
Example prompt: "Calculate days between created date and close date"
Generated formula: =DATEDIFF(CreateDate,CloseDate,"D")
Best Practices
Formula Design
- Keep formulas simple when possible
- Break complex logic into multiple columns
- Test with edge cases (nulls, zeros, empty strings)
- Use named ranges for readability
Performance
- Limit very complex formulas on large datasets
- Avoid volatile functions (NOW, RAND) unless needed
- Consider pre-calculating in source systems when possible
Maintenance
- Document complex formulas with comments
- Test thoroughly before reprocessing historical data
- Version control lookup tables
Troubleshooting
Formula Returns Error
- Check cell references are correct
- Verify source columns exist
- Test with sample values
- Look for null/empty values causing issues
Missing Column in Output
- Ensure column name row has a value
- Check Include Column isn't FALSE
- Verify no blank columns before your new column
Slow Processing
- Simplify complex formulas
- Reduce lookup table sizes
- Consider pre-processing in source system
Lookup Not Finding Values
- Verify lookup table is in the same workbook
- Check for exact match issues (spaces, case)
- Ensure lookup column is sorted if using approximate match
Related Topics
- Reprocessing Data - Apply calculations to existing data
- Live Worksheets - Full spreadsheet capabilities
- Filtering Data - Filter datasets during load
- Blending Datasets - Combine multiple datasets
Updated 8 months ago