Group/Population Comparisons
Understanding what makes groups of data unique or different is a common—but often challenging—task for business analysts. Scoop Analytics makes group and population comparisons easy, powerful, and approachable for anyone with spreadsheet skills. With Scoop's Data Science Studio (or chat), you can uncover exactly what sets one segment apart from another, whether you're comparing customer cohorts, product categories, time frames, or any other criteria.
What Are Group/Population Comparisons?
Group or population comparison is a technique that identifies what is distinctive about one group compared to another. For example:
- What distinguishes customers who churned this month from those who didn't?
- What sets "high-value" accounts apart from the rest?
- How do support tickets classified as "Urgent" differ from "Routine" ones?
Instead of sifting through dozens of charts or hand-built pivot tables, Scoop lets you configure these comparisons in a few clicks—and harnesses machine learning under the hood to find the key variables and patterns that drive the differences.
The Scoop Approach: Automated, Explainable Insights
Traditional BI tools might show you averages or counts, but Scoop goes further. It uses advanced ML algorithms (like classification rules and trees) to automatically:
- Segment data into meaningful groups based on your filters or criteria
- Detect which attributes—across all columns—are most responsible for differences between groups
- Summarize those differences into clear, business-friendly language and rules
Tip: Scoop does more than show which averages differ; it identifies multi-dimensional combinations of factors, so you discover patterns you might otherwise miss.
How to Use Group Comparisons in Scoop
1. Choose Your Dataset
First, open your dataset in Scoop. This could be sales opportunities, leads, service tickets, or any other table with distinct records.
2. Define Your Groups
Decide how you want to split the data into groups:
- By filter: For example, "region = Europe" vs. all others
- By value: Such as "Status = Closed Won" vs. "Status = Closed Lost"
- By time period: Like records from Q2 vs. those from Q1
Scoop's group comparison tools let you specify one group using simple filter criteria (with optional comparison against another filter). If you only define one group, Scoop will compare it to everything else by default.
Tip: You can compare as broadly ("enterprise vs. SMB") or as narrowly ("churned in the last month vs. retained") as you need.
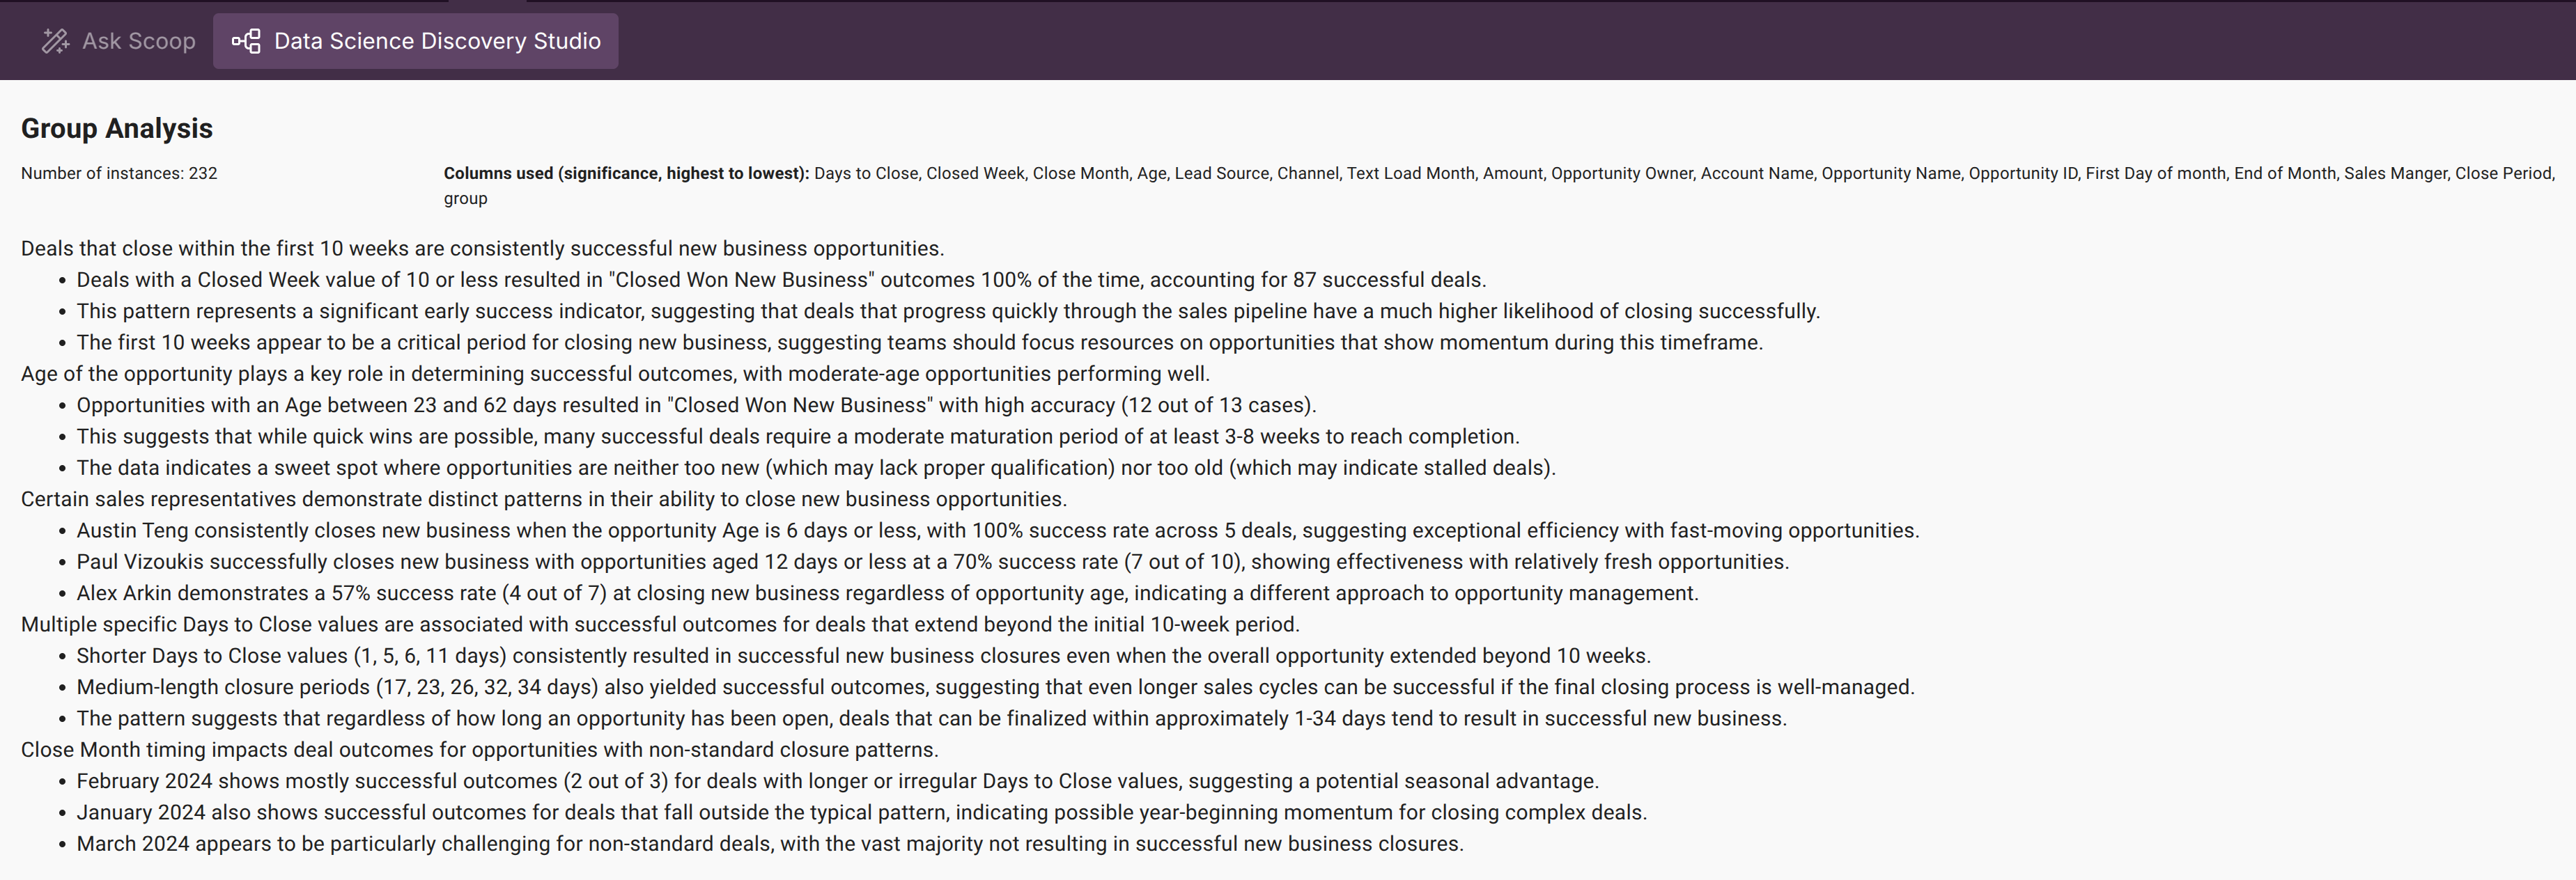
3. Launch Data Science Studio Group Comparison
Within Scoop's Data Science Studio, choose the Group Comparison or Population Comparison analysis. Just set the filters or attributes for each group/cohort.
Scoop will automatically:
- Profile all variables (numeric, categorical, derived)
- Run powerful ML models (classification and rules extraction)
- Surface the key differences, even when they're complex or multidimensional
4. Review the Results
Scoop presents group differences in business-friendly summaries, showing:
- The most predictive attributes (e.g., "Accounts in Group A tend to be in Industry X and have higher engagement scores")
- Interpretable rules and patterns (e.g., "If tenure > 2 years and plan = Premium, 85% are in the target group")
- Key statistics, supporting metrics, and natural language explanations
5. Take Action
Use insights to:
- Target marketing, retention, or upsell campaigns to segments with distinct traits
- Adjust onboarding or support processes for specific populations
- Guide deeper analysis—Scoop provides the metrics and rules, so you can build dashboards, filters, or further drill-downs
Tip: All group comparison results are fully interactive—click to filter, visualize, or export. Summaries are saved right alongside your dataset or presentation canvas.
Benefits of Scoop's Group Comparison
- No coding or statistical background required: All logic is point-and-click, with ML models running automatically
- Multi-dimensional insights: Reveals not just single variables, but combinations across dozens of columns
- Explainable AI: Every pattern comes with a plain-English description, plus rules you can use for further action
- End-to-end workflow: Group findings can be dropped onto presentation slides, shared with colleagues, or used to trigger automated workflows
Example Use Cases
- Sales: Compare closed/won vs. closed/lost deals to find what drives success
- Customer Success: Spot what makes long-term customers different from churners
- Product: Analyze user cohorts to see which features appeal to specific segments
- Operations: Find out what characterizes "delayed" vs. "on-time" tickets
Best Practices
- Start simple: Compare one group to all others to quickly spot outliers
- Layer on filters: Add additional group criteria to dig deeper (e.g., "Enterprise clients in Q2 vs. SMB clients in Q2")
- Leverage the AI summaries: Let Scoop's natural language output guide your next steps, but always verify with charts or drill-downs
Conclusion
Group/population comparisons in Scoop give you the power of a data science team—without the complexity. In just a few steps, you can:
- Ask, “What makes this group different?”
- Get clear, actionable answers
- Add those insights directly to dashboards, reports, or presentations
Try it with your own data, and start understanding your populations—and the drivers behind their behavior—like never before!
Updated 8 months ago