Re-usable Visual Themes
Maintain consistent styling across all your visualizations and presentations
Themes are a powerful visual feature in Scoop that enable consistent styling across all your visualizations and presentations. Instead of manually formatting each chart, table, or canvas, define a theme once and apply it everywhere.
What Themes Control
| Category | Settings Included |
|---|---|
| Color Palette | Chart colors, series colors, categorical colors |
| Typography | Font family, sizes, weights for titles and labels |
| Chart Styling | Gridlines, axes, legends, data labels |
| Table Styling | Headers, rows, alternating colors, borders |
| Canvas Elements | Backgrounds, object borders, shadows |
Why Use Themes?
| Benefit | Description |
|---|---|
| Brand Consistency | All visualizations match your corporate identity |
| Time Savings | Apply formatting instantly instead of item-by-item |
| Professional Output | Cohesive look across reports and presentations |
| Easy Updates | Change theme once, all visuals update |
| Collaboration | Share themes across team members |
Accessing Themes
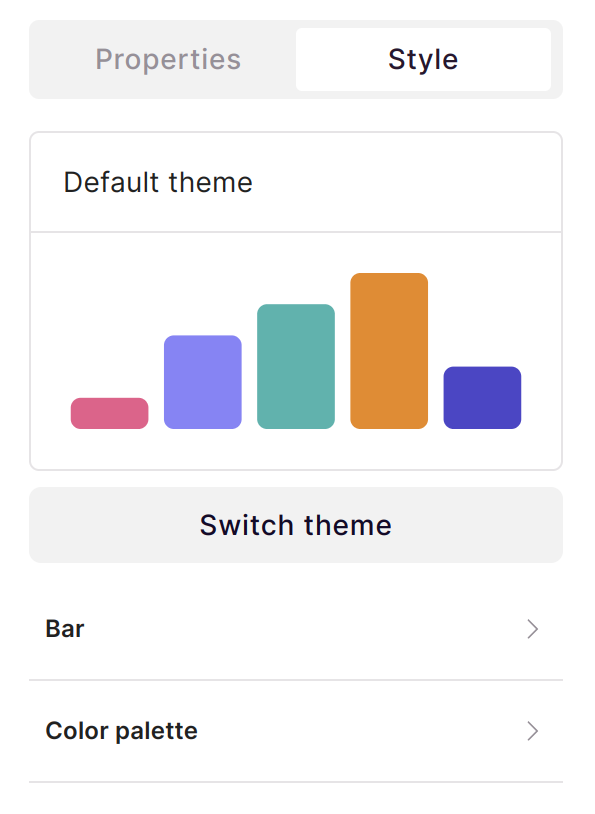
You can access themes by clicking on the Style tab in the right panel of Explorer, then clicking Switch theme:
Previewing and Applying Themes
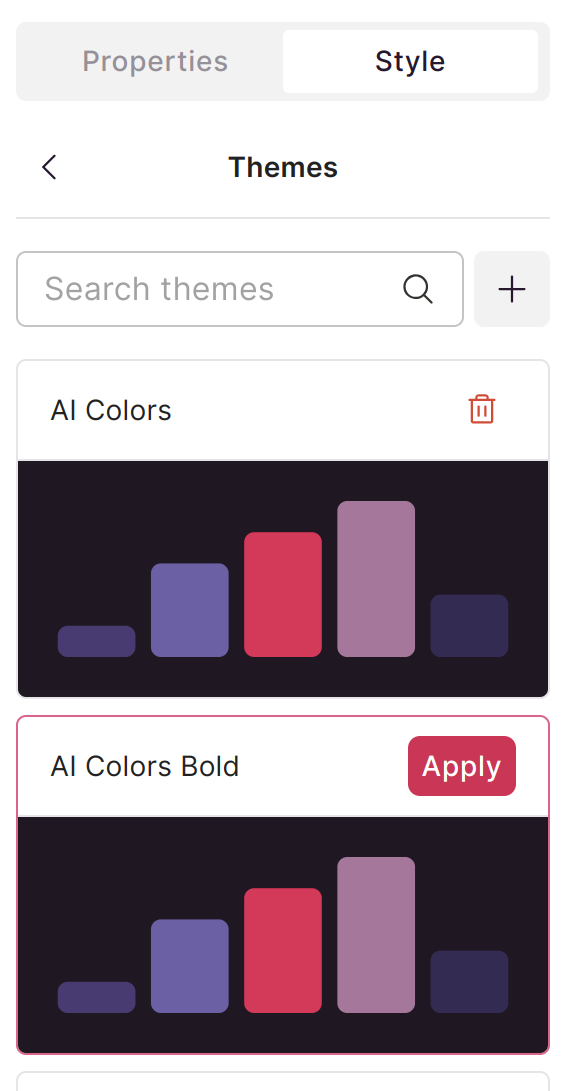
Click on any theme to preview how it will look on your current visualization:
| Action | Result |
|---|---|
| Click theme | Preview on current visualization |
| Apply | Make theme active for this visualization |
| Cancel | Return to previous theme |
Built-in Themes
Scoop includes several pre-built themes:
| Theme | Style | Best For |
|---|---|---|
| Default | Clean, professional | General business use |
| Dark | Dark background, light text | Presentations, screens |
| Light | Minimal, subtle colors | Documents, reports |
| Corporate | Formal, muted palette | Executive presentations |
| Vibrant | Bold, saturated colors | Marketing, highlights |
Importing Themes from PowerPoint
When importing a slide presentation from PowerPoint, Scoop automatically:
- Extracts color schemes from the presentation
- Creates themes based on PowerPoint's theme colors
- Generates AI recommendations based on colors actually used in slides
This allows you to maintain consistency between your PowerPoint decks and Scoop visualizations.
See AI Generated Color Themes for more detail on AI-powered theme creation.
Creating a New Theme from Scratch
Click the plus icon next to "Search themes" to create a new theme:
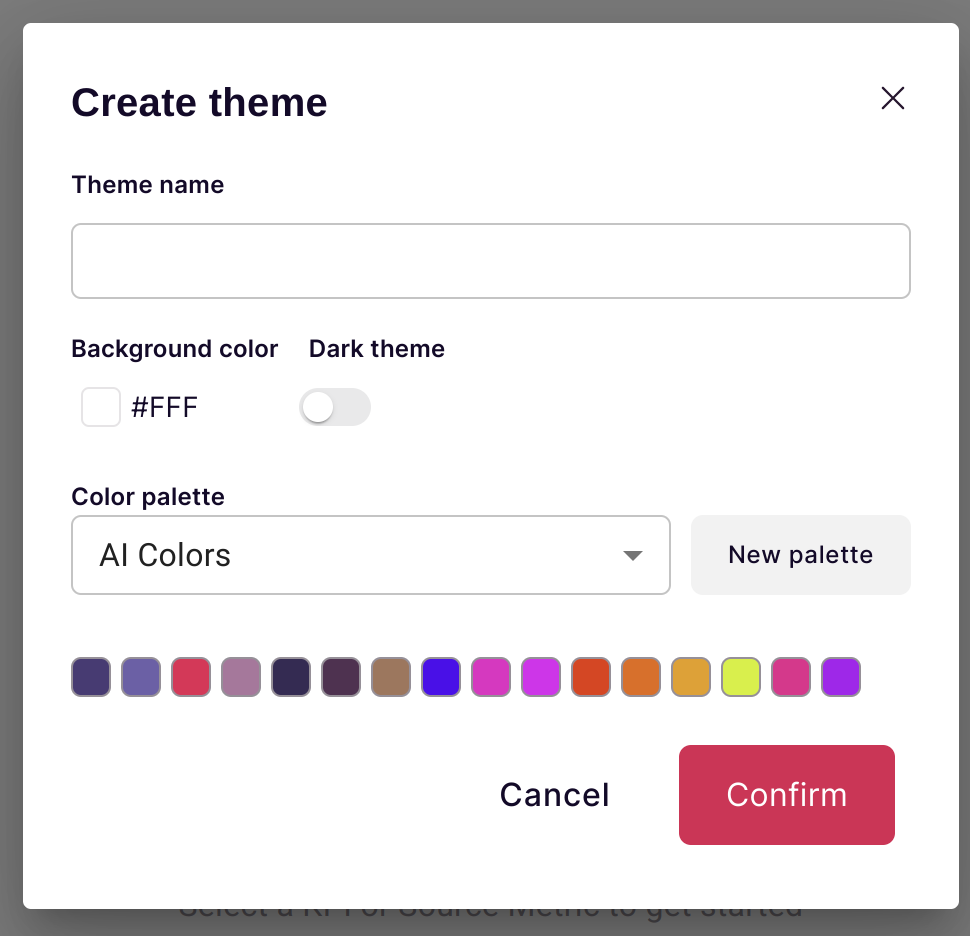
Step 1: Name Your Theme
Give your theme a descriptive name that identifies its purpose (e.g., "Q4 Sales Report", "Marketing Dashboard", "Executive Summary").
Step 2: Define Color Palette
Specify base colors and let Scoop's AI generate harmonious additional colors:
| Setting | Description |
|---|---|
| Base Colors | Your primary brand or chosen colors |
| Palette Size | How many total colors to generate |
| AI Recommendations | Harmonious colors based on your base |
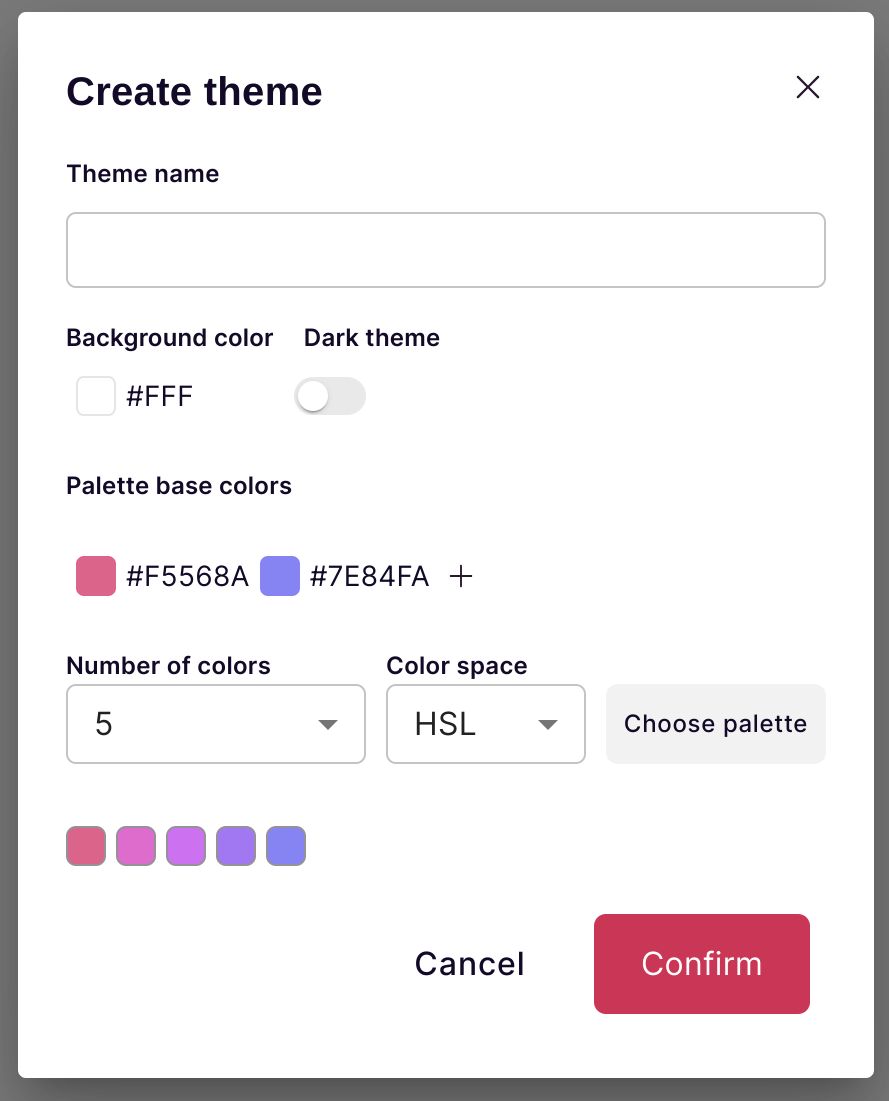
Step 3: Expand the Palette
Add more base colors or increase the number of recommended colors:
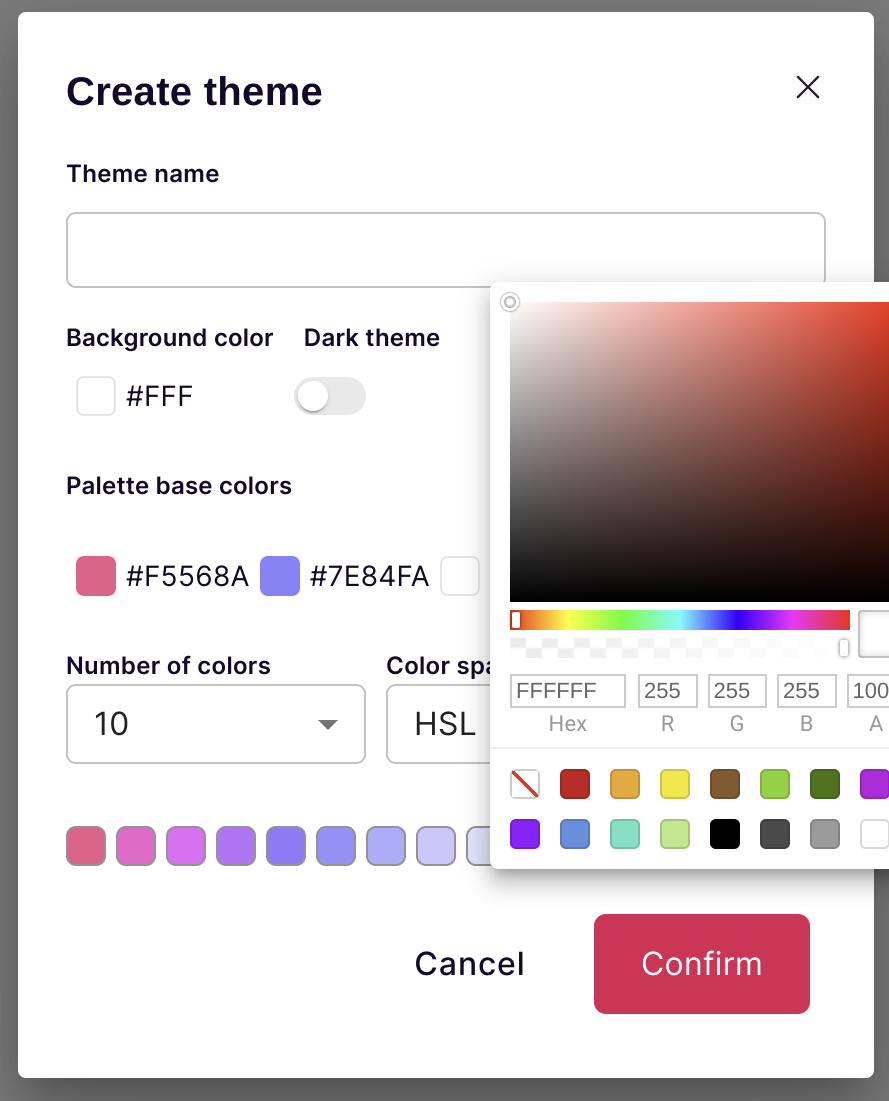
Step 4: Confirm and Save
Once satisfied with your palette, confirm to create the theme. Other formatting settings start with defaults that you can modify later.
Modifying a Theme
After selecting a theme, modify any aspect in the Style tab:
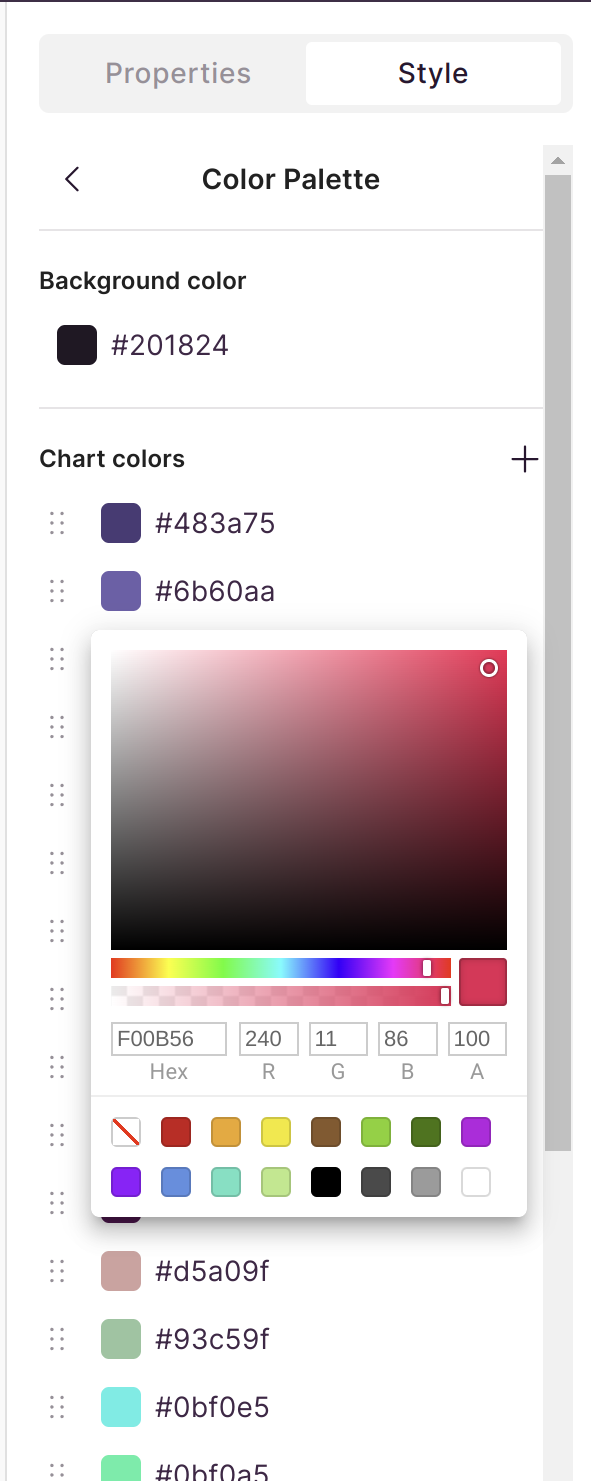
Modifiable Settings
Color Palette
| Action | How To |
|---|---|
| Change a color | Click color swatch, pick new color |
| Add colors | Click + to add to palette |
| Remove colors | Click X on color to remove |
| Reorder | Drag colors to new position |
Typography
| Setting | Options |
|---|---|
| Font Family | System fonts, Google Fonts |
| Title Size | Small, Medium, Large, Custom |
| Label Size | Axis labels, data labels |
| Font Weight | Normal, Bold |
Chart Settings
| Setting | Options |
|---|---|
| Gridlines | Show, hide, color, style |
| Axes | Color, thickness, labels |
| Legend | Position, style, visibility |
| Data Labels | Show, format, position |
Table Settings
| Setting | Options |
|---|---|
| Header Style | Background, text color, bold |
| Row Alternation | Colors for odd/even rows |
| Borders | Color, thickness, style |
| Cell Padding | Compact, normal, spacious |
Overriding Theme Settings
You can override specific theme settings for individual visualizations without changing the theme itself:
| Scenario | Approach |
|---|---|
| One chart needs different colors | Override colors for that chart only |
| Highlight specific data | Use custom color for one series |
| Special formatting | Override while keeping base theme |
Overrides apply only to the current visualization and don't affect the theme or other visuals using it.
Theme Best Practices
Brand Consistency
| Practice | Description |
|---|---|
| Use brand colors | Primary, secondary, accent colors |
| Match typography | Same fonts as corporate materials |
| Document theme | Share theme specifications with team |
Color Selection
| Guideline | Reason |
|---|---|
| Limit palette to 6-8 colors | Too many colors confuse viewers |
| Ensure contrast | Text readable on backgrounds |
| Consider accessibility | Distinguish colors for colorblind viewers |
| Use semantic colors | Green for positive, red for negative |
Applying Themes
| Tip | Description |
|---|---|
| Apply early | Set theme before building complex visuals |
| Test with data | Verify colors work with actual charts |
| Check dark/light | Ensure theme works in different contexts |
Sharing Themes
Within Workspace
Themes created in a workspace are available to all workspace members:
- Create theme once
- All members can apply to their visualizations
- Updates to theme affect all users
Across Workspaces
To use themes across workspaces:
- Document theme specifications (colors, fonts)
- Recreate theme in each workspace
- Or export/import visualizations to transfer
Troubleshooting
Theme Not Applying
- Verify theme is selected (check Style tab)
- Refresh visualization
- Check for overrides blocking theme
Colors Look Different
- Verify color codes match expectations
- Check monitor calibration
- Ensure no overrides applied
Fonts Not Displaying
- Confirm font is available in Scoop
- Check browser font support
- Try web-safe fallback fonts
Theme Changes Not Saving
- Ensure you have edit permissions
- Confirm changes before closing
- Check for unsaved modifications
Related Topics
- AI Generated Color Themes - AI-powered palette creation
- Chart Types - Charts that use themes
- Creating KPIs - KPI styling with themes
- Canvas Objects - Canvas elements and themes
Updated 7 months ago