How Scoop Derives a Dataset from a Report
Scoop is unique and powerful because it does not require complex data work to turn raw application data into something useful. It does this because it works directly with reports coming from source applications. These source reports have a number of very useful properties:
- The are generated by a application user who understands their data and can select the fields and data that is most useful themselves
- Reports already have proper names and labels and generally contain the correct formatting so that Scoop can leverage it
- The internal work required to appropriately bring together the low level data in the application's database into a user ready format is already done
While many reports presented to Scoop are simple tables of data, many are much more complicated and include elements that make the report more readable to humans but are not designed to be read by machines. Scoop's intelligence engine does an extensive analysis of each report, automatically identifying it's type and structure and then extracting the appropriate data and metadata from that report.
Types of Reports Scoop Can Read
Basic Tabular Reports
Most applications can create basic tabular reports. In these reports data is organized into consistent columns, with each column containing a header that contains the name of the data in the column. Scoop will ingest this directly and create a dataset that includes each of the columns and their derived datatypes.
Scoop analyzes every field in a report intelligently determines it's datatype. It scans for integers, decimals, percentages and currencies automatically. It also analyzes for date patterns and can identify a very wide array of date and time formats. When Scoop determines a datatype, it also extracts any formatting that it can detect, which it retains for formatting dates and numbers later on. This way, when a user utilizes that data later in a summary or visualization, it is automatically formatted correctly.
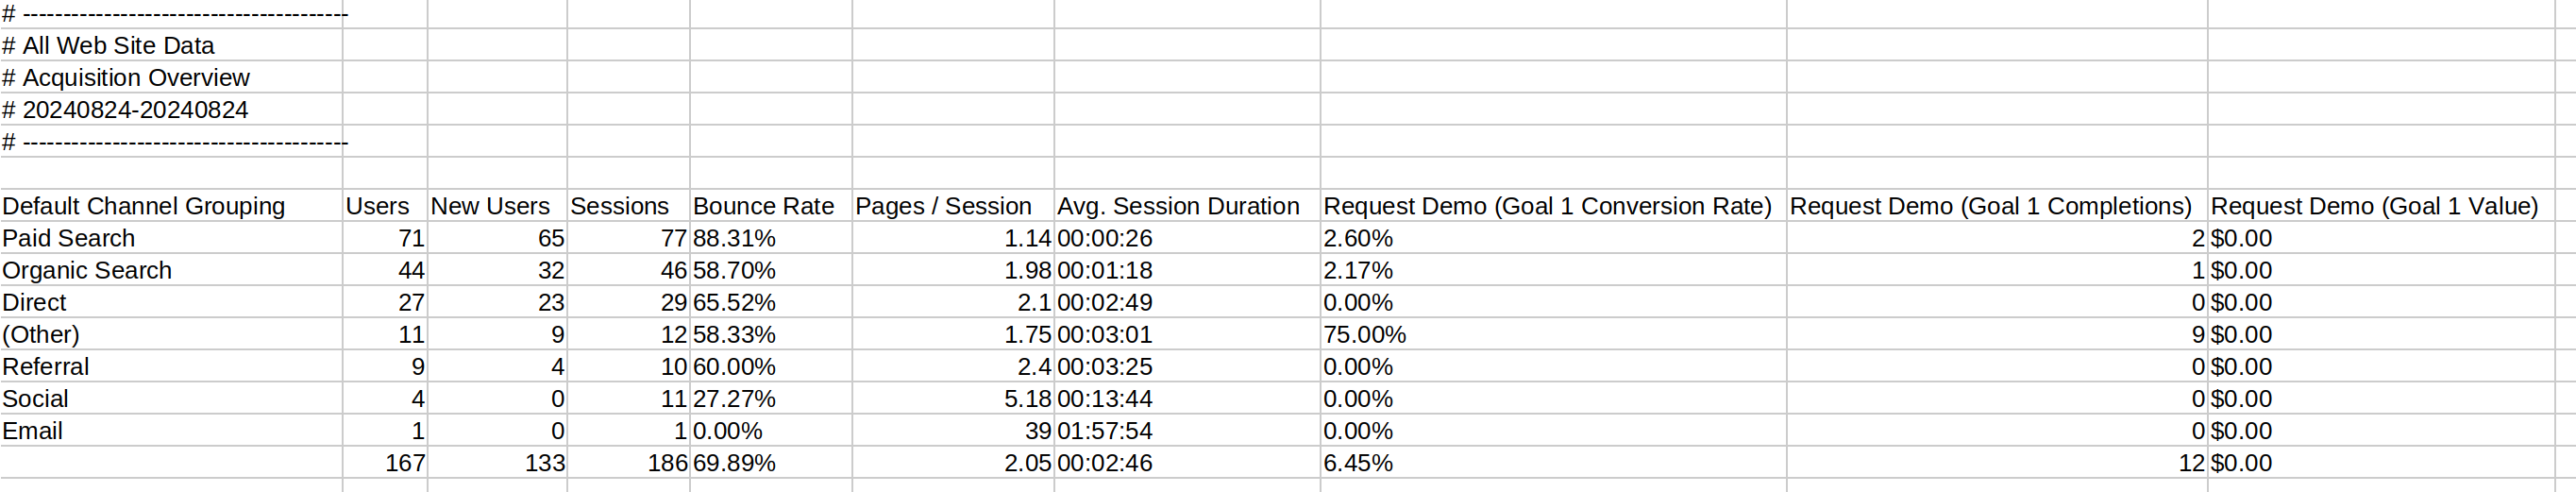
Headers and Footers
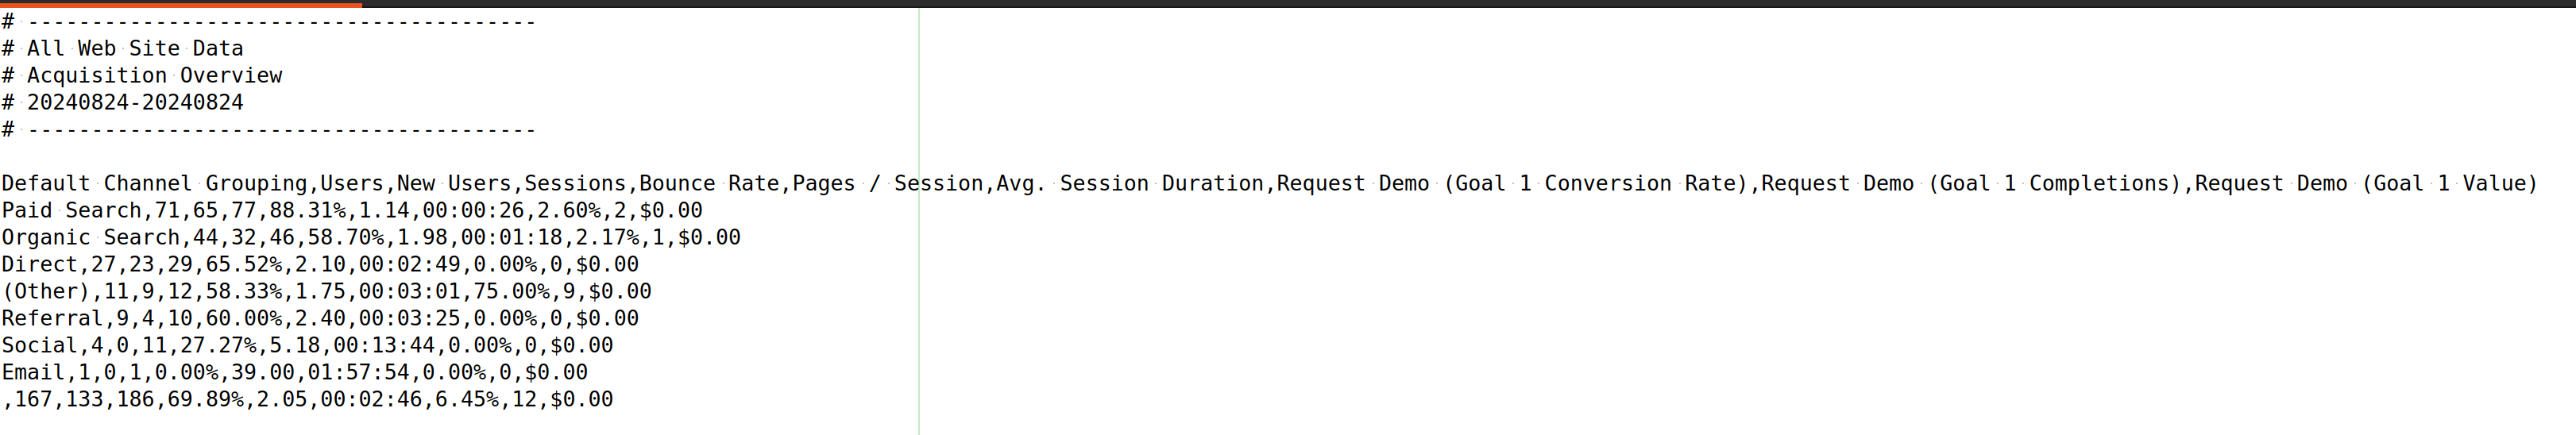
When analyzing a report, Scoop also is able to detect headers and footers that may be present in the report and remove them. Very often human readable reports contain headers and footers with information like when the report was generated or any filter settings that may have been applied. Scoop intelligently analyzes the report to lock in on just the core data present in the report itself. In the example above, Scoop automatically removes the first 6 rows by determining that they contain only header information. It also recognizes that the last row is a total row.
Banded Reports
A more complicated type of report is a banded report. Banded reports include summary rows that contain subtotals and columns that are grouped (or banded). Below is an example of a report that groups deals by their close quarter and their win probability and contains subtotals.
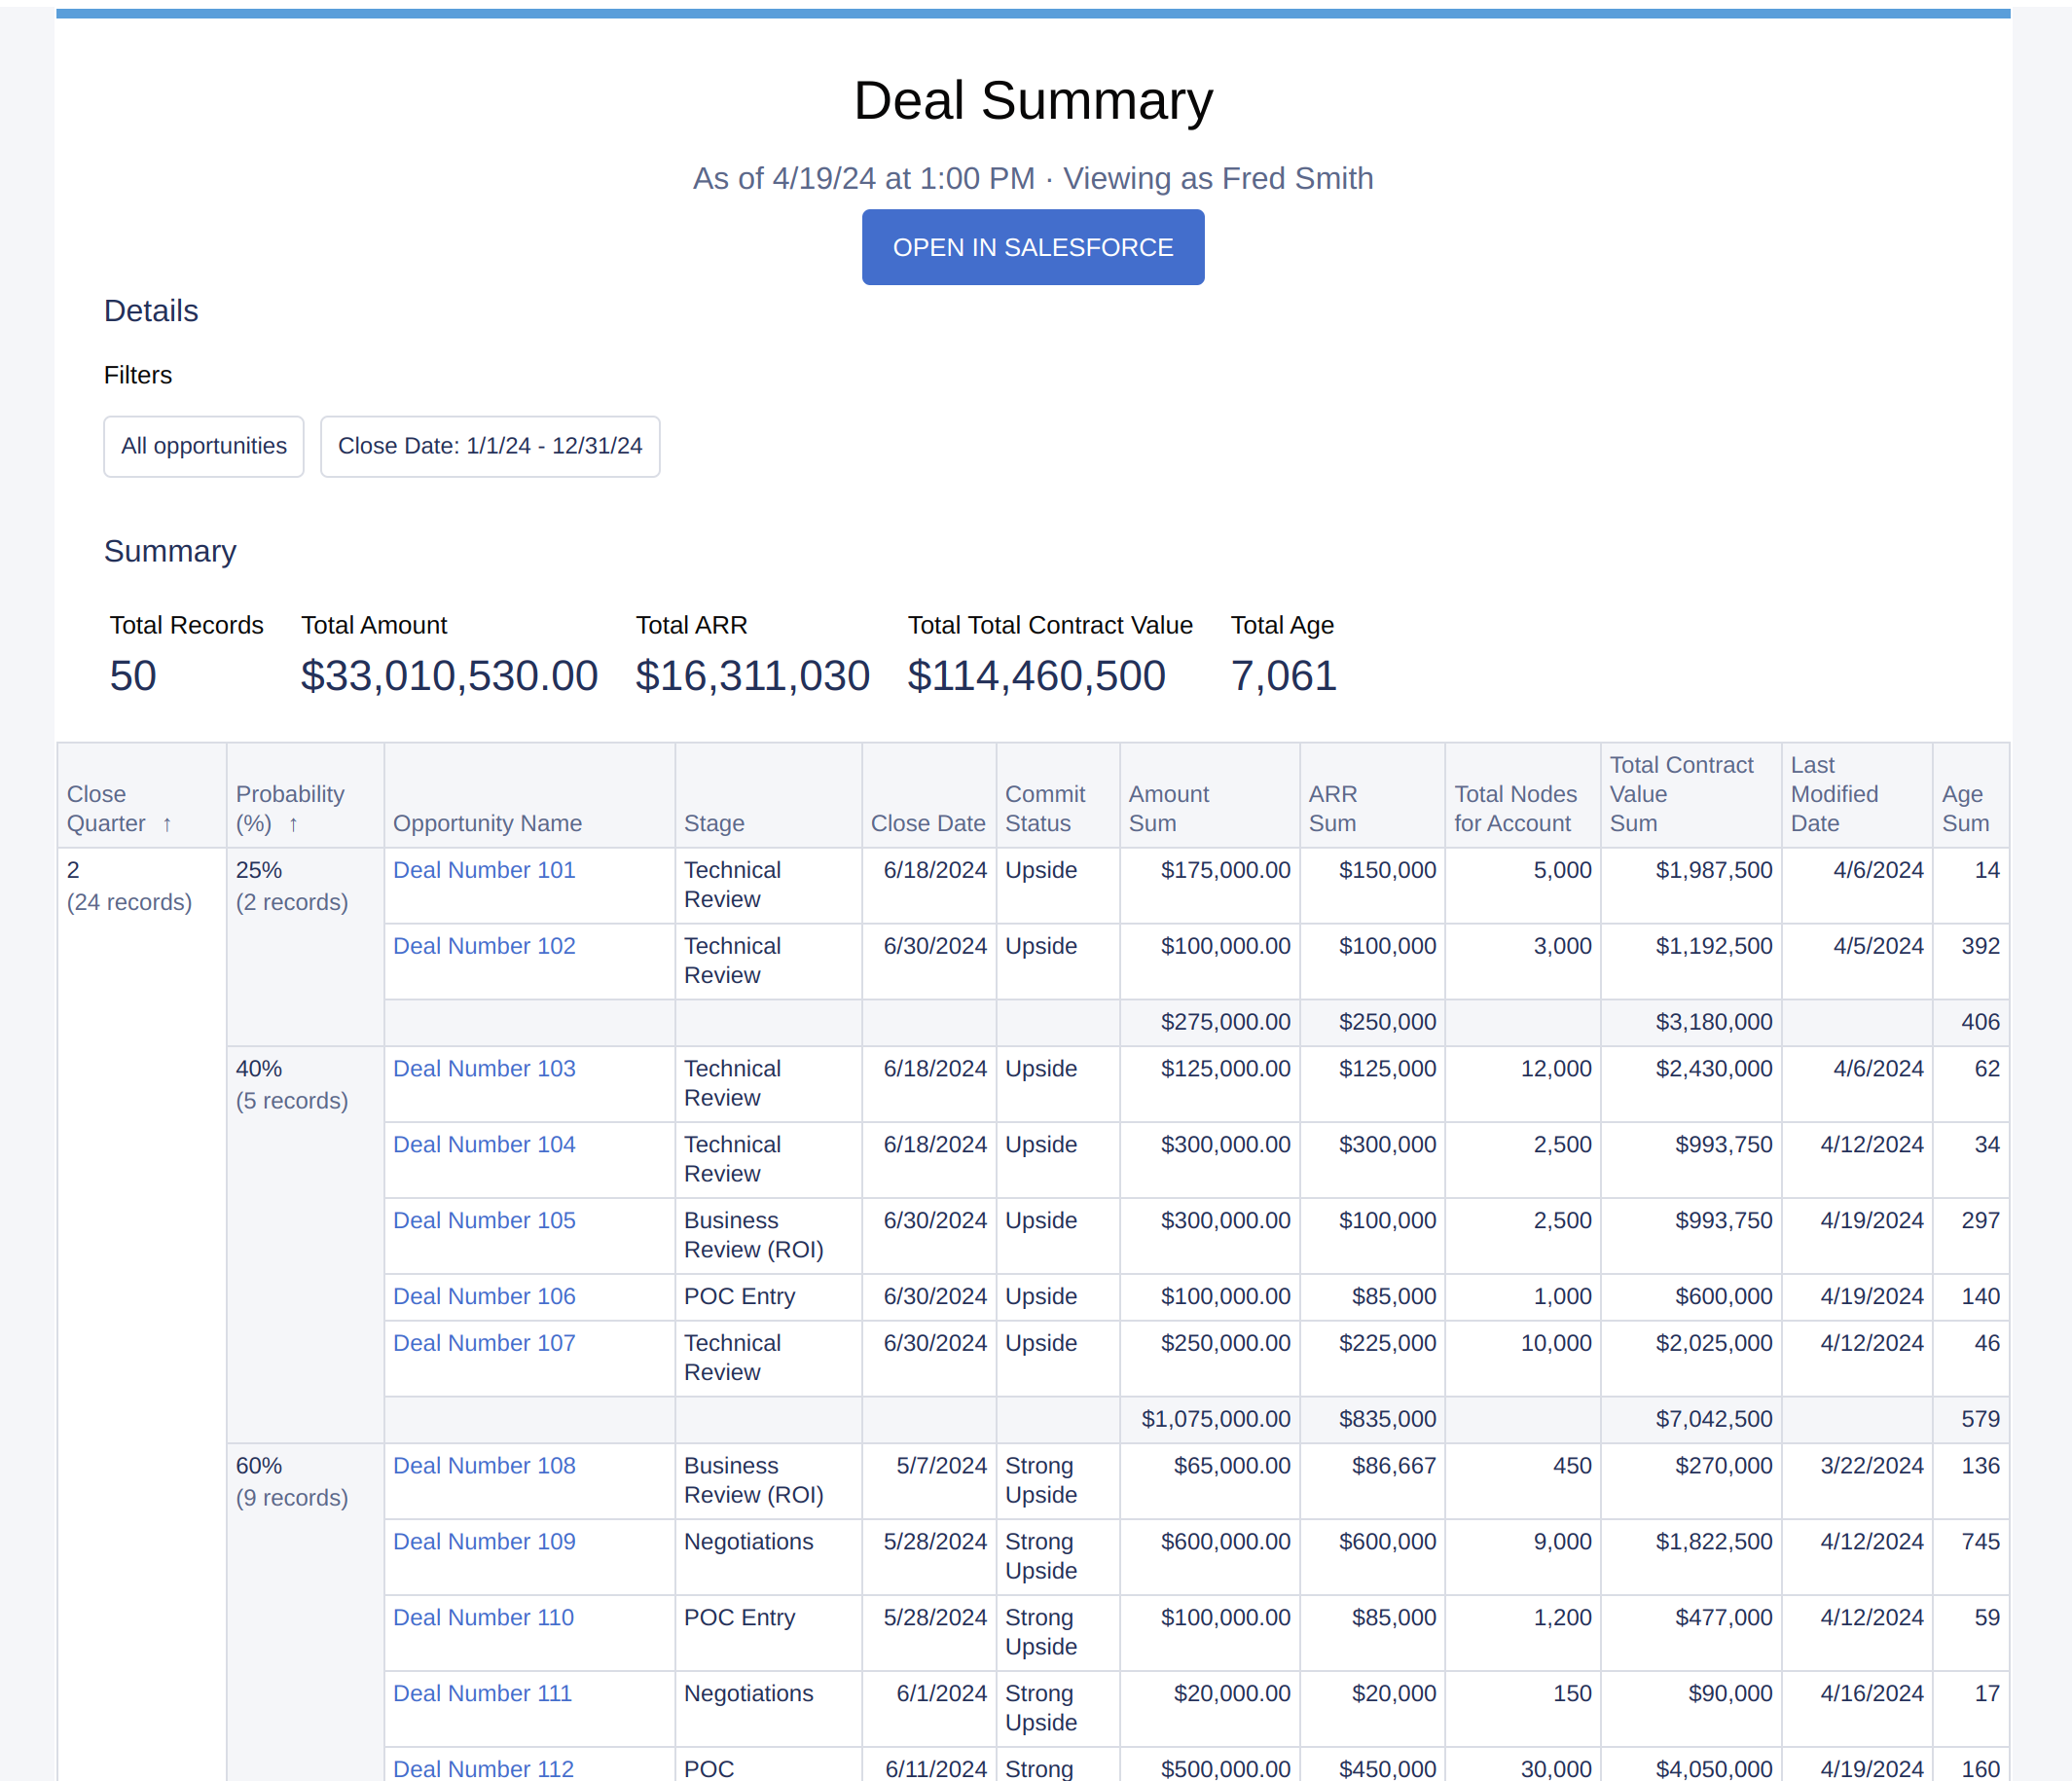
Scoop can identify which rows are subtotals and actually check to see what type of aggregation is being used on those columns in that report. This way, later when you are visualizing the data in Explorer it will aggregate the data as expected for that column (Sum, Count, Min, Max, Average).
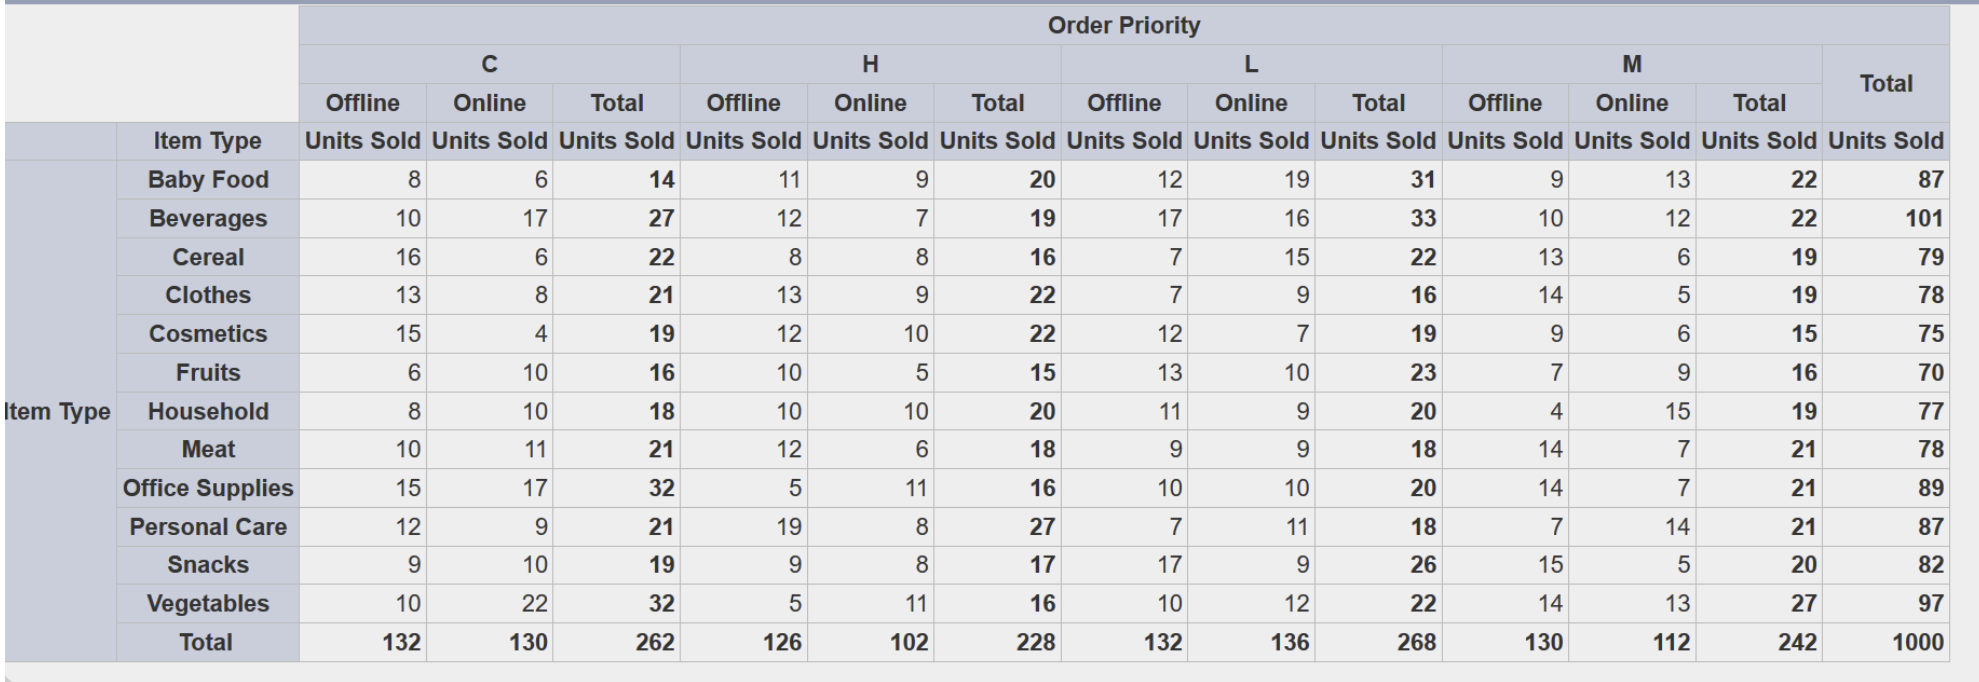
Pivot Tables
Pivot tables look like tabular tables, but are a bit more complicated. Their columns are actually grouped by another set of column values, in effect pivoting one column of data across the top. Scoop can recognize a variety of pivot formats and automatically de-pivot the data into a raw dataset.
Financial Statements
Scoop will also look to identify whether a particular report contains either income statement/cash flow statement type data or whether it might contain balance sheet data. It understands the use of dates along the top and many types of column groupings and can appropriately extract financial information from the report.
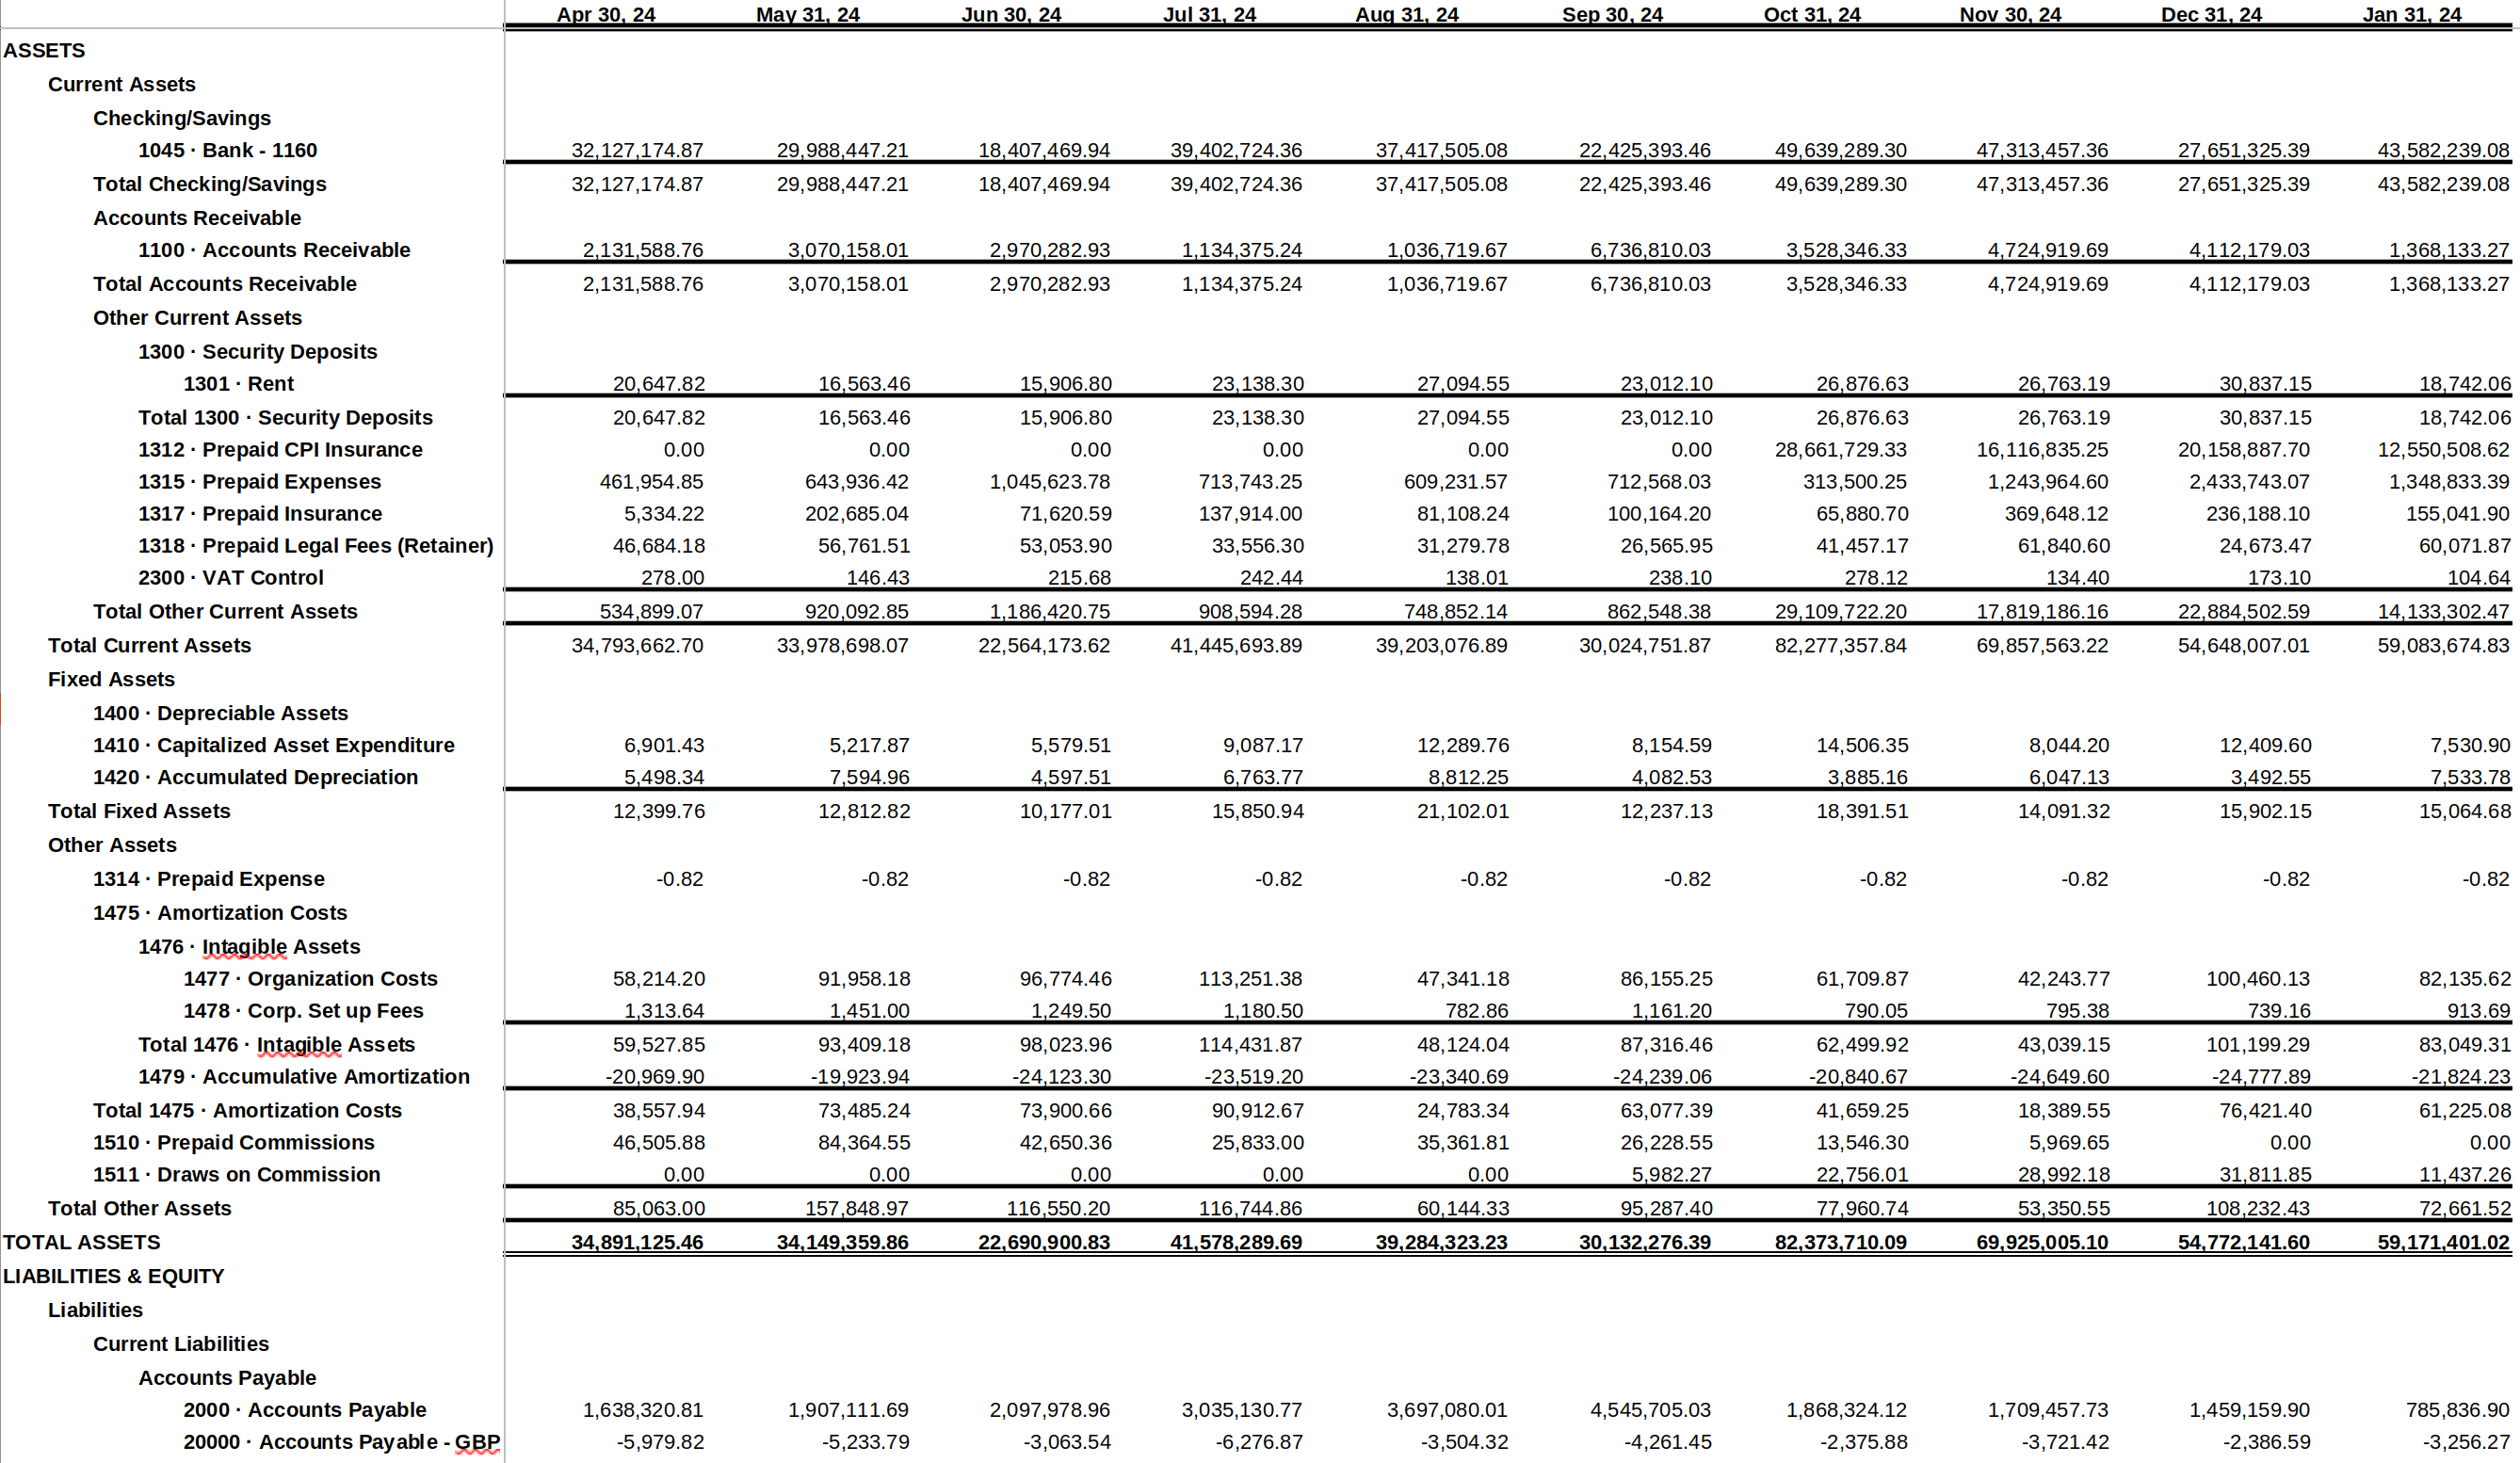
In this way if you provide Scoop with, say, historical financials, you can then relate that information to any other operational data you may have. A common use case, for example, is providing income statement expense data on marketing campaigns and then using that data combined with marketing application data from an application like Hubspot, Marketo or Salesforce.com to be able to track cost per lead and even cost per closed deal - enabling one to understand things like customer acquisition costs.
File Types that Scoop can Ingest
When Scoop ingests a file, it analyzes it to find tables of data in one of the formats mentioned above. If it finds multiple tables it will actually create multiple datasets, one for each type table found. For example if your spreadsheet or zip file has multiple tables of data, Scoop will extract each one. It will label the table with a name that reflects its origin. You can rename the dataset table to something more user friendly if you like.
CSV or Delimited Files
 If Scoop doesn't find a known file suffix that requires it to be of a certain type (like .xlsx, .html or .zip), it will analyze it to see if it is a delimited file. Scoop will recognize common delimiters (like comma and tab) and extract that data into a grid that will be analyzes for the structures described above (tables, banded reports, pivot tables and financial statements.
Excel/Spreadsheet Files (.xlsx)
Scoop can unpack a spreadsheet .xlsx file as well (note Scoop does not read older .xls files which should be re-saved as .xlsx). When Scoop opens a spreadsheet file, it analyzes it for content. It examines each worksheet within the file and attempts to find tables in them. If it finds multiple tables, it will extract each one.
HTML Files
Scoop understands HTML as well. If your report is actually a table in HTML, it will extract it (see the example at the top of this page). Generally this happens when the report is sent to you via email and is nicely formatted. As long as the data within the HTML is in a table format, Scoop should be able to ingest it.
Zip Files
You can send Scoop zip files containing data as well. Like spreadsheets, Scoop will open the zip file and then analyze every file inside. If those files are zip files or spreadsheets themselves, it will continue to unpack the content until it gets to the lowest level of content and it will scan that content for tabular data.
Scoop Dataset Tables
When a report is loaded into a dataset table, Scoop adds some additional information to track it. In addition to the data from the report itself, the following is added to each row:
- Scoop timestamp - this is basically the date the report is loaded. This allows you later to analyze by this date to see trends over time and across reports
- Scoop date keys - these keys allow Scoop to load a version of your data for each date in your dataset, if present. This allows Scoop to easily aggregate your data based on other dates present in your data. For more information see Intelligent Handling Dates in Data.
In the case of snapshot datasets, Scoop adds additional processing to support analyzing changes across those datasets. See Snapshot Datasets and Tracking Changes for more detail.
Updated 8 months ago