Creating a Live Worksheet
Cloud-connected spreadsheets with real-time sync and Scoop data integration
A Live Worksheet is a Google Sheet connected to Scoop that enables powerful spreadsheet-based analysis with live data integration. Unlike standard spreadsheets, Live Worksheets sync with Scoop in real-time, allowing you to build dynamic models that automatically update with fresh data.
What Live Worksheets Enable
| Capability | Description |
|---|---|
| Scoop Data Integration | Pull data from any Scoop dataset into your spreadsheet using the Scoop for Sheets plugin |
| Canvas Embedding | Display and edit named ranges directly on canvases (sheetlets) |
| Real-Time Sync | Changes sync automatically between Google Sheets and Scoop |
| Dynamic Visualization | Create charts and tables based on spreadsheet data |
| What-If Analysis | Change assumptions and see results update instantly |
| Calculated Columns | Define formulas that process dataset columns row-by-row |
How Live Worksheets Work
Live Worksheets leverage a three-tier caching system for fast, reliable access:
┌─────────────────────────────────────────────────────────┐
│                    Your Browser                          │
│                         ↕                                │
│  ┌─────────────────────────────────────────────────────┐│
│  │              Memory Cache (fastest)                 ││
│  │                       ↕                             ││
│  │              S3 Cache (backup)                      ││
│  │                       ↕                             ││
│  │           Google Sheets (source of truth)           ││
│  └─────────────────────────────────────────────────────┘│
└─────────────────────────────────────────────────────────┘
Scoop monitors Google Sheets for changes every few seconds, automatically syncing updates. When you edit a cell in Google Sheets, the change appears in Scoop almost immediately.
Creating a New Live Worksheet
Navigate to the Live Worksheets page by clicking the last icon in the icon bar, then click New Live Worksheet.
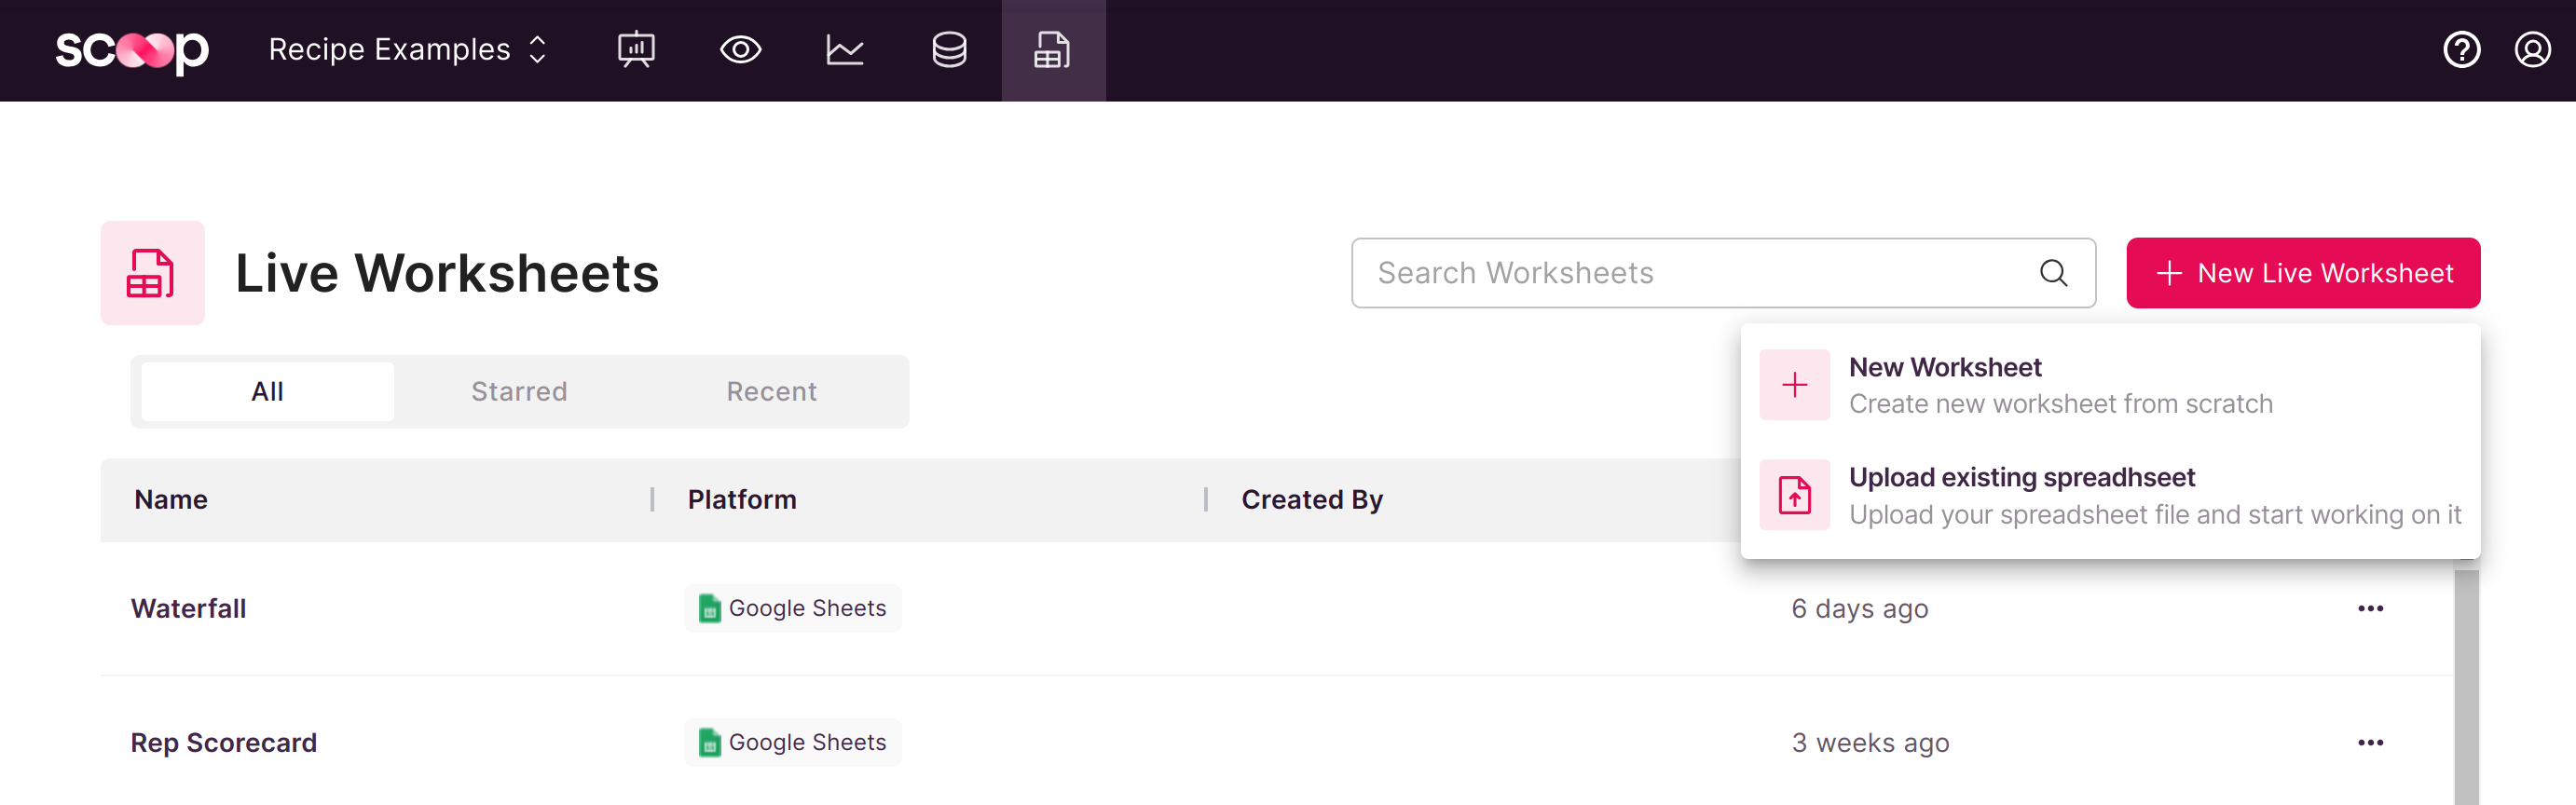
Creation Options
| Option | Description | Best For |
|---|---|---|
| Create New | Scoop creates a fresh Google Sheet | Starting from scratch |
| Upload Excel | Import an existing .xlsx workbook | Migrating existing models |
When uploading an Excel file:
- Scoop converts it to Google Sheets format
- All formulas are preserved and recalculated
- Named ranges are automatically imported
- The original file remains unchanged
After Creation
Your new Live Worksheet:
- Opens in Google Sheets in a new tab
- Is linked to your Scoop workspace
- Supports the Scoop for Sheets plugin
- Can be embedded in canvases as sheetlets
Live Worksheet Capabilities
1. Data Import with Scoop for Sheets
Use the plugin to create queries that populate sheets with Scoop data:
- Install the Scoop for Sheets plugin (see Installing Scoop for Sheets)
- Open the plugin from Extensions → Scoop for Sheets
- Create a query selecting your dataset and columns
- Execute to populate a sheet with live data
2. Named Ranges on Canvases
Any named range in your worksheet can be displayed on a canvas:
- Create a named range in Google Sheets (Data → Named ranges)
- Add a Sheetlet to your canvas
- Select your Live Worksheet and named range
- The range displays with full editing capability
See Embedding Named Ranges for details.
3. Formula-Based Calculations
Live Worksheets support full Excel/Google Sheets formula syntax:
- Standard functions: SUM, AVERAGE, IF, VLOOKUP, etc.
- Date functions: TODAY, EOMONTH, NETWORKDAYS
- Financial functions: NPV, IRR, PMT
- Text functions: CONCAT, LEFT, MID, SUBSTITUTE
- Logical functions: AND, OR, NOT, IFS
Formulas calculate in real-time as data changes.
4. Visualization from Spreadsheet Data
Create charts based on worksheet tables:
- Click "Create from worksheet" in Explorer
- Select the data range
- Choose metrics and dimensions
- Scoop creates a visualization that updates with the spreadsheet
Common Use Cases
Financial Modeling
Build financial models that pull actuals from Scoop datasets:
┌──────────────────────────────────────────┐
│ Revenue Forecast Model                    │
├──────────────────┬───────────────────────┤
│ Actual Revenue   │ =SUM(ScoopData!B:B)   │  ← From Scoop dataset
│ Growth Rate      │ 12%                   │  ← Manual assumption
│ Forecast         │ =B2*(1+B3)            │  ← Calculated
└──────────────────┴───────────────────────┘
Budget vs. Actual Analysis
Compare budget assumptions against real-time actuals:
- Enter budget figures manually
- Pull actual data via Scoop for Sheets
- Calculate variances with formulas
- Display on canvas for stakeholder review
What-If Scenarios
Create interactive models where changing one cell cascades through calculations:
- Change growth rate → See updated revenue projections
- Adjust pricing → Watch margin calculations update
- Modify headcount → View budget impact instantly
KPI Dashboards
Build dashboards with calculations that Scoop's standard analytics can't provide:
- Custom weighted scores
- Complex conditional logic
- Multi-step calculations
- Rolling averages with specific lookback periods
Best Practices
Organization
- Use descriptive names for worksheets and ranges
- Group related calculations on the same sheet
- Create a "Assumptions" area for editable inputs
- Use named ranges for all data referenced in canvases
Performance
- Keep formulas simple when possible
- Avoid volatile functions (NOW, RAND) in frequently-accessed ranges
- Limit the number of Scoop queries per workbook
- Use structured tables for large datasets
Collaboration
- Live Worksheets are standard Google Sheets—share via Google
- Scoop users see the same data through canvas sheetlets
- Changes made in Google Sheets appear in Scoop (and vice versa)
Plugin Requirement
The Scoop for Sheets plugin only works with Live Worksheets. Attempting to use the plugin with a non-linked Google Sheet produces an error. This ensures all Scoop data integrations are properly managed and secured.
Related Topics
- Google Sheets Plugin - Query Scoop datasets from your spreadsheet
- Embedding Named Ranges - Display ranges on canvases
- Installing Scoop for Sheets - Plugin setup
Updated 8 months ago