Filtering Data
Focus your analysis on exactly the data you need
Filters let you focus your analysis on a specific subset of your data. Instead of analyzing your entire dataset, you can drill into particular regions, time periods, customer segments, or any other dimension that matters to your business.
Creating Filters
Basic Filter Creation
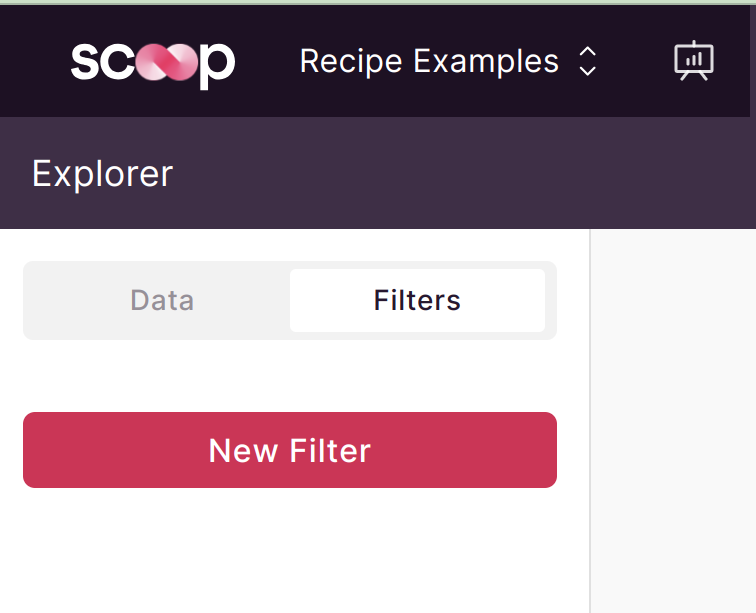
- In Explorer, click the Filter tab in the left panel
- Click + New Filter
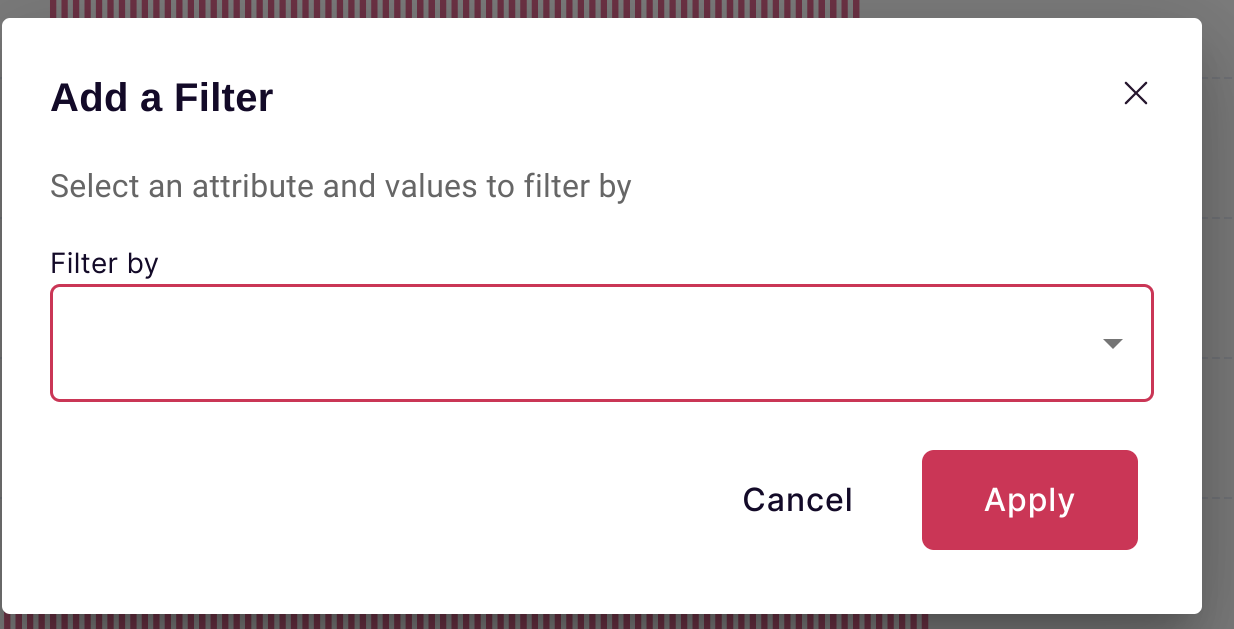
- Select the column you want to filter by
- Choose your filter condition and values
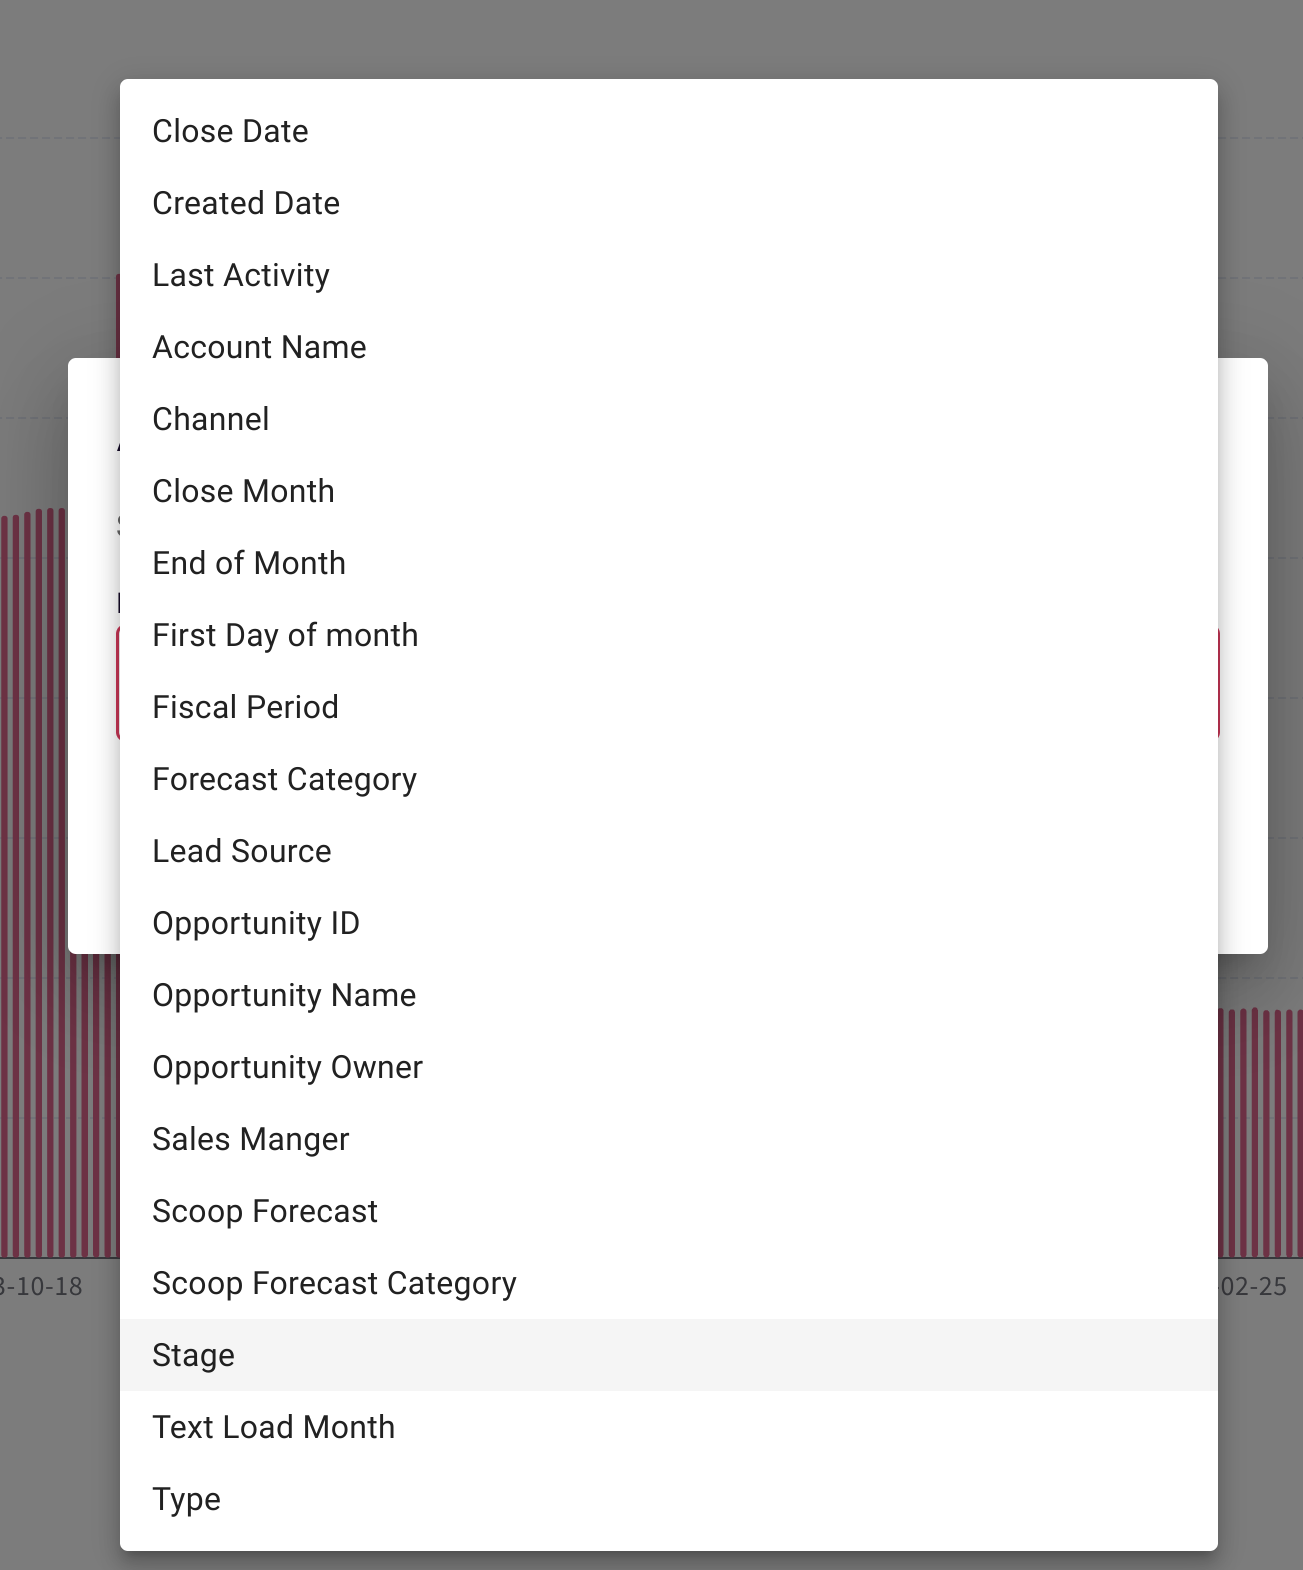
Selecting Filter Columns
Click on any column from your dataset to use it as a filter:
Filter Types by Column
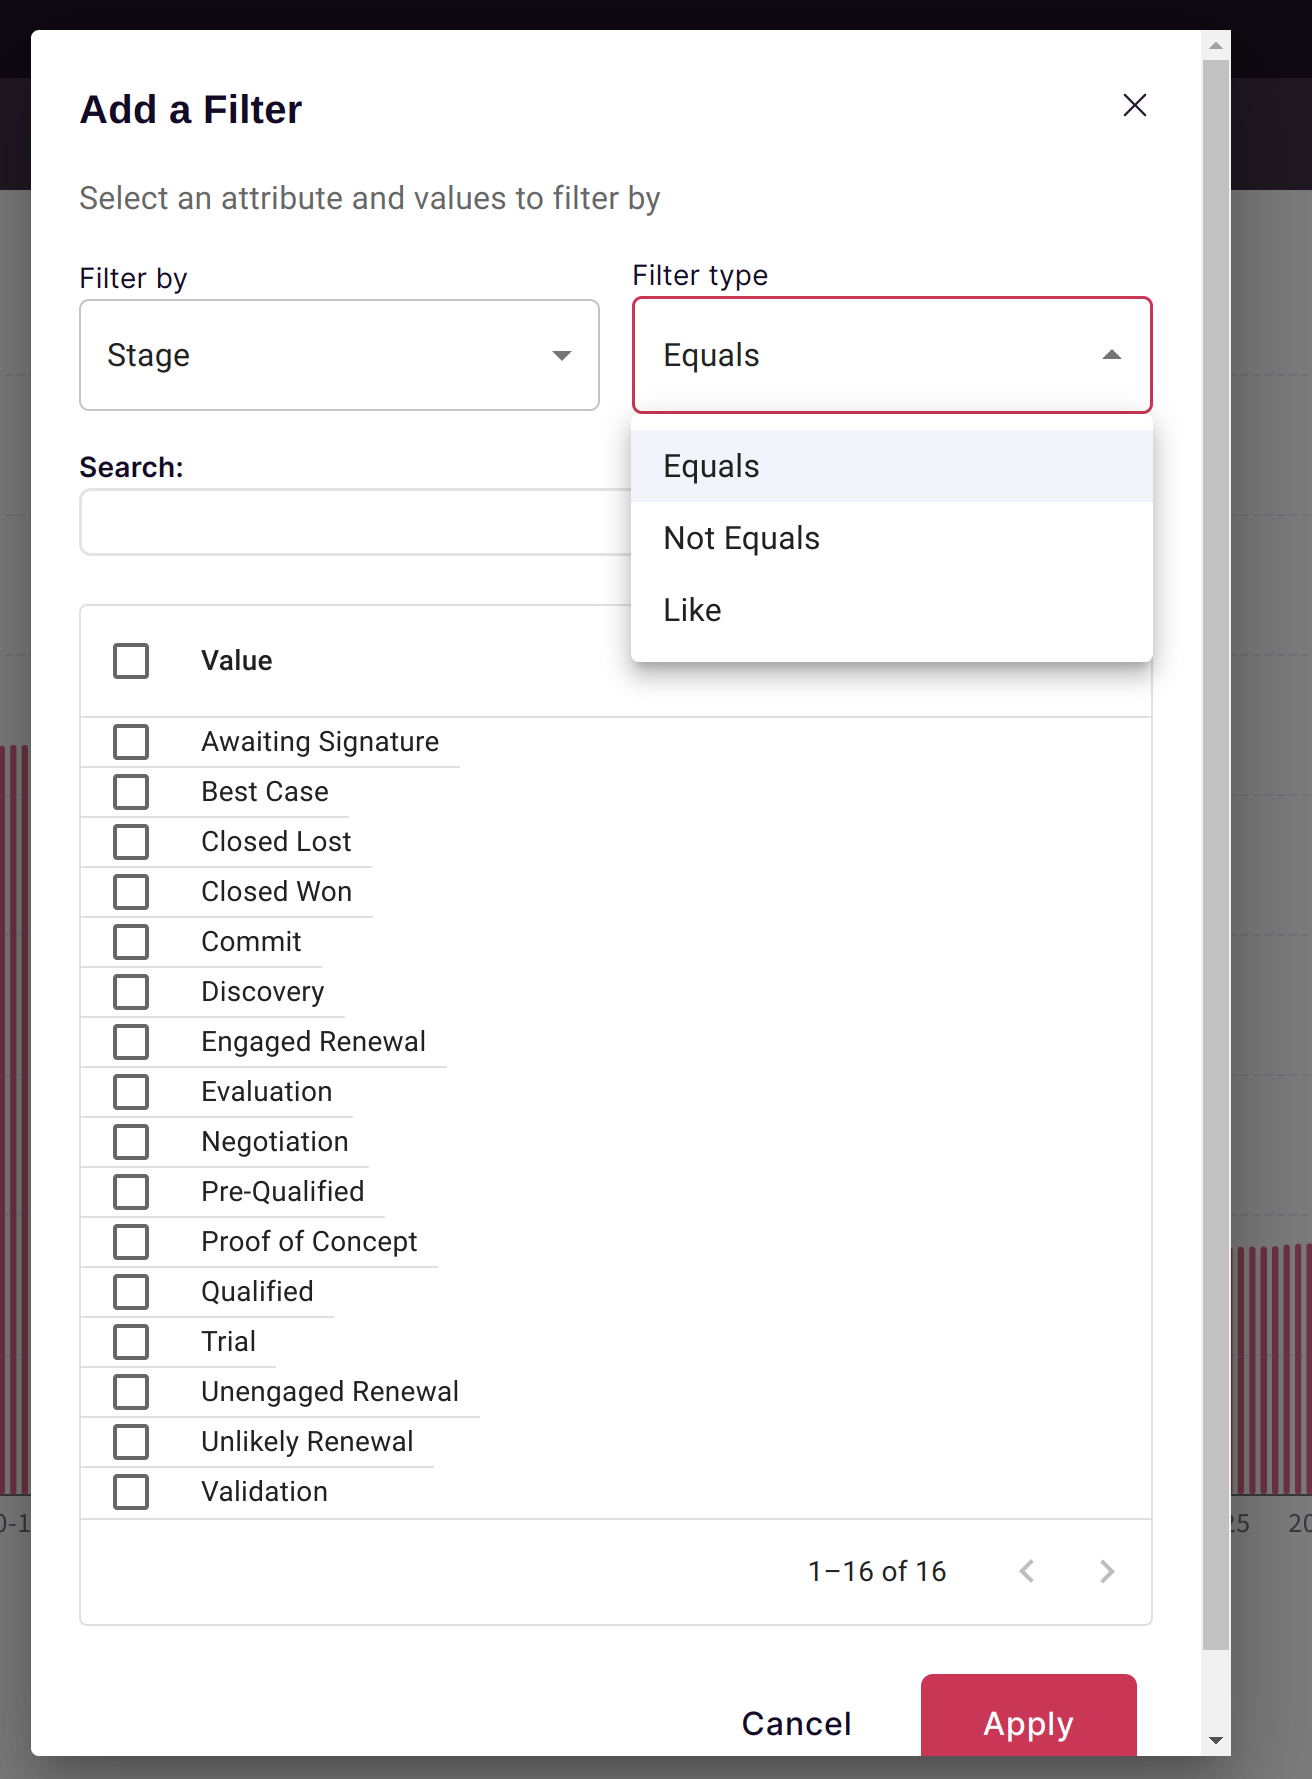
Text Columns
For text/categorical columns, you have three options:
| Operator | Description | Example |
|---|---|---|
| Equals | Exact match | Region equals "West" |
| Not Equals | Exclude specific values | Status not equals "Cancelled" |
| Like | Contains text anywhere | Product like "Pro" matches "ProPlan", "Product Pro", etc. |
Selecting Multiple Values
You can select multiple values to include or exclude:
Include mode: Show only rows where the column matches ANY selected value
Exclude mode: Show all rows EXCEPT those matching selected values
Searching High-Cardinality Columns
For columns with many unique values (like customer names or product IDs):
- Use the Search box to find specific values
- Type part of the value to filter the list
- Select from the filtered results
This is especially useful when a column has hundreds or thousands of unique values.
Numeric Columns
For numeric columns, use comparison operators:
| Operator | Description | Example |
|---|---|---|
| Equals | Exact value | Amount = 1000 |
| Not Equals | Exclude value | Quantity ≠ 0 |
| Greater Than | Above threshold | Revenue > 50000 |
| Greater Than or Equal | At or above | Score ≥ 80 |
| Less Than | Below threshold | Days < 30 |
| Less Than or Equal | At or below | Cost ≤ 100 |
| Between | Range of values | Price between 10 and 50 |
Filtering for Outliers
To find outliers or anomalies:
- High values: Greater than [threshold]
- Low values: Less than [threshold]
- Specific range: Between [min] and [max]
Date Columns
Date filters support both absolute and relative options:
Relative Date Filters
| Filter | Description |
|---|---|
| Last 7 days | Rolling week from today |
| Last 30 days | Rolling month from today |
| Last quarter | Previous 3-month period |
| Last year | Previous 12 months |
| This month | Current calendar month |
| This quarter | Current calendar quarter |
| This year | Current calendar year |
Absolute Date Filters
- Specific date: March 15, 2024
- Date range: January 1, 2024 to March 31, 2024
- Before/After: Before July 1, 2024
Combining Multiple Filters
AND Logic (All Conditions Must Match)
When you add multiple filters, they combine with AND logic:
Example:
- Filter 1: Region = "West"
- Filter 2: Revenue > 10000
Result: Shows only West region deals with revenue over $10,000
OR Logic Within a Filter
When you select multiple values within a single filter, they combine with OR logic:
Example:
- Region equals "West" OR "Central" OR "East"
Result: Shows all three regions, excluding others
Complex Filter Combinations
Combine AND and OR for sophisticated filtering:
Example:
- (Region = "West" OR Region = "Central") AND
- (Deal Stage = "Closed Won") AND
- (Close Date in Last Quarter)
Result: Closed deals from West or Central regions in the last quarter
Saving and Reusing Filters
Save Current Filters
After creating your filter combination:
- Your filters are automatically saved with the chart or visualization
- When you save a chart, its filters are preserved
Filter Presets
For commonly used filter combinations:
- Create your filters
- Save the chart with a descriptive name (e.g., "West Region Q4 Deals")
- Access this preset anytime from your saved charts
Using Filters with AI Chat
When you ask questions in the Insights chat, you can specify filters naturally:
Examples:
- "Show me revenue by product for the West region"
- "What's our win rate for deals over $50K?"
- "Compare this quarter to last quarter for enterprise customers"
Scoop's AI understands filter intent and applies appropriate filters automatically.
Filters vs. Grouping
Understanding when to use filters vs. grouping:
| Use Filters When... | Use Grouping When... |
|---|---|
| You want to exclude data | You want to see all categories |
| Focusing on a specific segment | Comparing across segments |
| Reducing noise in analysis | Understanding distribution |
| Answering "for this segment..." | Answering "by category..." |
Example:
- Filter: "Show me West region revenue" → Single number
- Group: "Show me revenue by region" → Table comparing all regions
Best Practices
Start Broad, Then Narrow
- Begin with your full dataset
- Add one filter at a time
- Verify each filter shows expected results
- Build toward your specific analysis
Use Descriptive Chart Names
When saving filtered views, include filter context:
- "Pipeline by Stage (Enterprise Only)"
- "Monthly Revenue (Excluding Returns)"
- "Q4 Deals Closed Won"
Check Filter Logic
Before drawing conclusions:
- Verify filter count shows expected reduction
- Spot-check a few records to confirm filter accuracy
- Consider if excluded data might affect conclusions
Combine with Snapshots
For time-based analysis:
- Use snapshot date filters to compare periods
- Filter to specific snapshot dates for point-in-time views
- Combine with other filters to track segment changes over time
Troubleshooting
No Results After Filtering
- Check if filters are too restrictive
- Verify spelling/case for text filters
- Ensure date ranges contain data
- Try removing filters one at a time to find the issue
Unexpected Results
- Review all active filters (they combine with AND)
- Check for hidden filters from saved charts
- Verify column data types match filter type
Performance with Many Filters
- Complex filter combinations may take longer
- Consider pre-filtering in a blended dataset for frequently-used combinations
- Use indexed columns when available
Related Topics
- Charting Time Series Data - Visualizing filtered data over time
- Tables and Pivot Tables - Viewing filtered data in tabular form
- Visual Themes - Styling your filtered visualizations
Updated 8 months ago