Blending Two Datasets
Combine data from multiple sources into unified datasets
Data blending combines data from two different datasets—often from entirely different applications—into a single unified dataset. This enables analysis that would be impossible when data lives in separate systems.
Why Blend Data?
| Use Case | Source 1 | Source 2 | Result |
|---|---|---|---|
| Customer 360 | CRM deals | Support tickets | Complete customer view |
| Sales + Marketing | Pipeline data | Campaign data | Attribution analysis |
| Finance + Operations | Budget data | Actual spend | Variance analysis |
| Product + Revenue | Usage metrics | Billing data | Revenue per user |
How Blending Works
┌────────────────┐     ┌────────────────┐
│   Dataset A    │     │   Dataset B    │
│  (e.g., CRM)   │     │ (e.g., Support)│
└───────┬────────┘     └───────┬────────┘
        │                      │
        ▼                      ▼
┌────────────────┐     ┌────────────────┐
│   Query A      │     │   Query B      │
│ (filter, cols) │     │ (filter, cols) │
└───────┬────────┘     └───────┬────────┘
        │                      │
        └──────────┬───────────┘
                   ▼
         ┌─────────────────┐
         │ Blend Condition │
         │  (JOIN logic)   │
         └────────┬────────┘
                  ▼
         ┌─────────────────┐
         │ Output Formulas │
         │ (new columns)   │
         └────────┬────────┘
                  ▼
         ┌─────────────────┐
         │ Blended Dataset │
         └─────────────────┘
Key Concepts
| Concept | Description |
|---|---|
| Source queries | Define what data from each dataset to include |
| Blend condition | Specifies which rows from A match which rows from B |
| Output formulas | Calculate the values for your new blended dataset |
The Blending Process
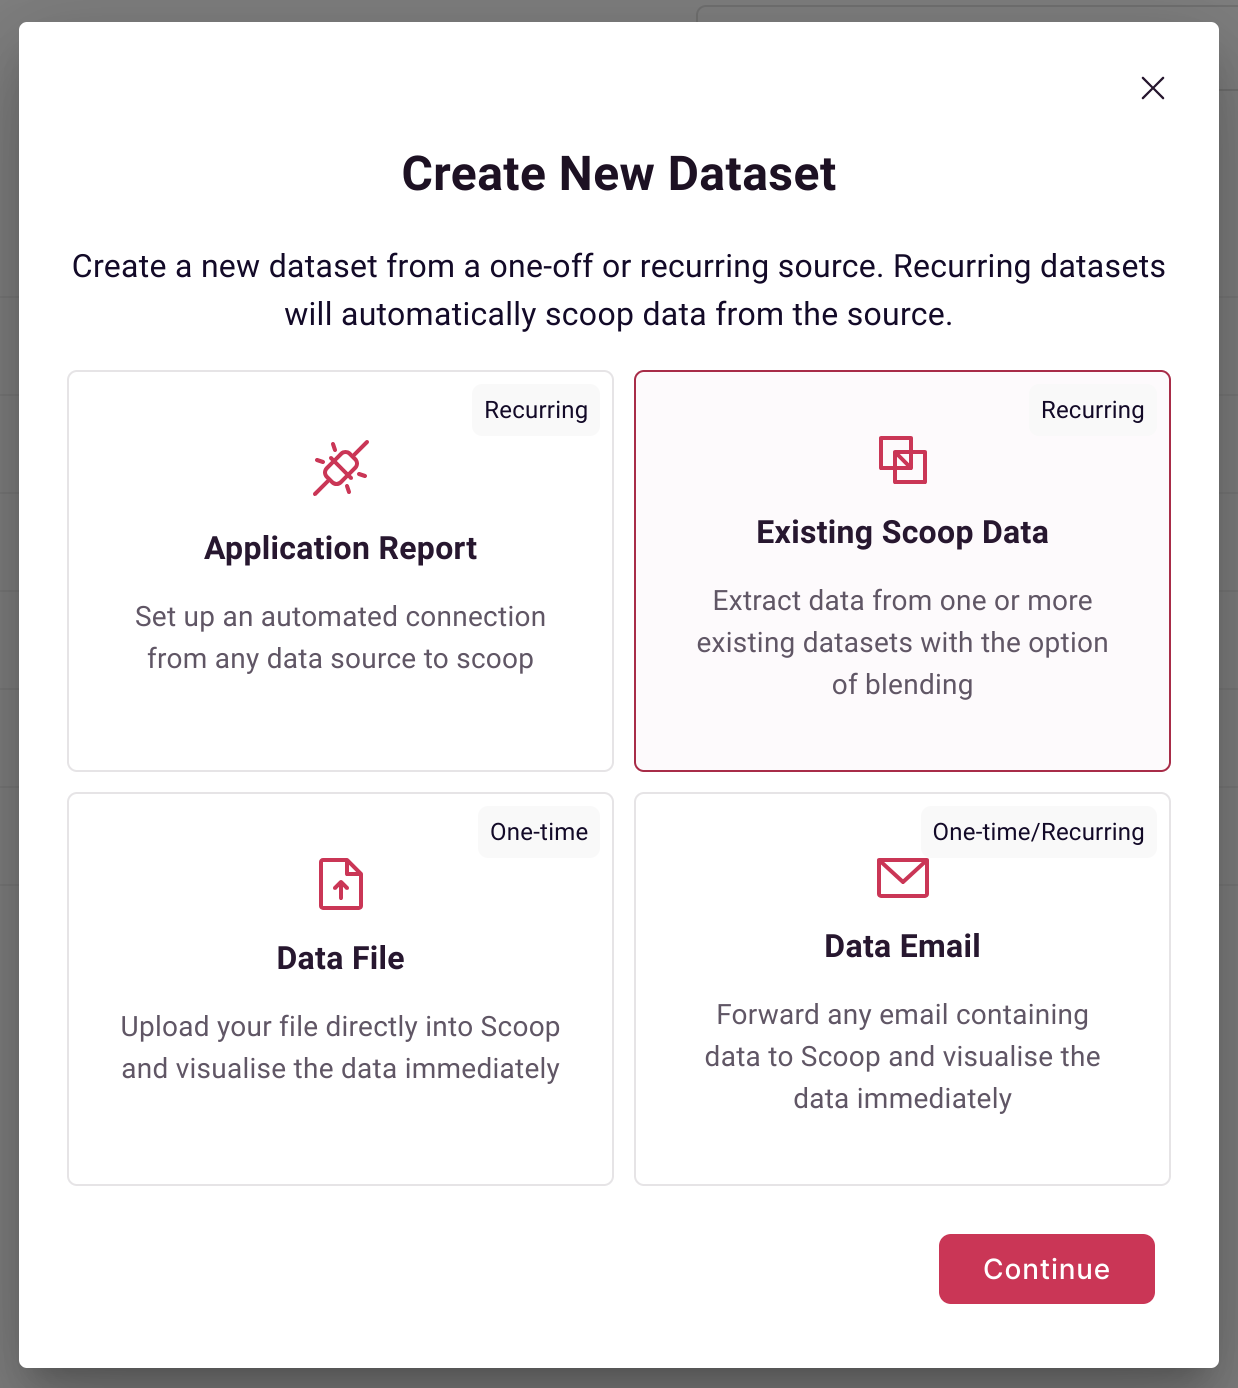
Step 1: Create New Dataset
Select Existing Scoop Data when creating a new dataset:
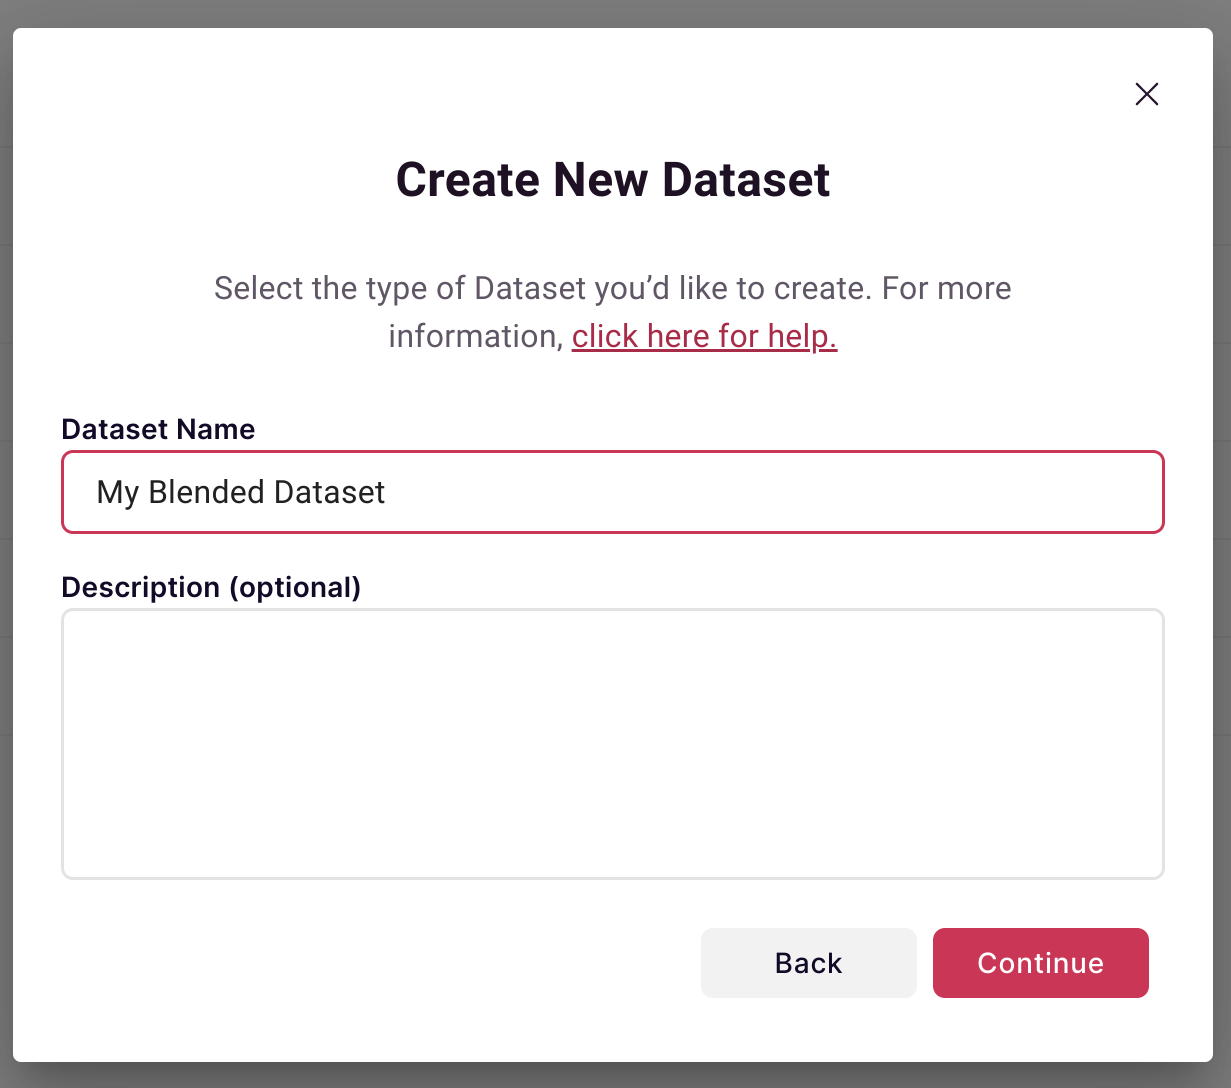
Name your blended dataset:
Select Blended to combine two datasets:
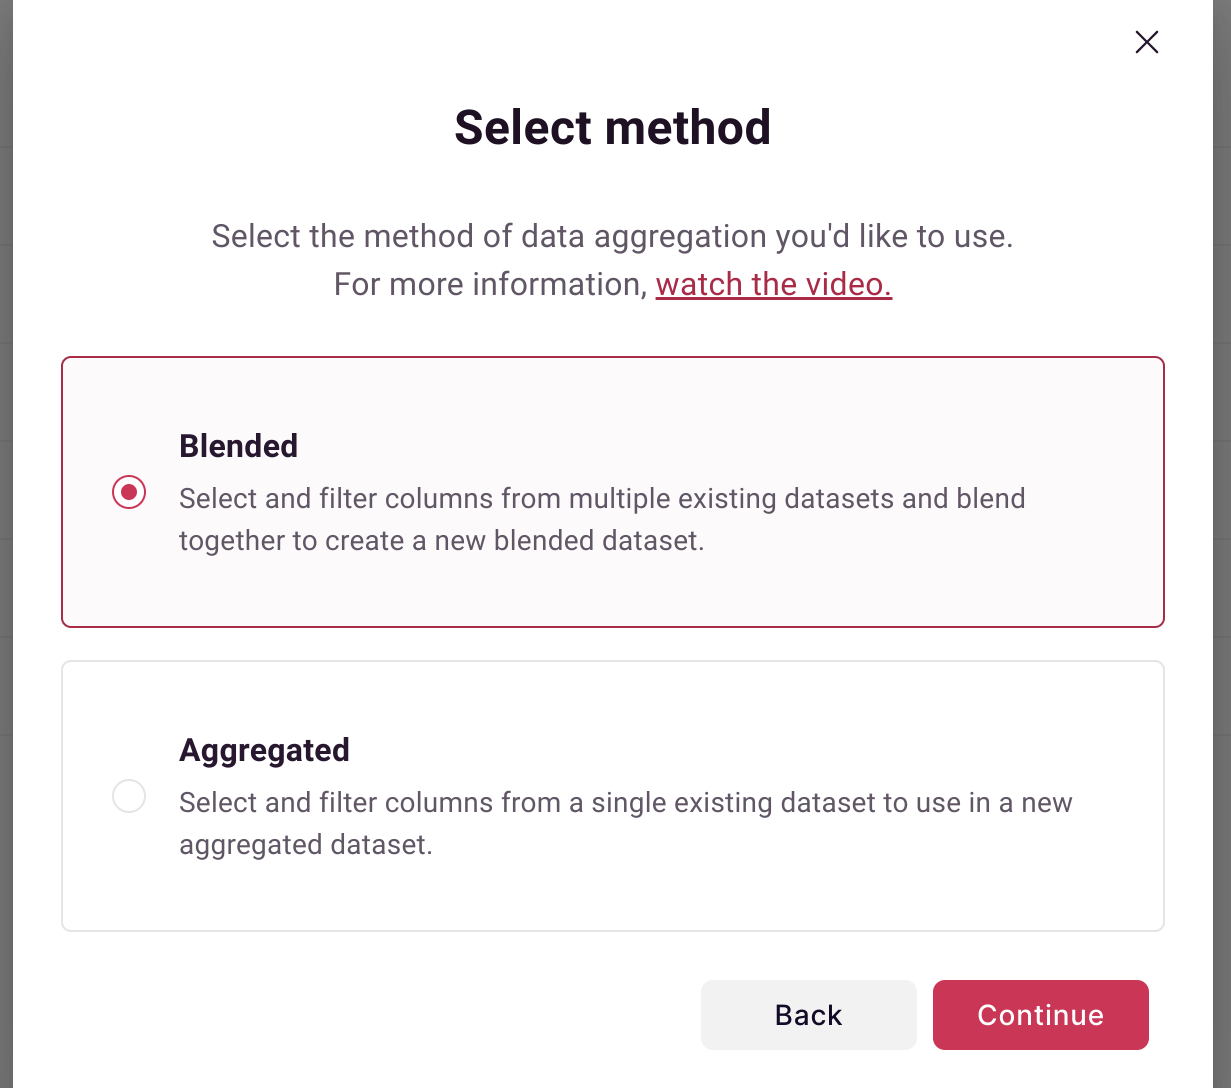
Aggregated Option: If you only need to filter/aggregate a single dataset, select "Aggregated" instead.
Step 2: Configure First Query
Define what data to pull from your first dataset:
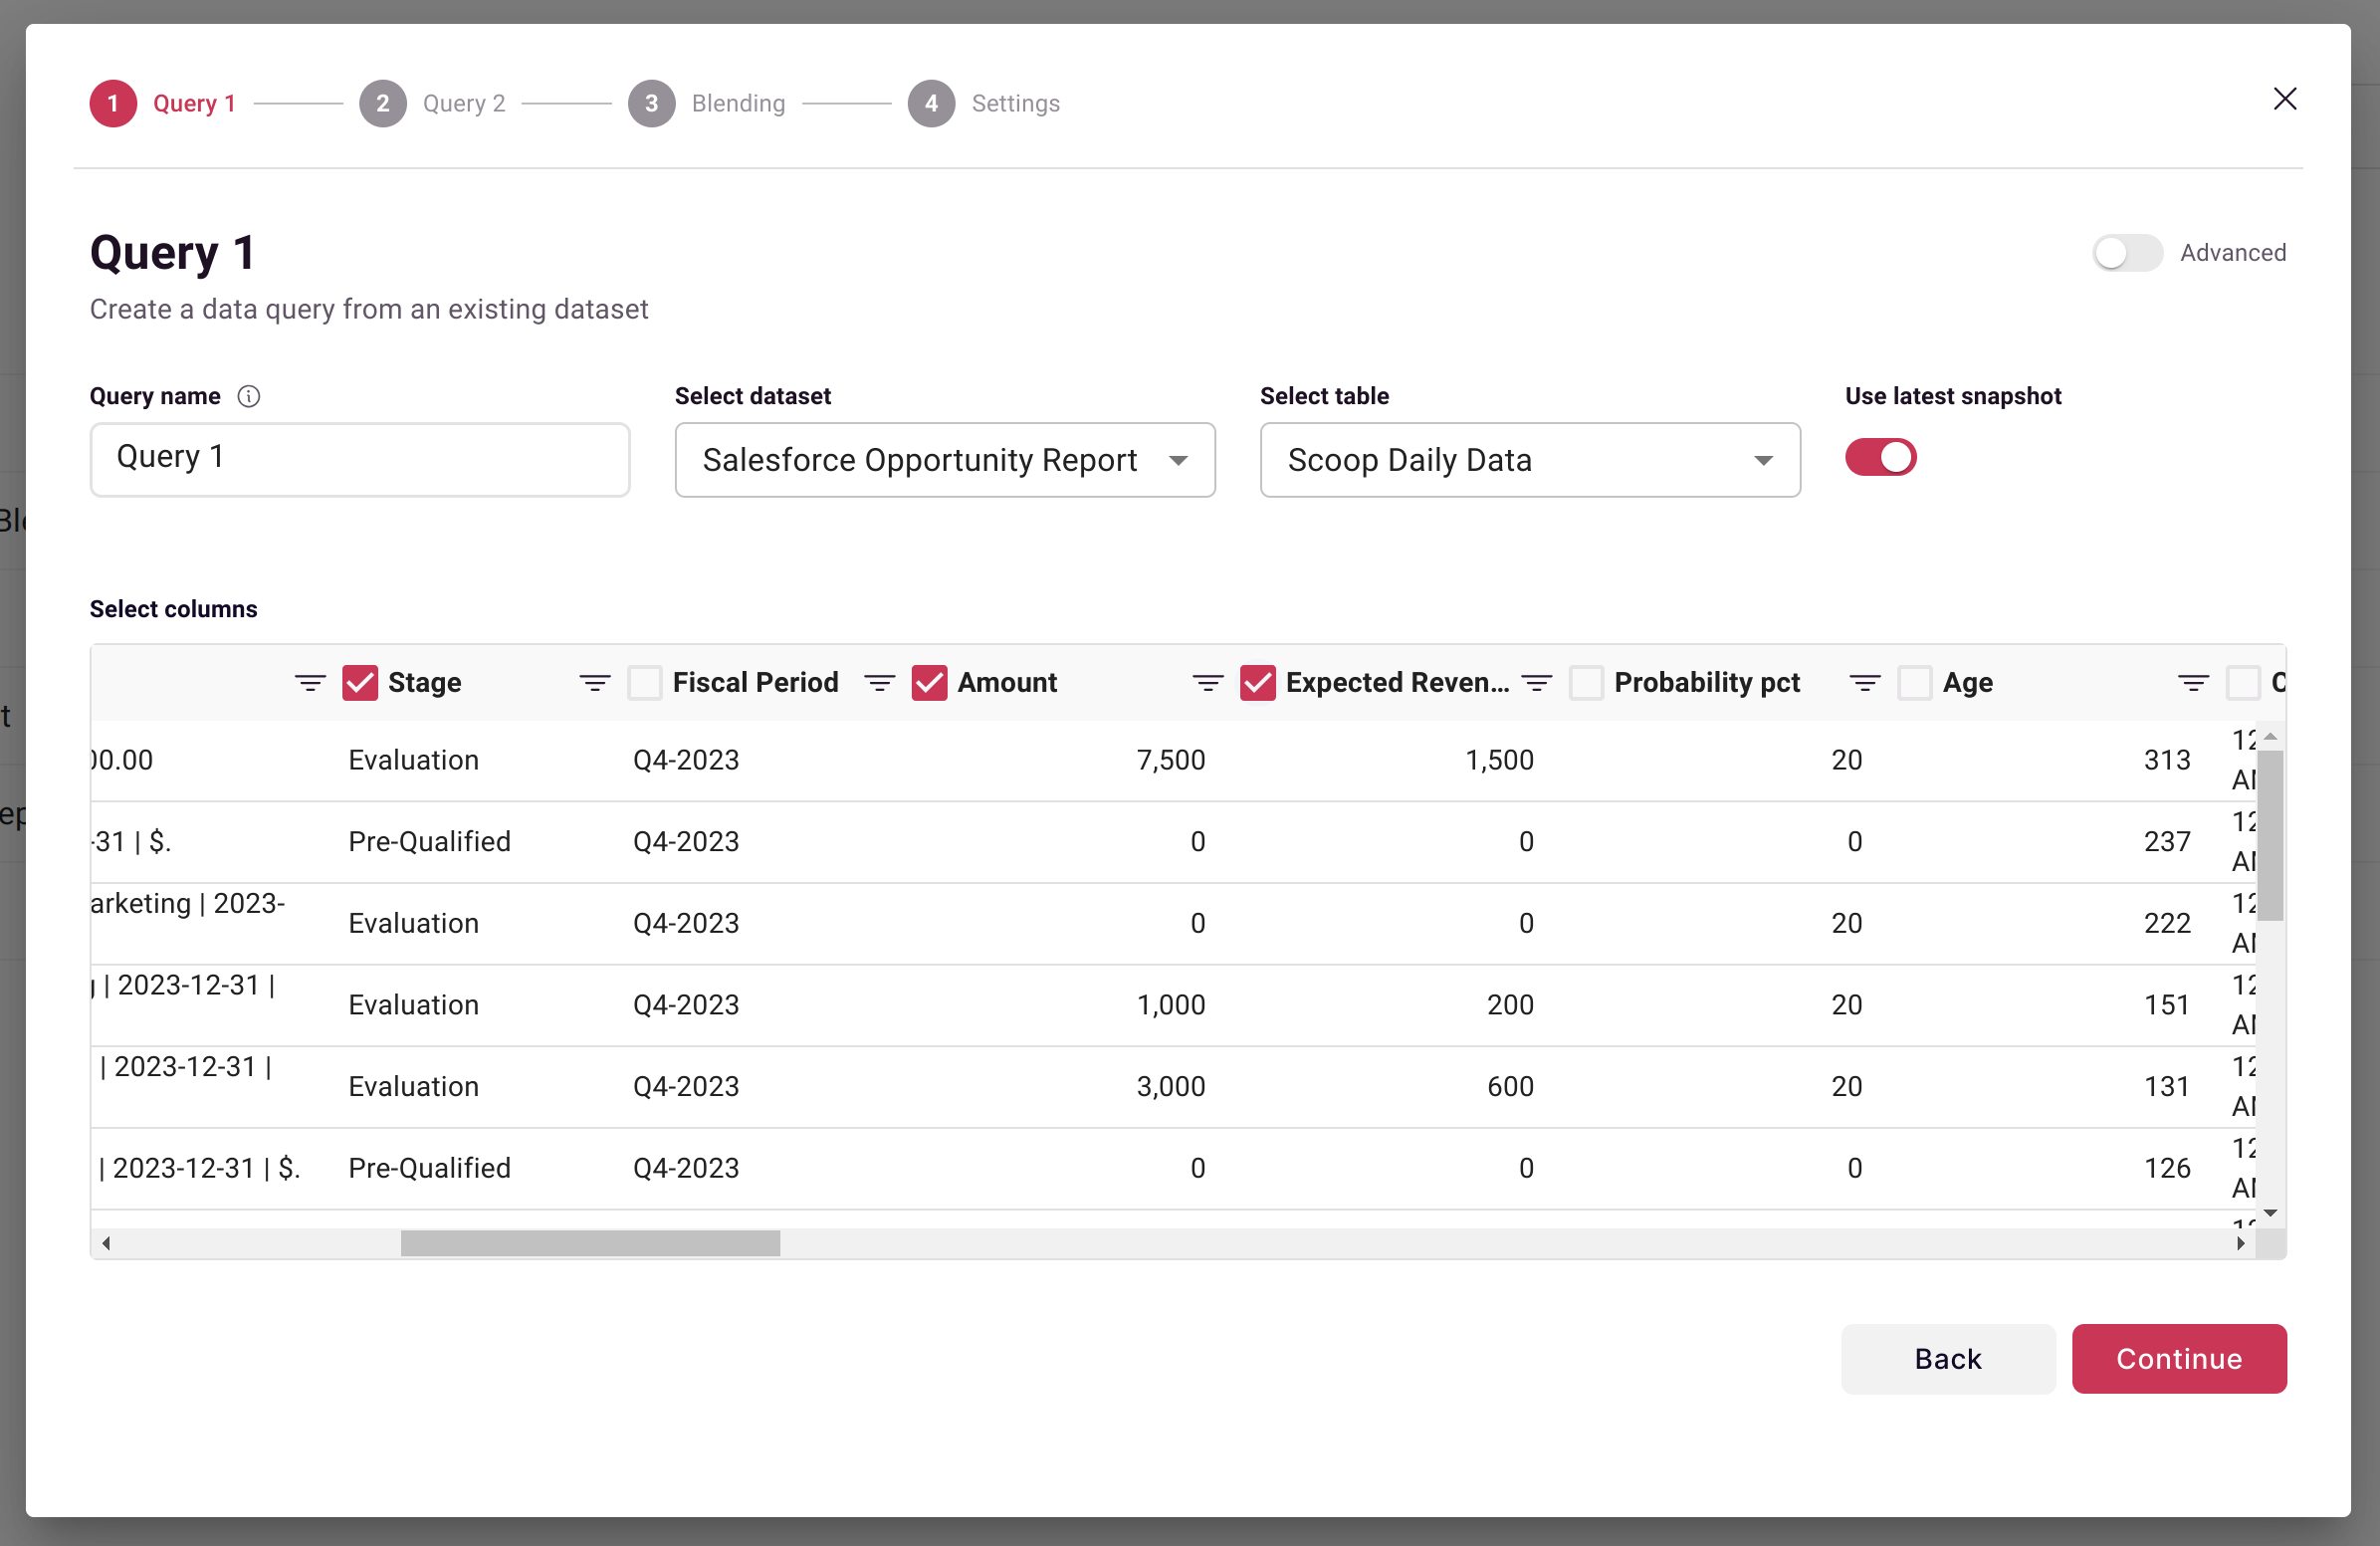
See Dataset Queries for query configuration details.
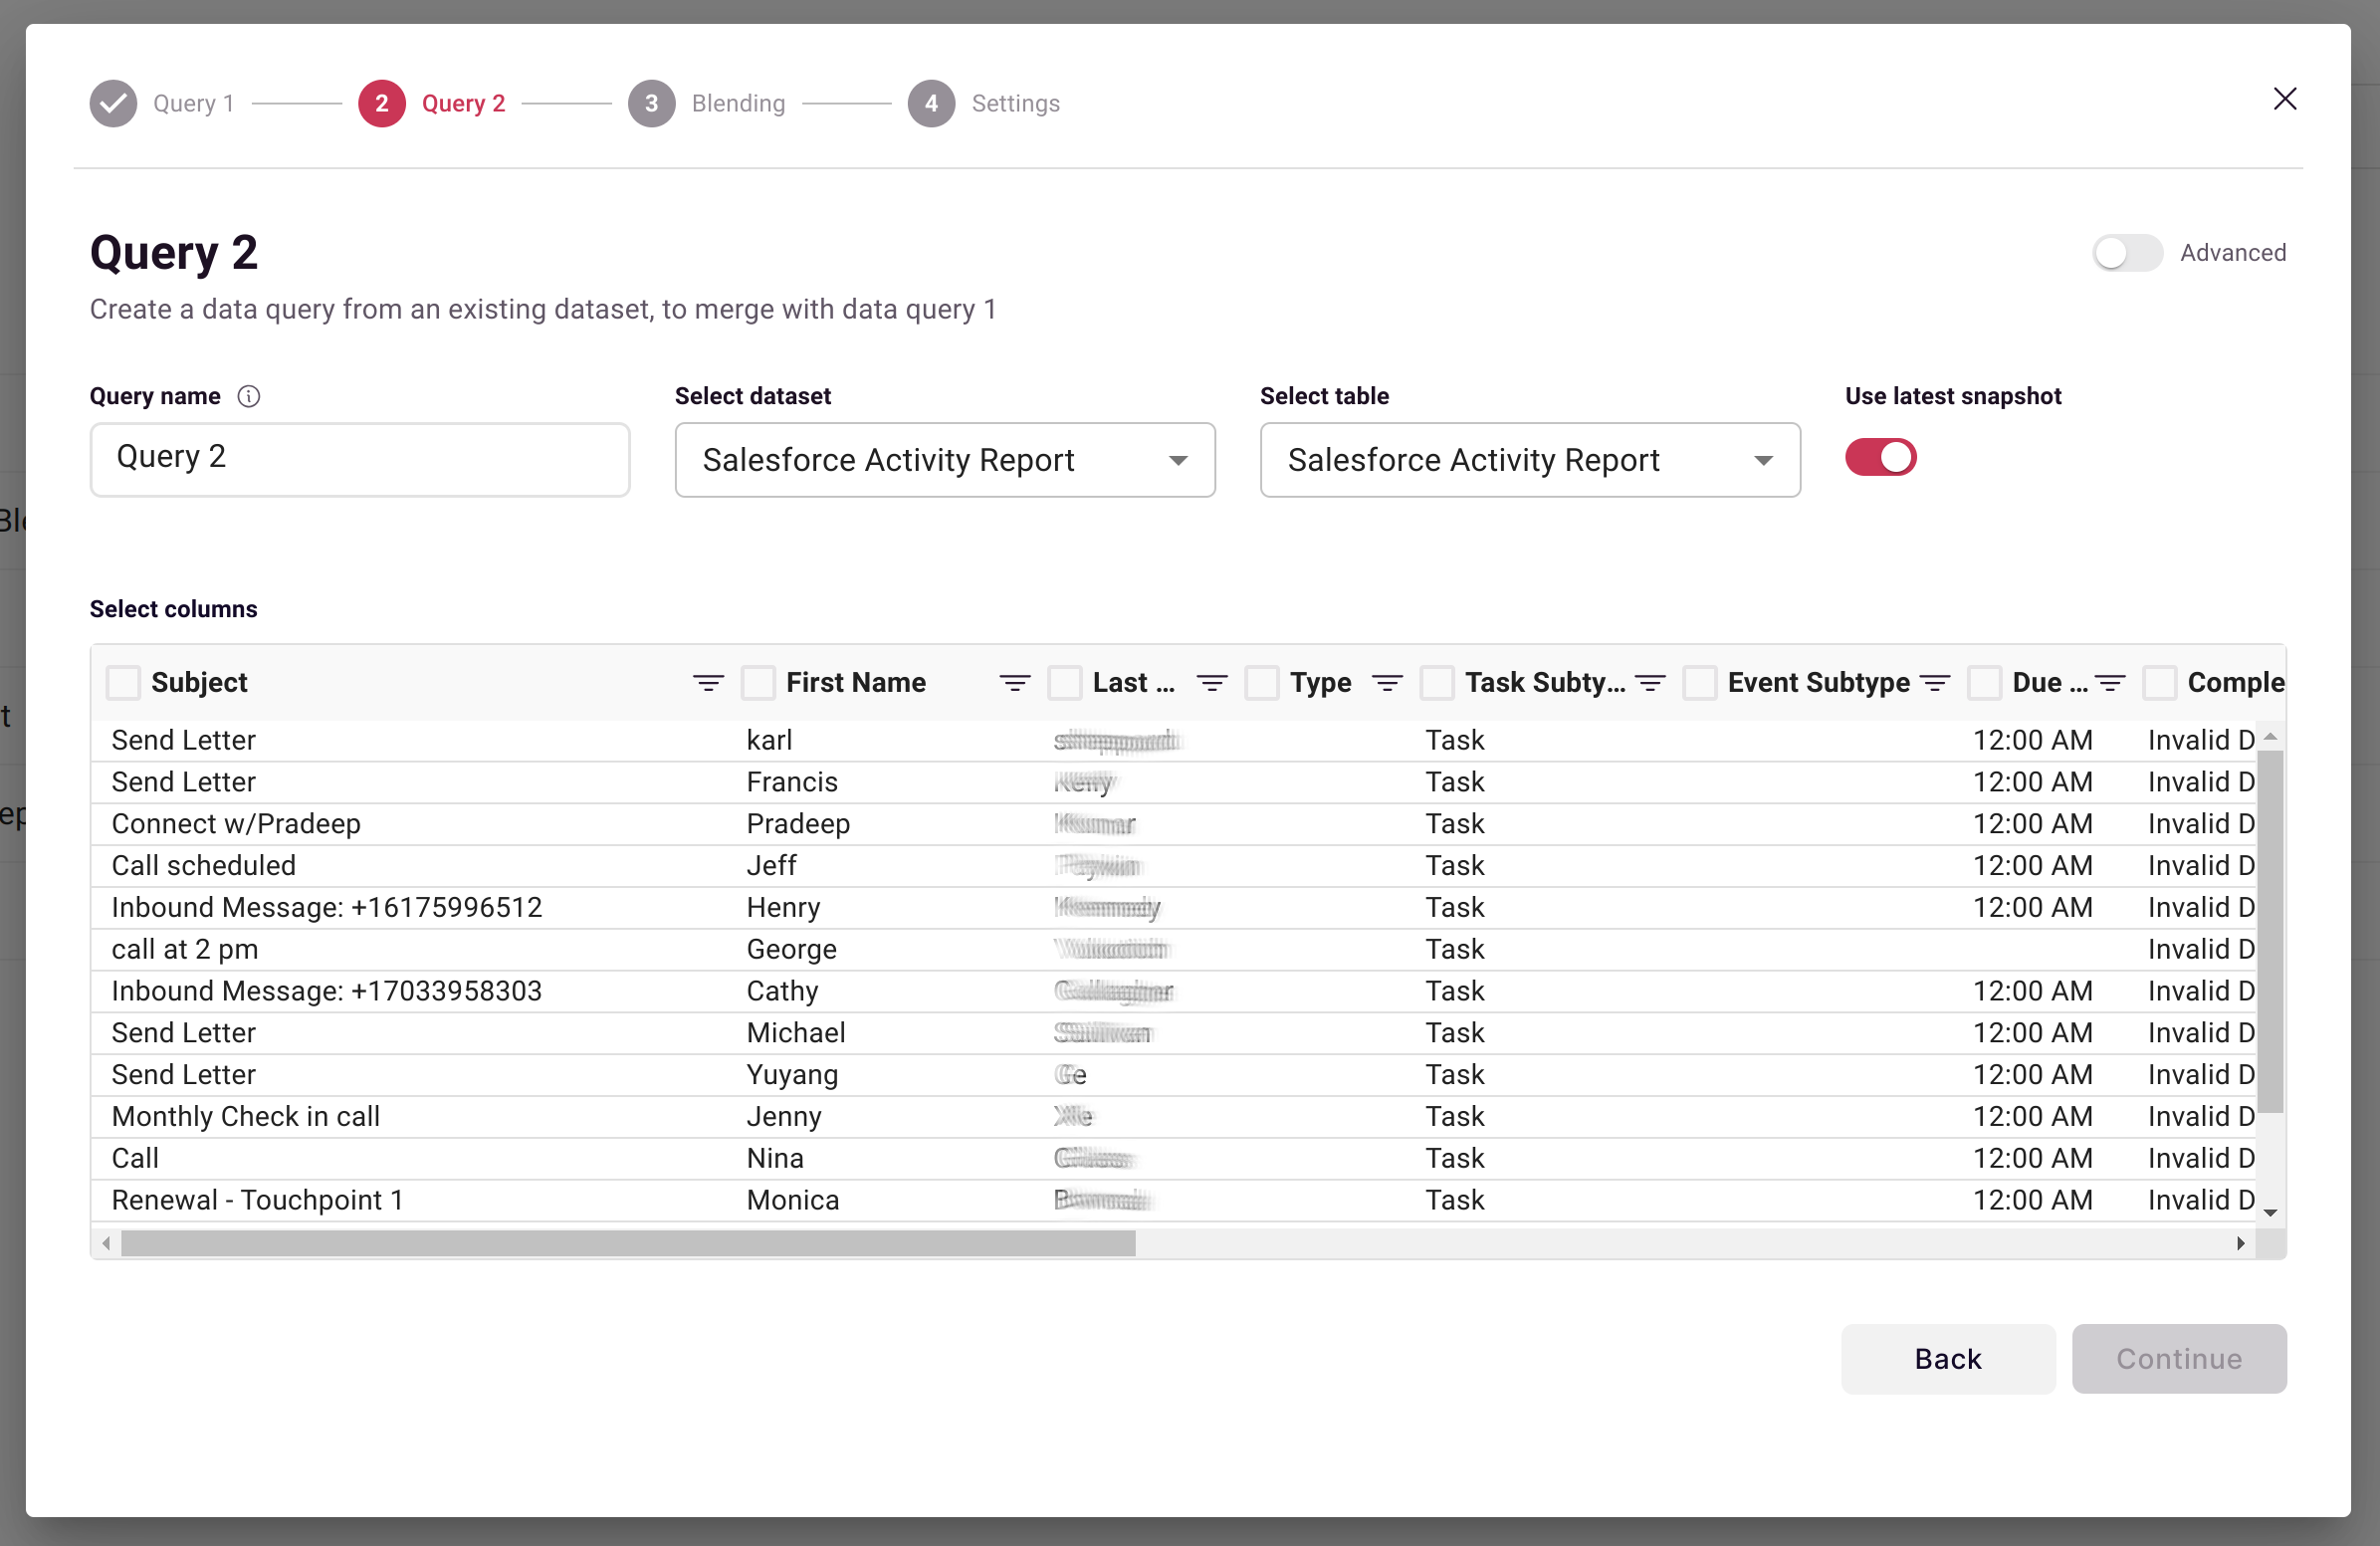
Step 3: Configure Second Query
Define what data to pull from your second dataset:
Step 4: Define Blend Condition
The blend condition determines which rows from Dataset A match which rows from Dataset B:
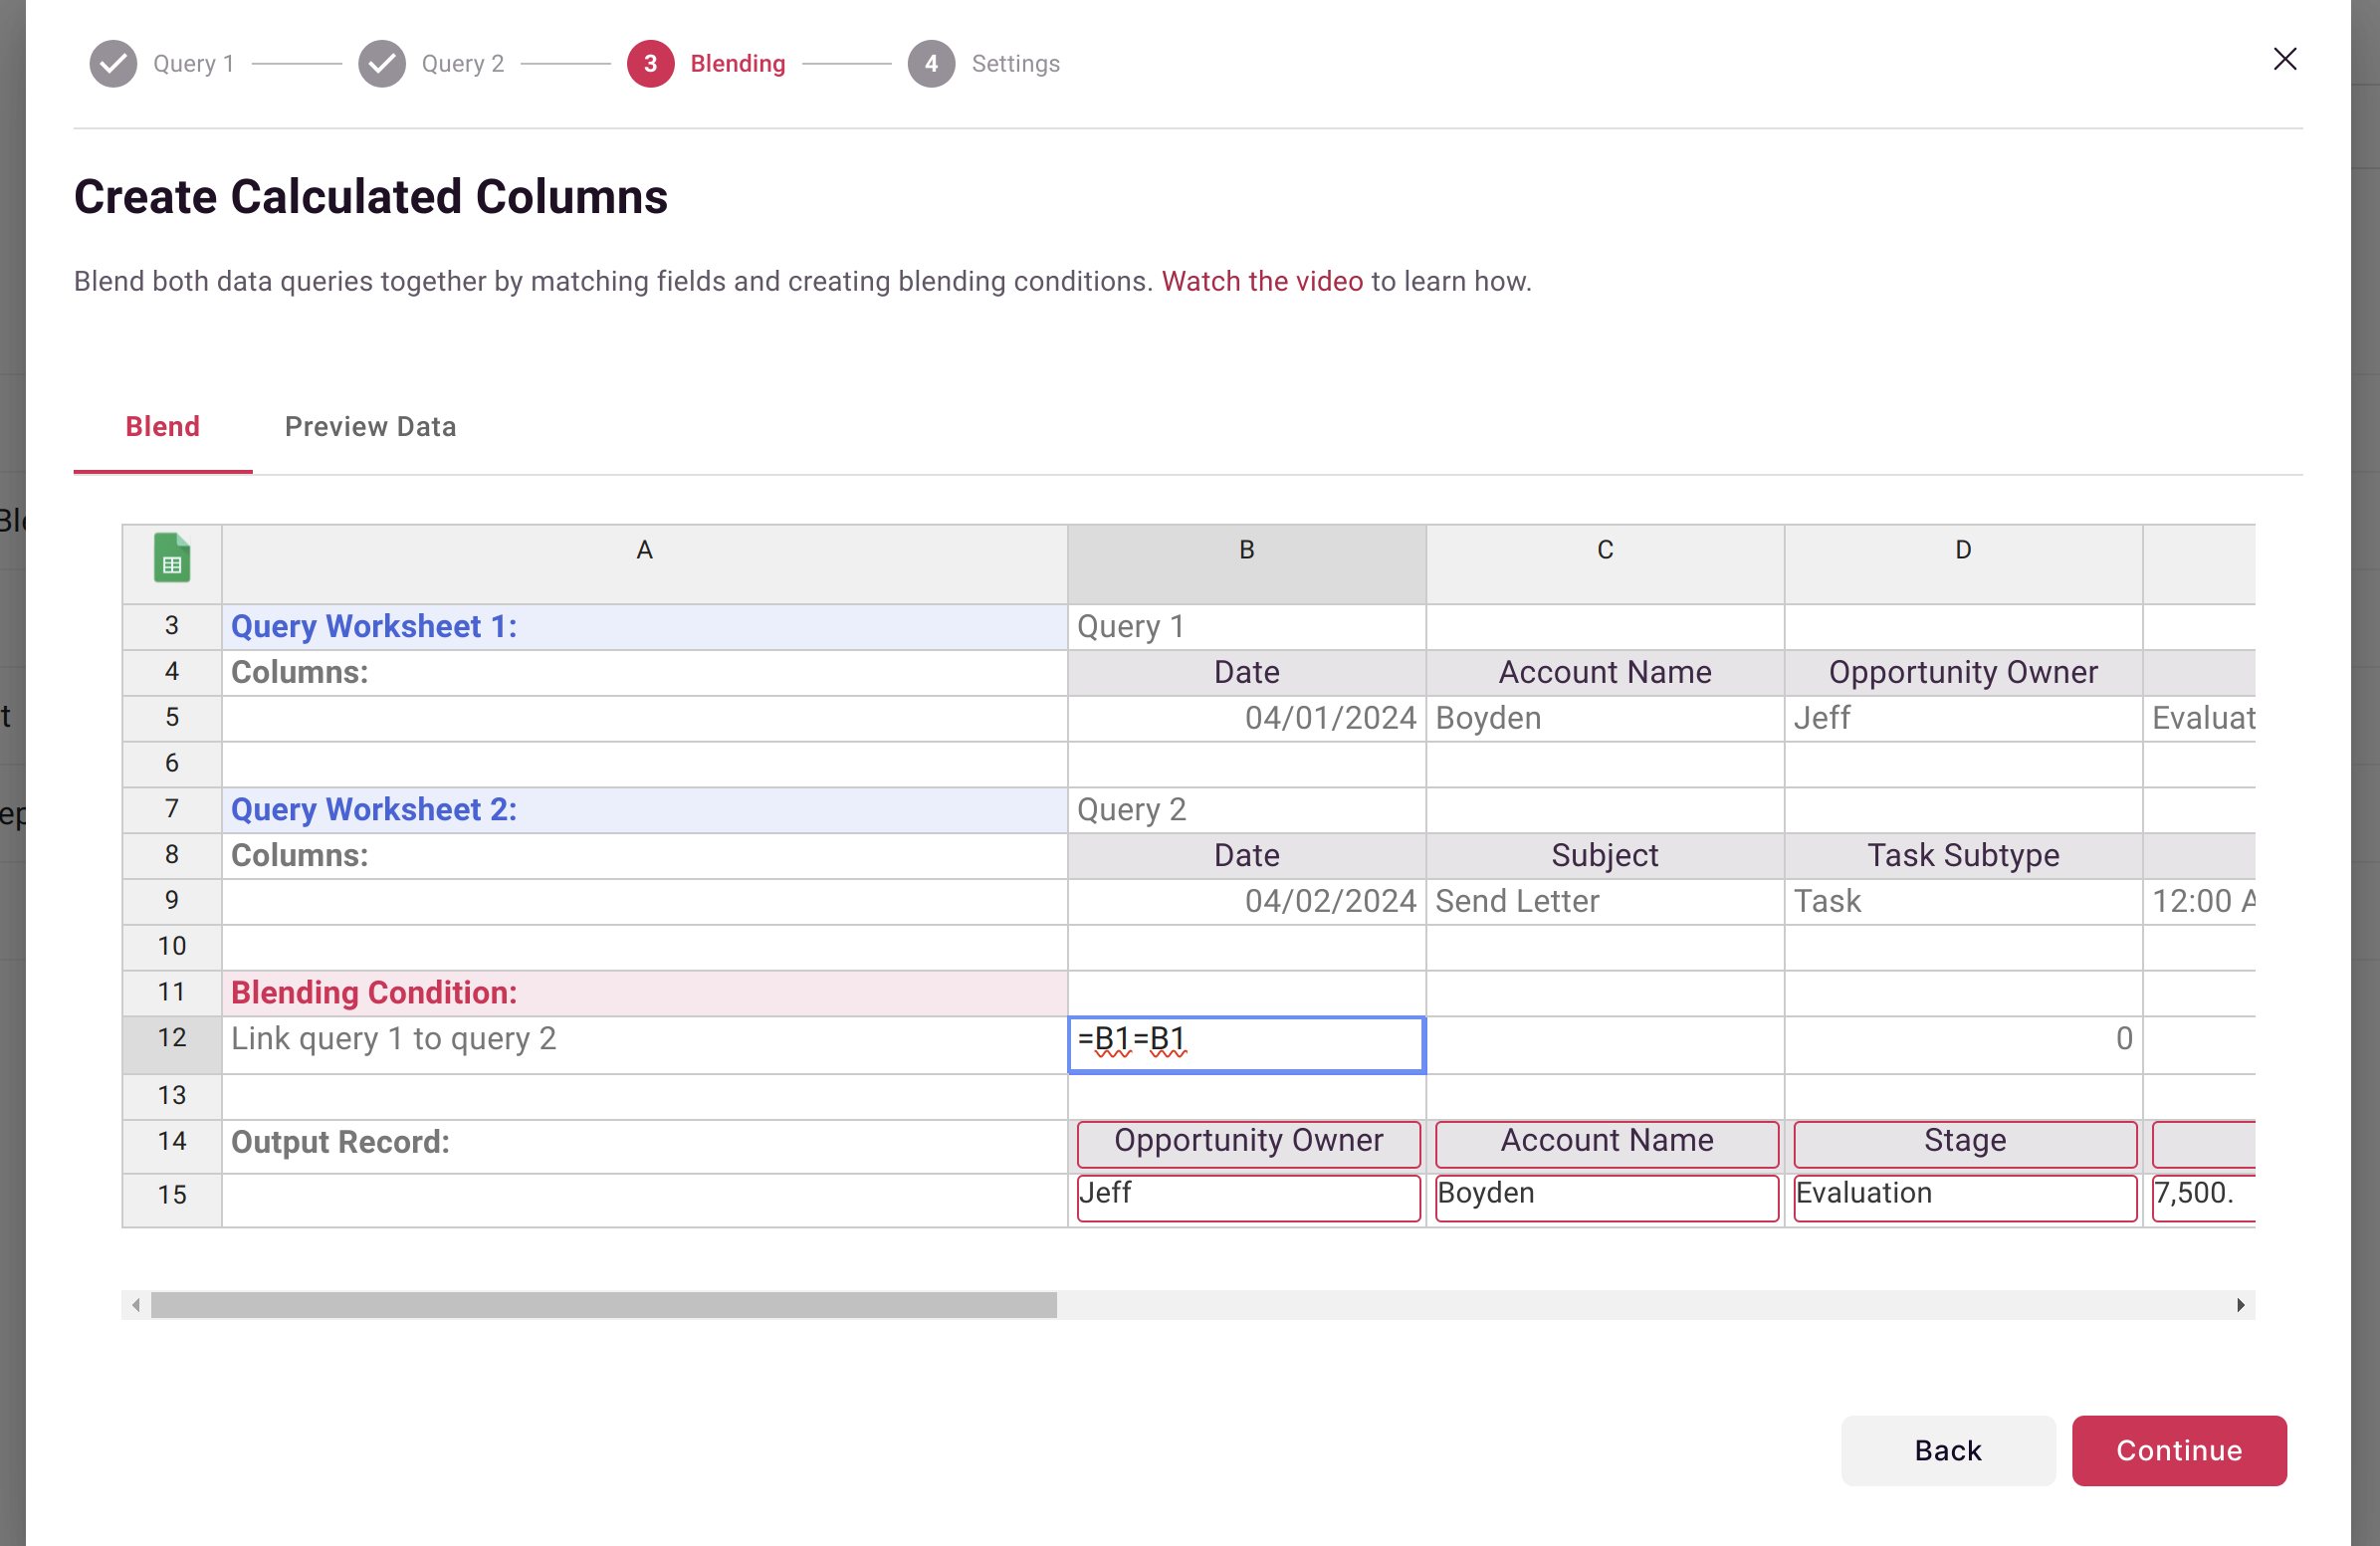
How Blend Conditions Work
Scoop evaluates every row in Query A against every row in Query B. When the condition is TRUE, an output record is created.
Common blend conditions:
| Type | Formula Example | Use Case |
|---|---|---|
| Exact match | =A2=B2 | Match on ID columns |
| Text cleanup | =TRIM(UPPER(A2))=TRIM(UPPER(B2)) | Handle formatting differences |
| Date match | =A2=B2 | Match on date columns |
| Range match | =AND(A2>=B2, A2<=C2) | Value falls in range |
Match Examples
Simple ID Match:
=CustomerID_A = CustomerID_BMatch with Cleanup:
=TRIM(UPPER(Account_Name_CRM)) = TRIM(UPPER(Company_Support))Date Period Match:
=AND(Transaction_Date >= Period_Start, Transaction_Date <= Period_End)Step 5: Define Output Formulas
Create columns for your blended output using spreadsheet formulas:
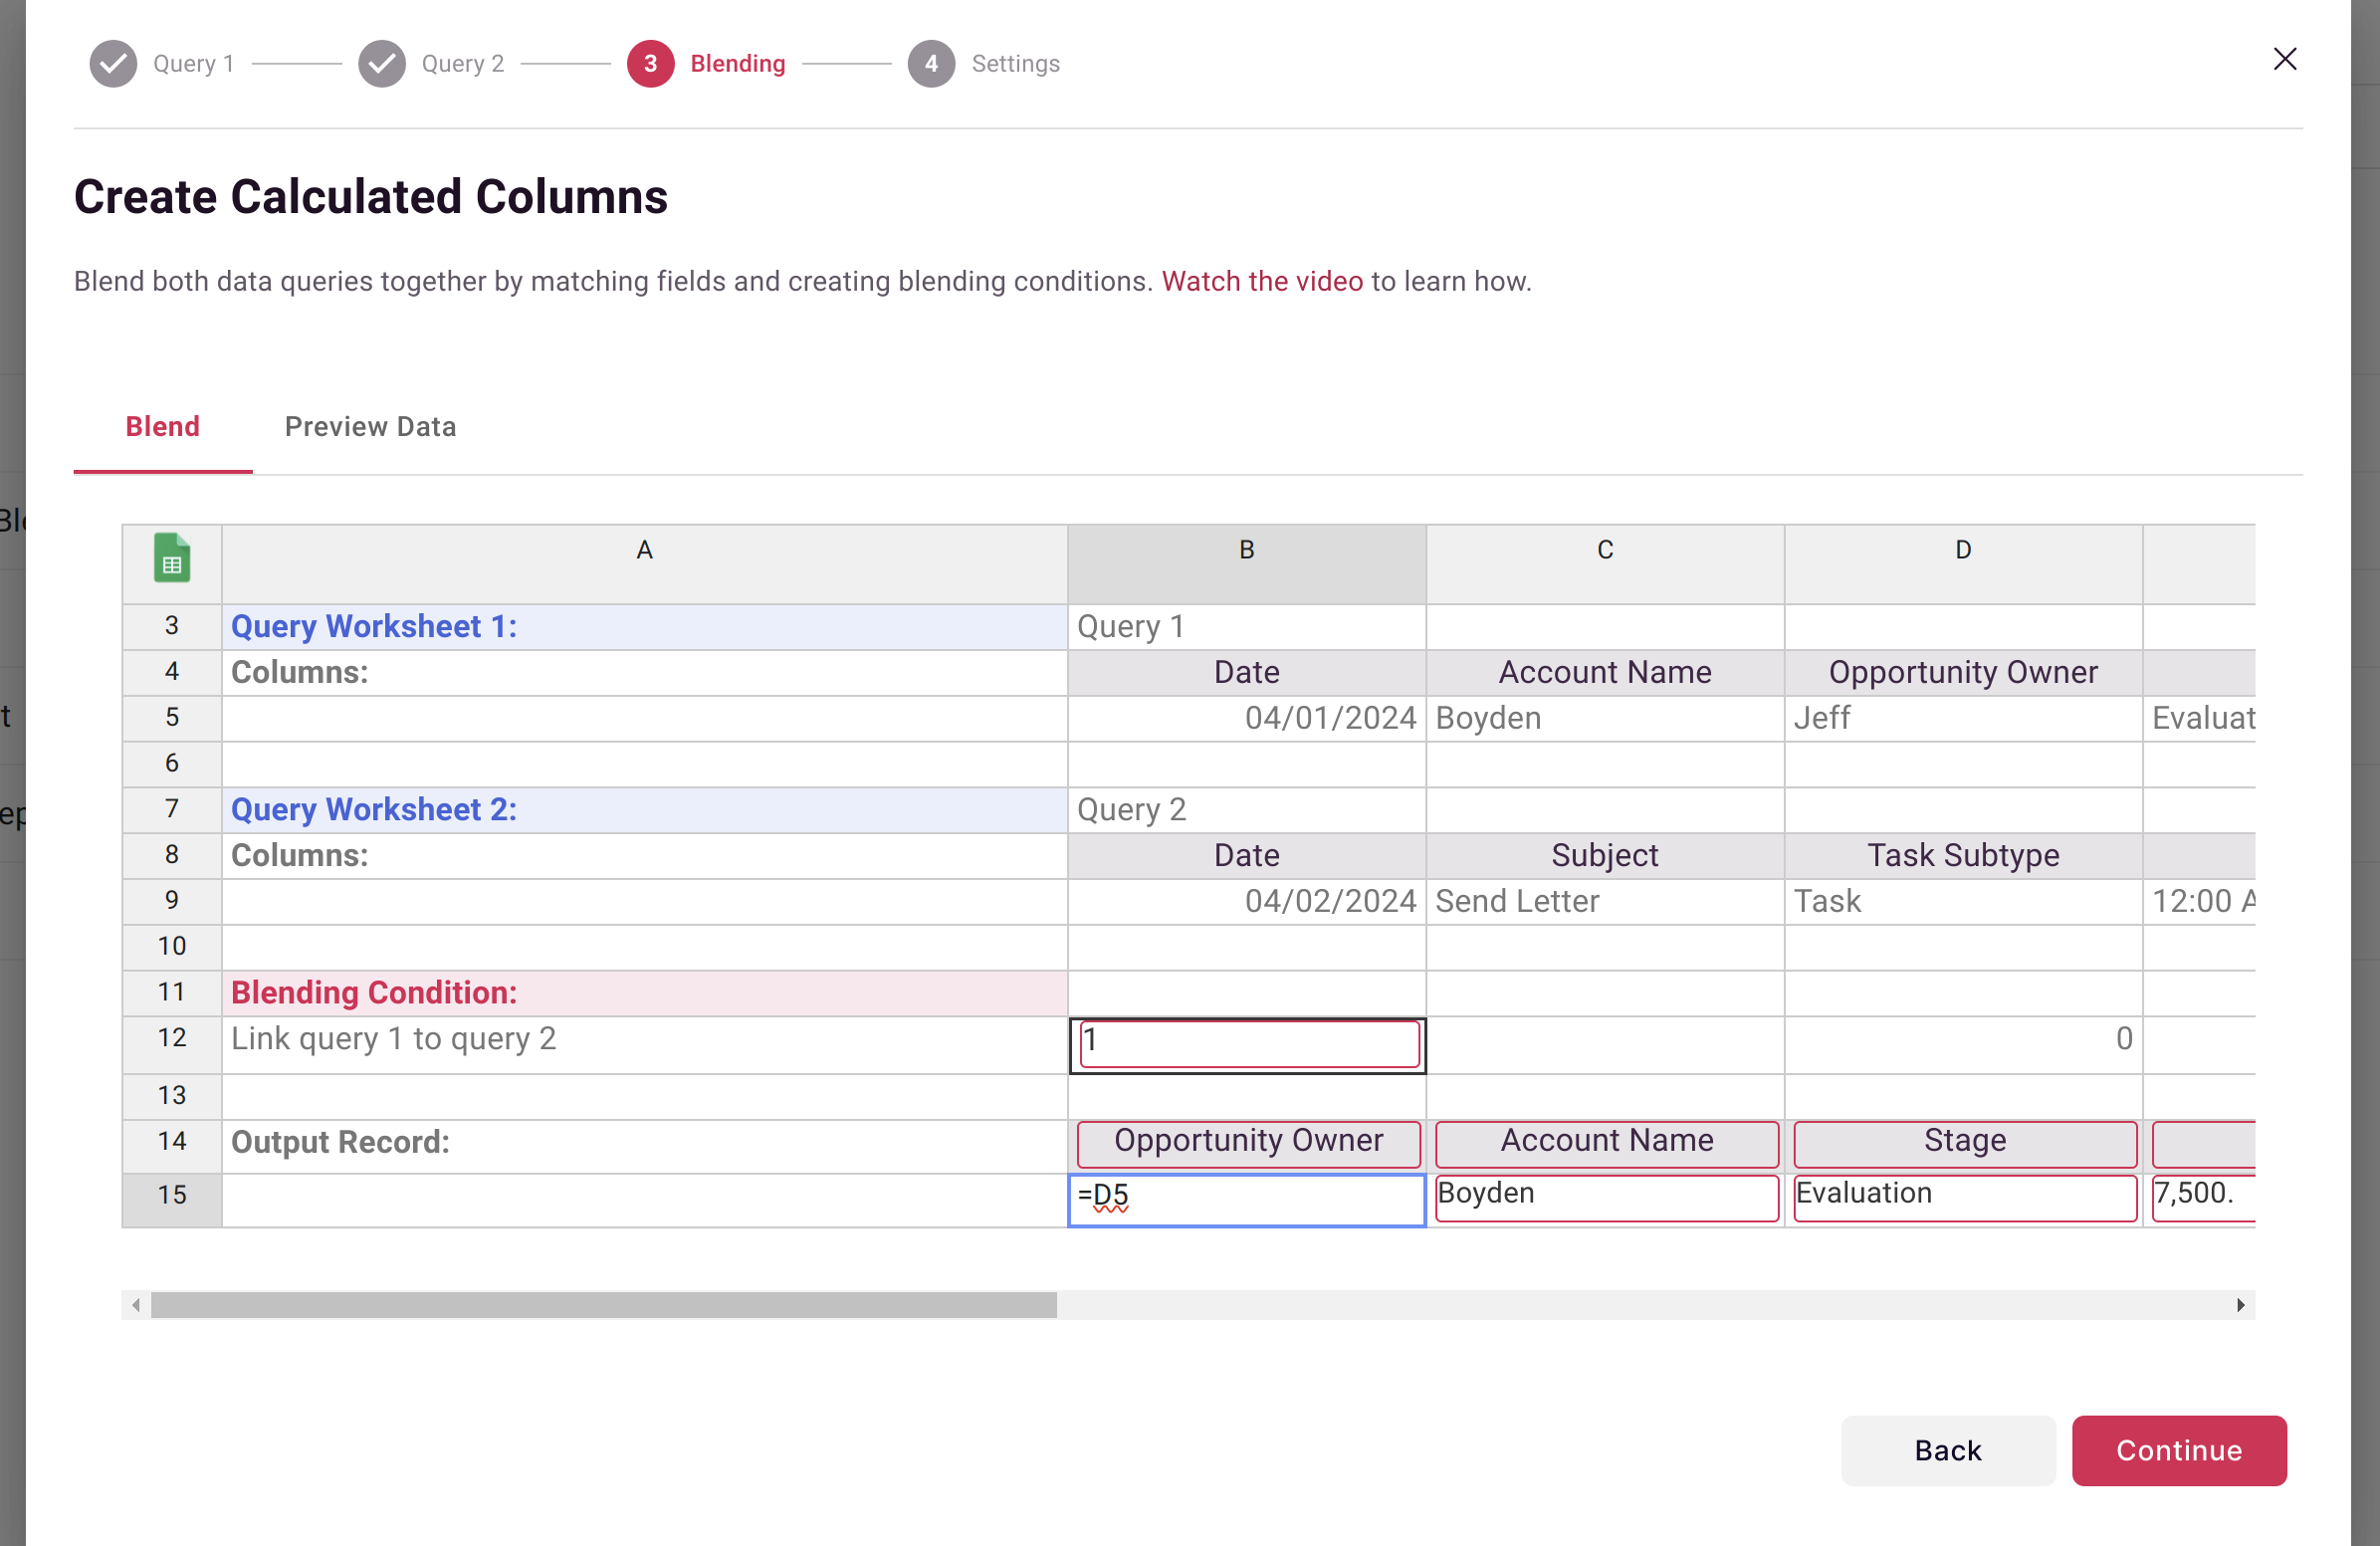
Output formula examples:
| Column Name | Formula | Description |
|---|---|---|
Customer_ID | =A2 | Carry forward from Query A |
Total_Value | =D2+E5 | Sum values from both sources |
Support_Ratio | =E5/D2 | Calculate ratio across sources |
Combined_Name | =CONCATENATE(A2," - ",B5) | Combine text fields |
Step 6: Preview Results
Click the Preview Data tab to verify your blend produces expected results:
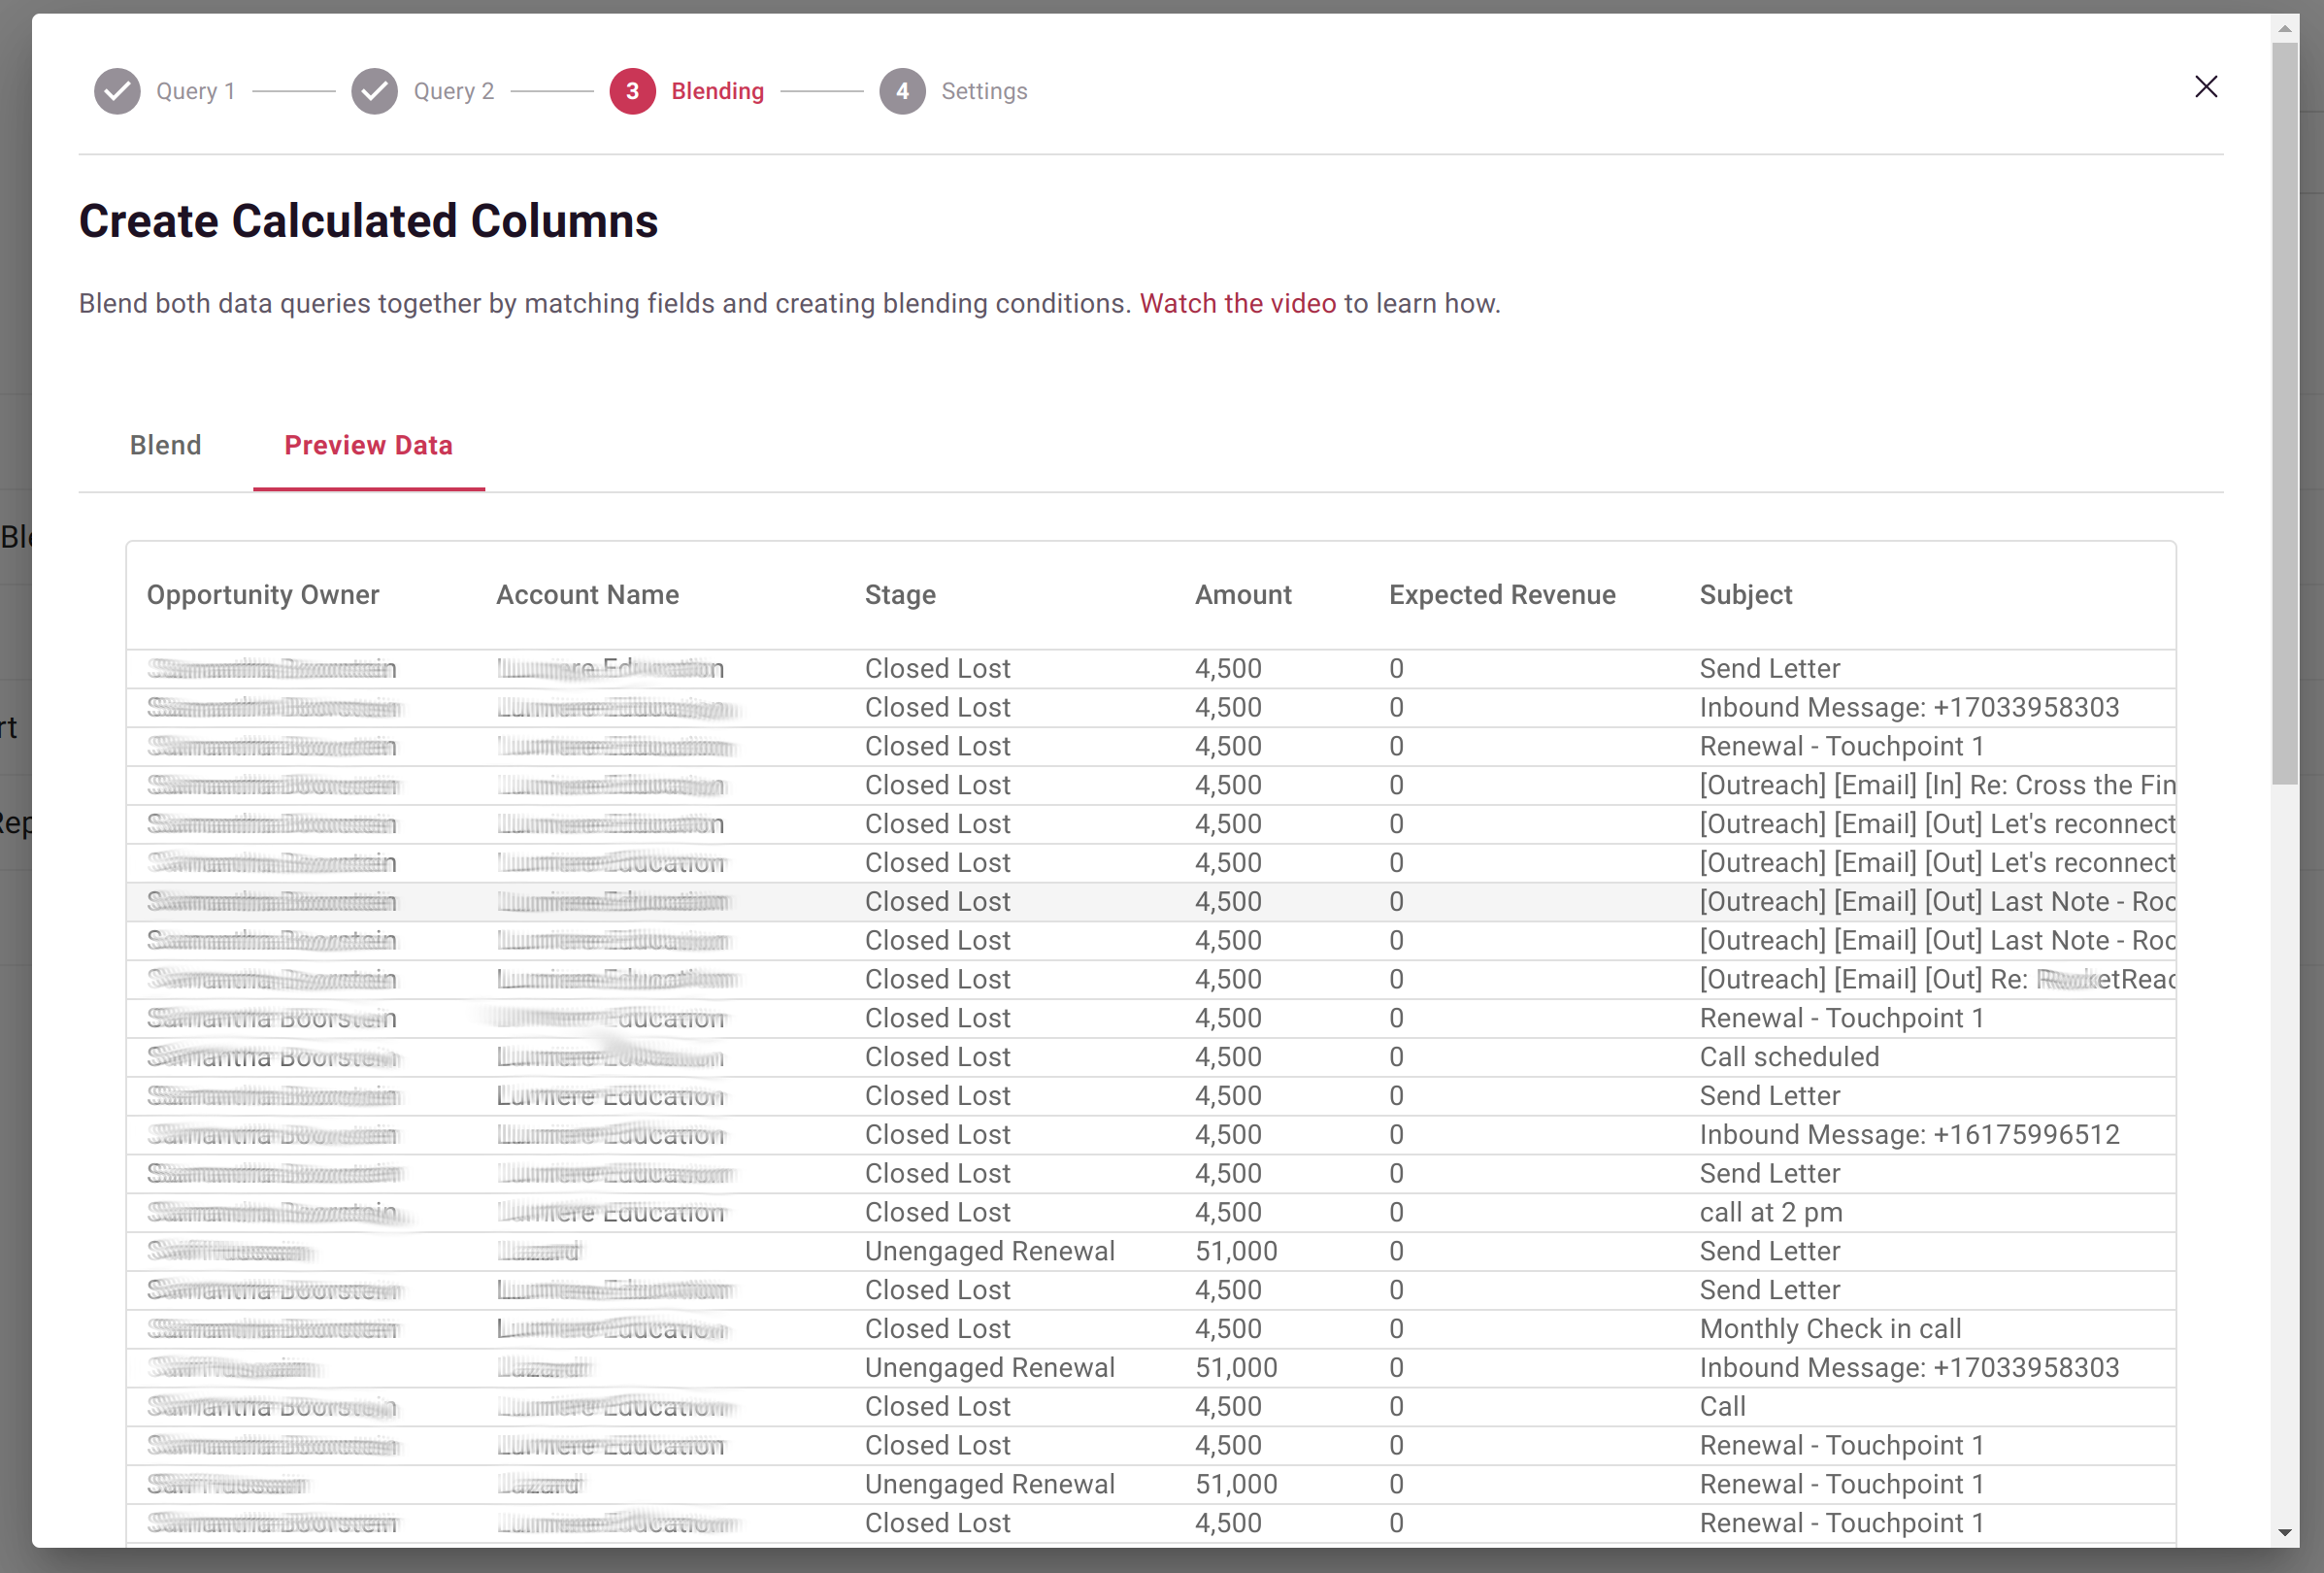
Check for:
- Expected number of output rows
- Correct values in calculated columns
- No unexpected NULLs or errors
Step 7: Configure Auto-Refresh
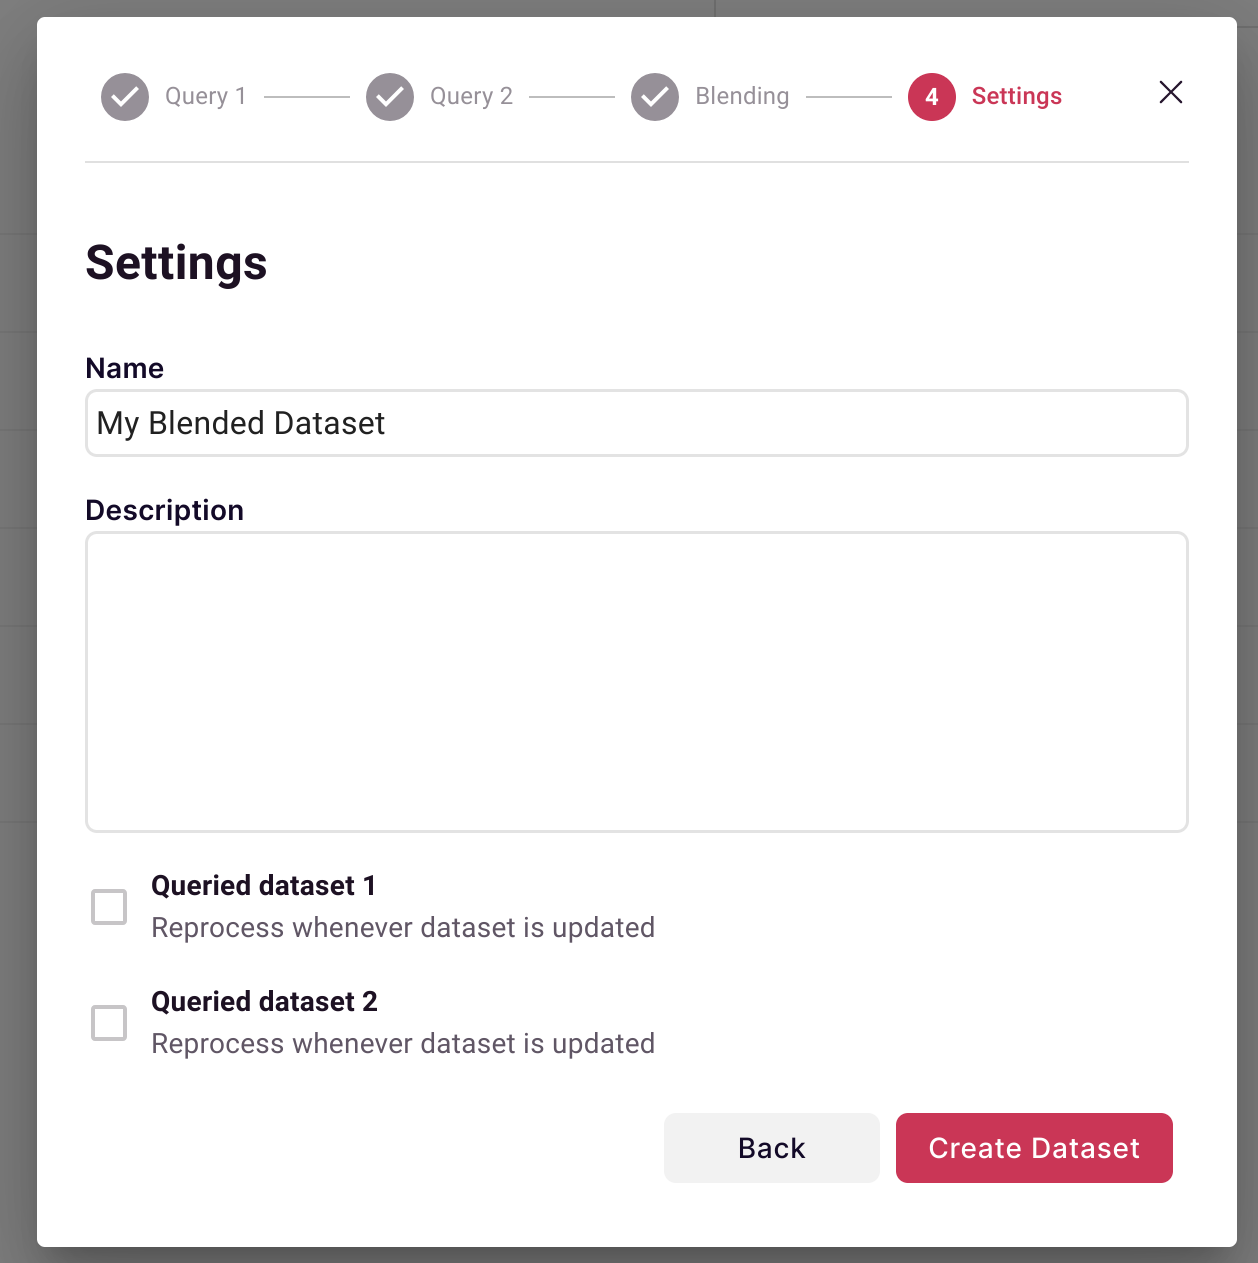
| Option | Behavior |
|---|---|
| Reprocess on Source A update | Blend refreshes when first dataset updates |
| Reprocess on Source B update | Blend refreshes when second dataset updates |
| Both checked | Blend always reflects latest data |
Advanced Blending
Using the Full Spreadsheet
Click the spreadsheet icon in the upper left to open the full Google Sheets workbook. Here you can:
- Create helper calculations
- Add lookup tables
- Build complex multi-step formulas
- Document your logic
Aggregation Before Blending
Sometimes you need to aggregate data before blending (e.g., sum transactions to monthly totals):
- In the Query configuration, enable Aggregate by selected attributes
- Select grouping columns and aggregation period
- Numbers will be summed, giving you summarized data to blend
Handling Many-to-Many Relationships
When one record in A matches multiple records in B:
Example: One customer, multiple support tickets
| Customer (A) | Tickets (B) | Output Rows |
|---|---|---|
| Acme Corp | Ticket 1 | Acme Corp + Ticket 1 |
| Acme Corp | Ticket 2 | Acme Corp + Ticket 2 |
| Acme Corp | Ticket 3 | Acme Corp + Ticket 3 |
If you want one row per customer, aggregate Query B first to get ticket counts.
Common Blend Scenarios
CRM + Support Data
Goal: Add support ticket counts to CRM accounts
Query A (CRM): Accounts with ID, Name, Revenue
Query B (Support): Tickets aggregated by Account, with Count
Blend Condition: =Account_ID_CRM = Account_ID_Support
Output: Account ID, Name, Revenue, Ticket Count, Revenue per Ticket
Budget vs. Actual
Goal: Compare planned budget to actual spending
Query A (Budget): Department, Category, Budgeted Amount
Query B (Finance): Department, Category, Actual Spend
Blend Condition: =AND(Dept_A=Dept_B, Cat_A=Cat_B)
Output: Department, Category, Budget, Actual, Variance
Product Usage + Revenue
Goal: Calculate revenue per active user
Query A (Product): Account ID, Active Users, Features Used
Query B (Billing): Account ID, Monthly Revenue
Blend Condition: =Account_A = Account_B
Output: Account, Users, Revenue, Revenue per User
Troubleshooting
No Output Rows
Symptom: Blend produces zero results.
Causes:
- Blend condition never evaluates to TRUE
- Key columns have different formats (case, spacing, data type)
- Filters too restrictive in source queries
Solutions:
- Preview each source query separately
- Check sample key values match exactly
- Use TRIM/UPPER to normalize text comparisons
Too Many Output Rows
Symptom: Blend produces far more rows than expected.
Causes:
- Many-to-many relationship without aggregation
- Blend condition too loose
Solutions:
- Aggregate one or both sources
- Add additional match criteria to blend condition
Missing Data
Symptom: Some expected matches are missing.
Causes:
- Key values don't match (typos, formatting)
- Date ranges don't overlap
- Filters excluding needed records
Solutions:
- Check source data for the missing records
- Verify blend condition handles edge cases
- Adjust filters to include more data
Performance Issues
Symptom: Blend takes very long to process.
Causes:
- Large datasets without aggregation
- Complex blend conditions
Solutions:
- Aggregate data before blending
- Filter to necessary time periods
- Simplify blend conditions
Best Practices
Design for Maintainability
- Document blend logic in the spreadsheet
- Use clear, consistent naming
- Test with sample data before full processing
Optimize Performance
- Aggregate when possible to reduce row counts
- Filter source queries to necessary data
- Avoid unnecessary columns in output
Ensure Data Quality
- Validate key columns match formats
- Check for duplicates in source data
- Preview results before deploying
Related Topics
- Dataset Queries - Configure source queries
- Adding Calculated Columns - Formula syntax
- Reprocessing Data - Manual refresh
- CRM Writeback - Push blended data back to CRM
Updated 8 months ago