Scoop offers a rich library of chart types to visualize your data effectively. Choose the right chart type to communicate your insights clearly—whether you're showing trends, comparing categories, or displaying part-to-whole relationships.
Chart Type Best For Data Requirements Column Time trends, category comparison 1 metric, optional grouping Line Trends over time 1+ metrics, time dimension Area Cumulative trends, magnitude 1+ metrics, time dimension Bar Category comparison, rankings 1 metric, 1 dimension Pie Part-to-whole (few categories) 1 metric, 1 dimension Donut Part-to-whole with center stat 1 metric, 1 dimension Pictorial Creative branded visuals 1 metric, custom images Gauge Progress toward goal 1 metric, target value Radial Cyclical or comparative data Multiple metrics
Your Question Recommended Chart Why "How has this changed over time?" Line, Column, Area Time axis shows progression "How do these categories compare?" Column, Bar Easy visual comparison "What's the breakdown?" Pie, Donut Shows proportions clearly "Are we on track?" Gauge Visual progress indicator "What's the ranking?" Bar (horizontal) Easy to read top-to-bottom "How does this relate to total?" Stacked Area, Donut Shows part-to-whole
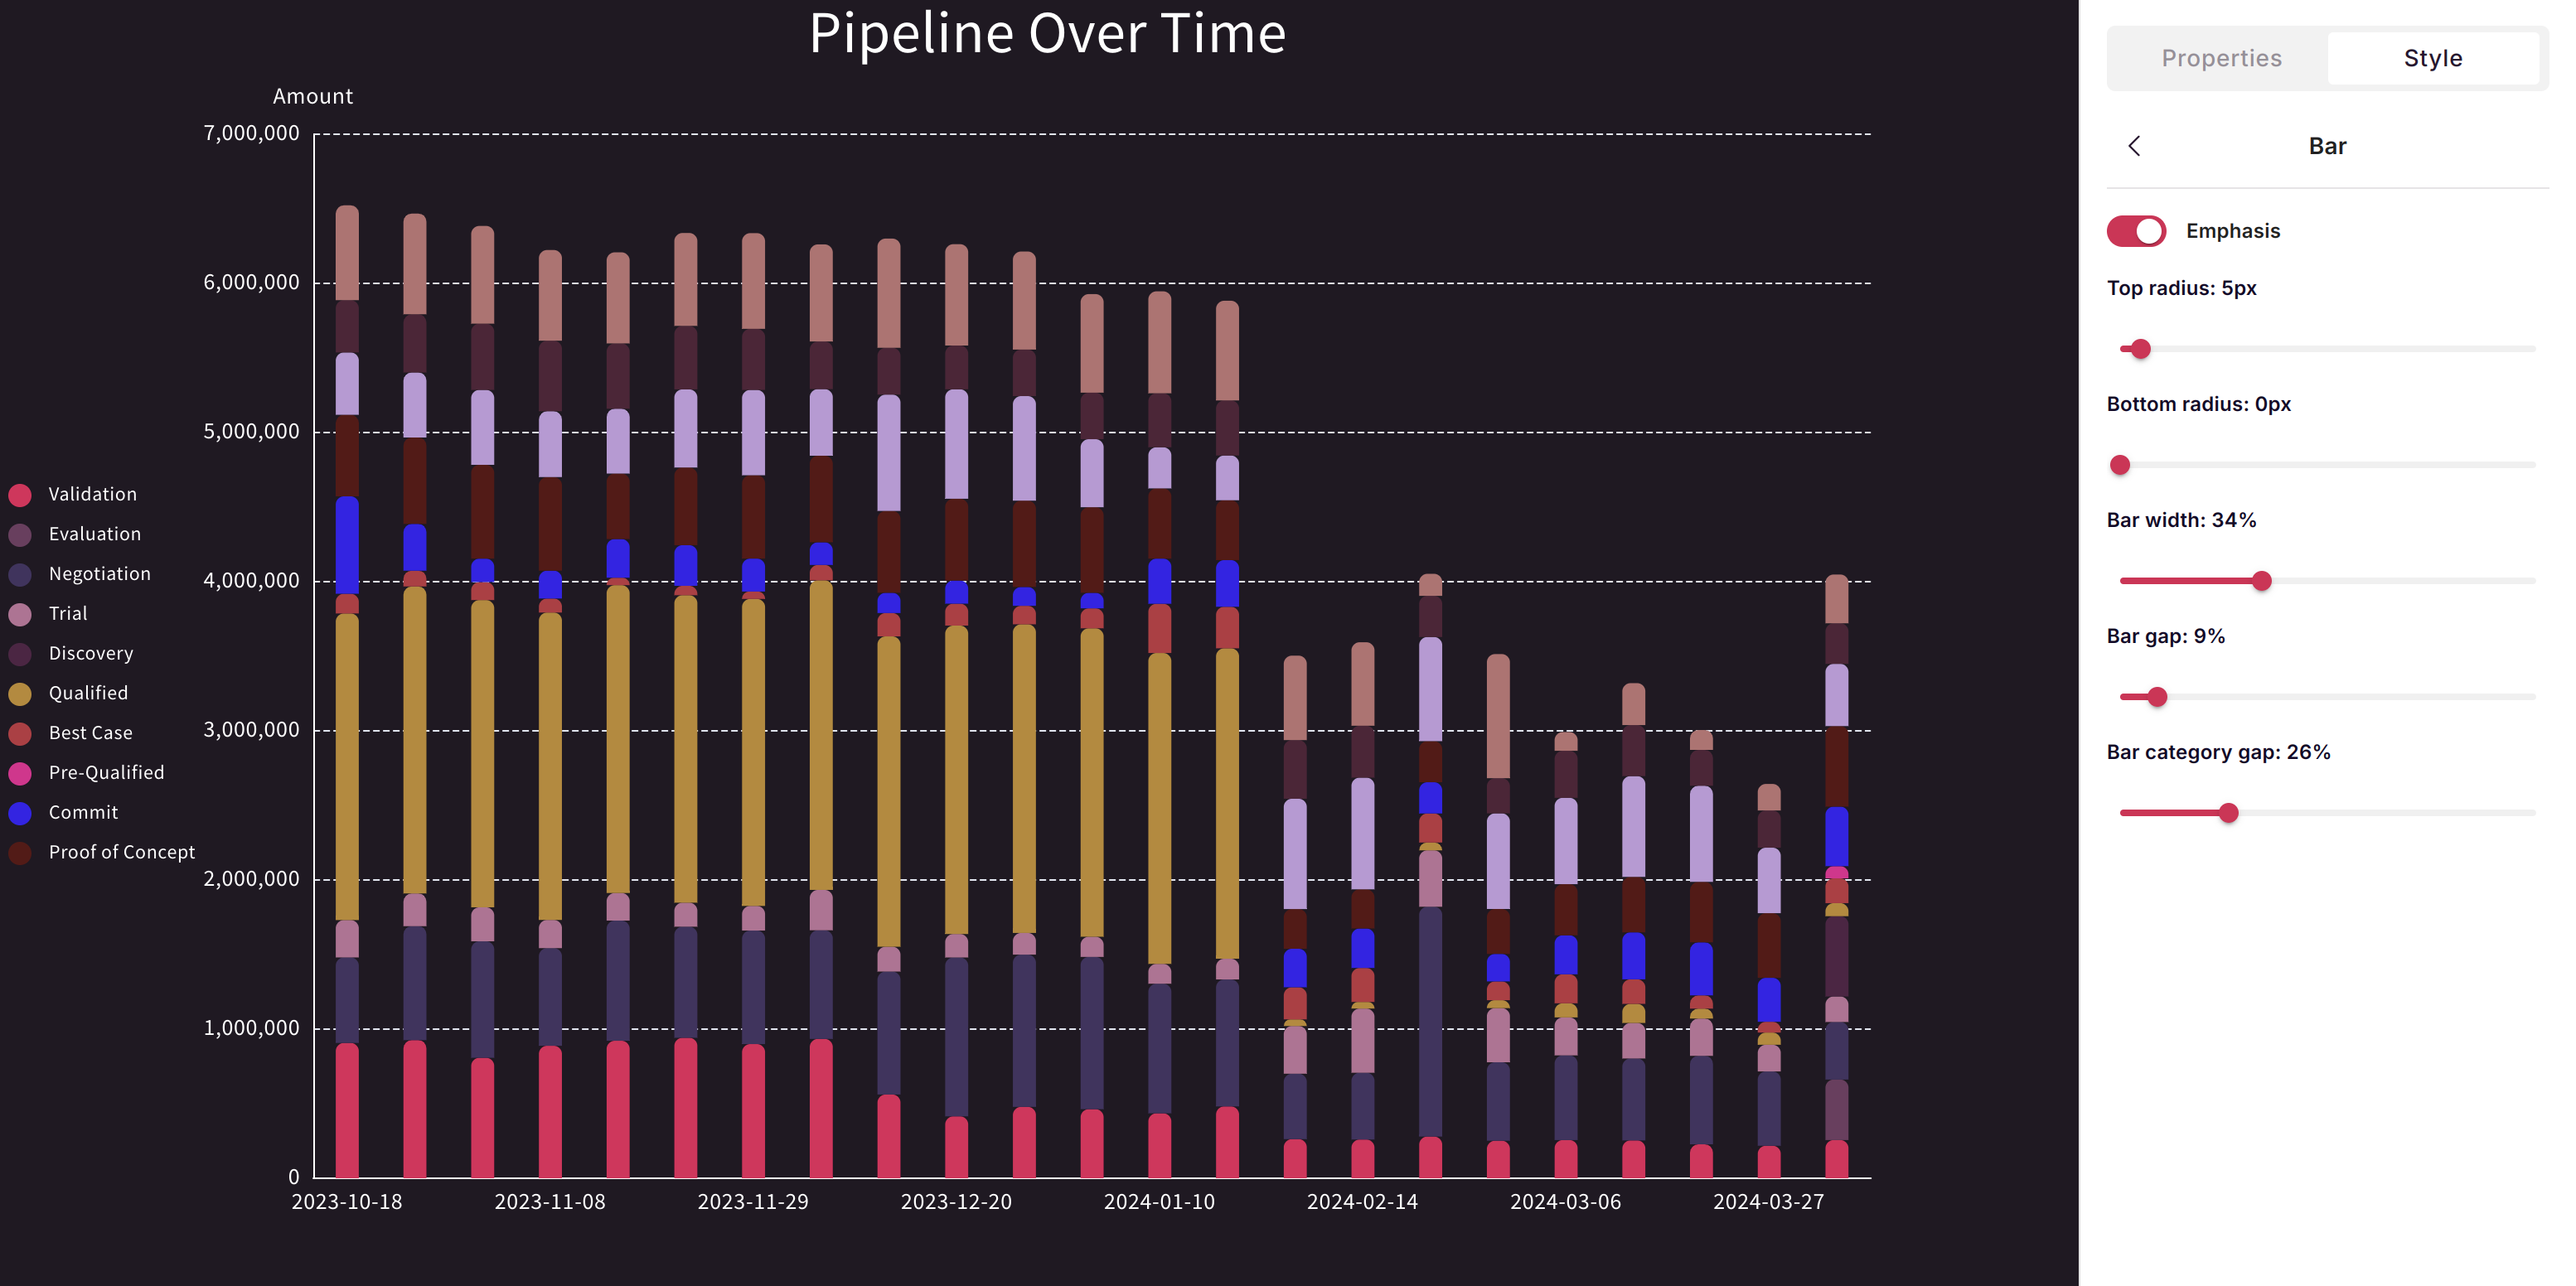
Column charts are the workhorse of data visualization—perfect for comparing values across categories or tracking metrics over time.
VIDEO
Feature Description Categories Group by any dimension Category groups Stack or cluster by second dimension Formatting Colors, labels, gridlines, axis customization Sorting By value, alphabetical, or custom order
Scenario Example Time-based comparisons Monthly revenue Category comparisons Sales by region Grouped comparisons Revenue by product, stacked by region Before/after analysis Q1 vs Q2 performance
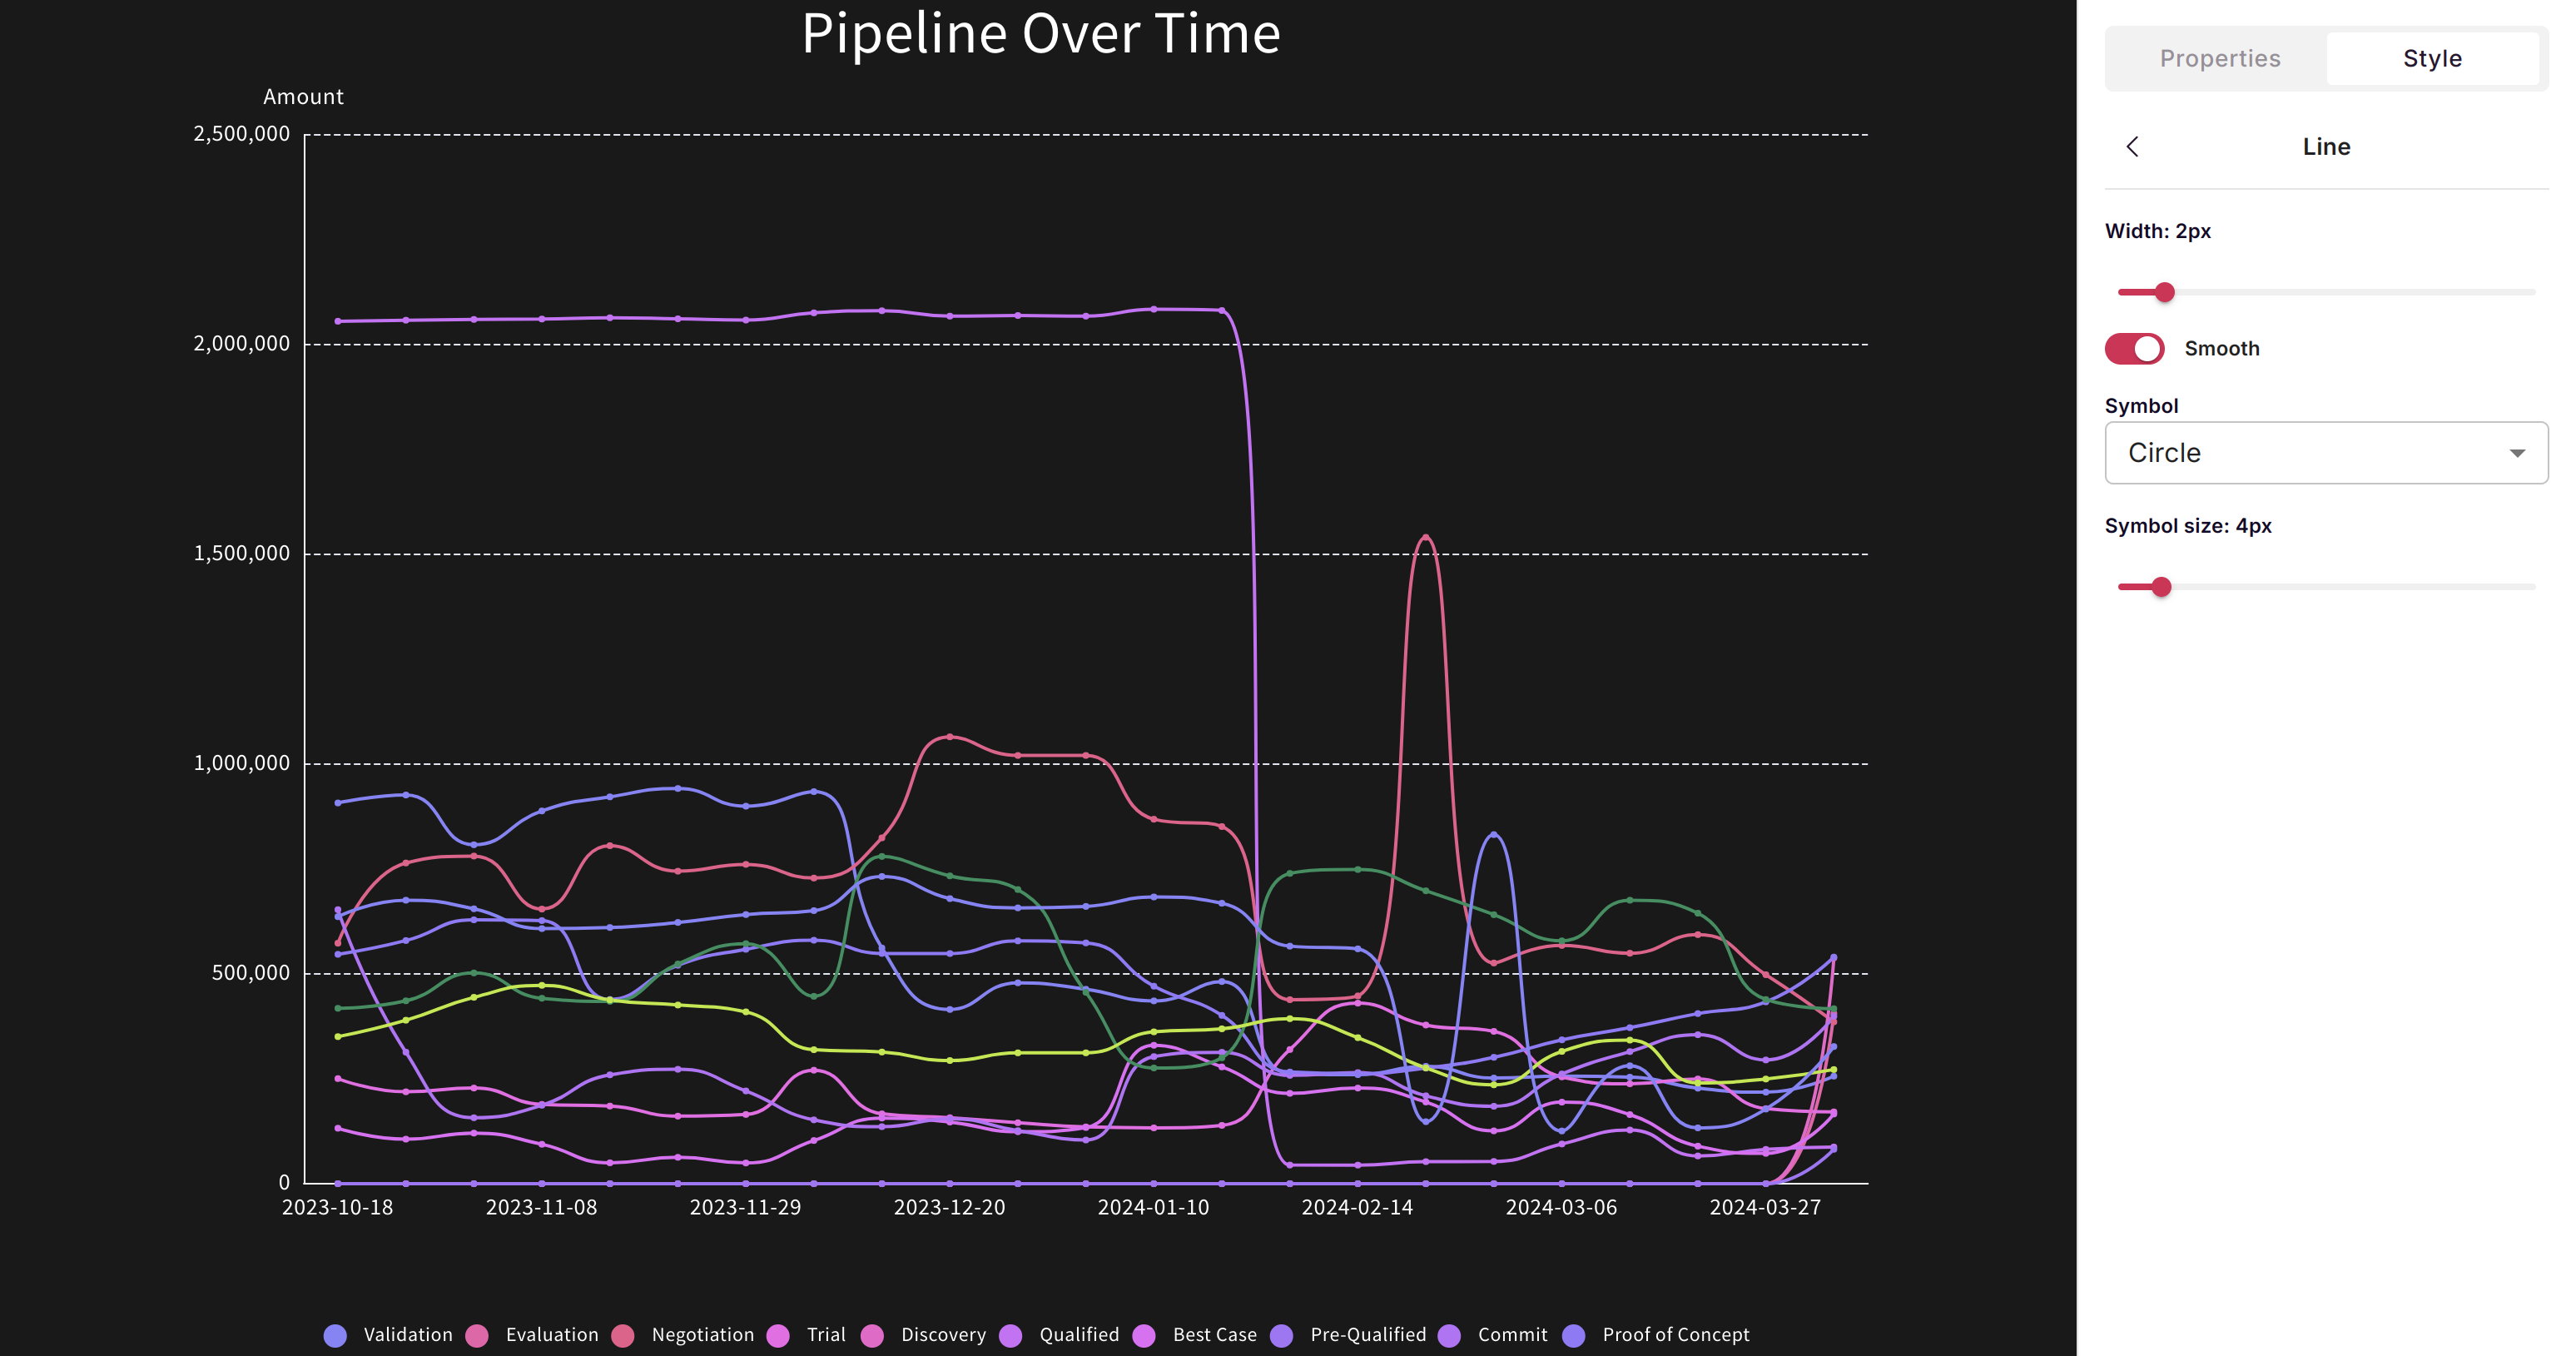
Line charts excel at showing trends and continuous data over time. Multiple lines allow easy comparison of different series.
Feature Description Multiple series Compare several metrics simultaneously Smooth/stepped Choose line interpolation style Markers Show data points on lines Dual axis Display metrics with different scales
Scenario Example Trend analysis Revenue trend over 12 months Multiple metric comparison Revenue vs. costs over time Rate of change Growth rate visualization Forecasting Actuals vs. projected
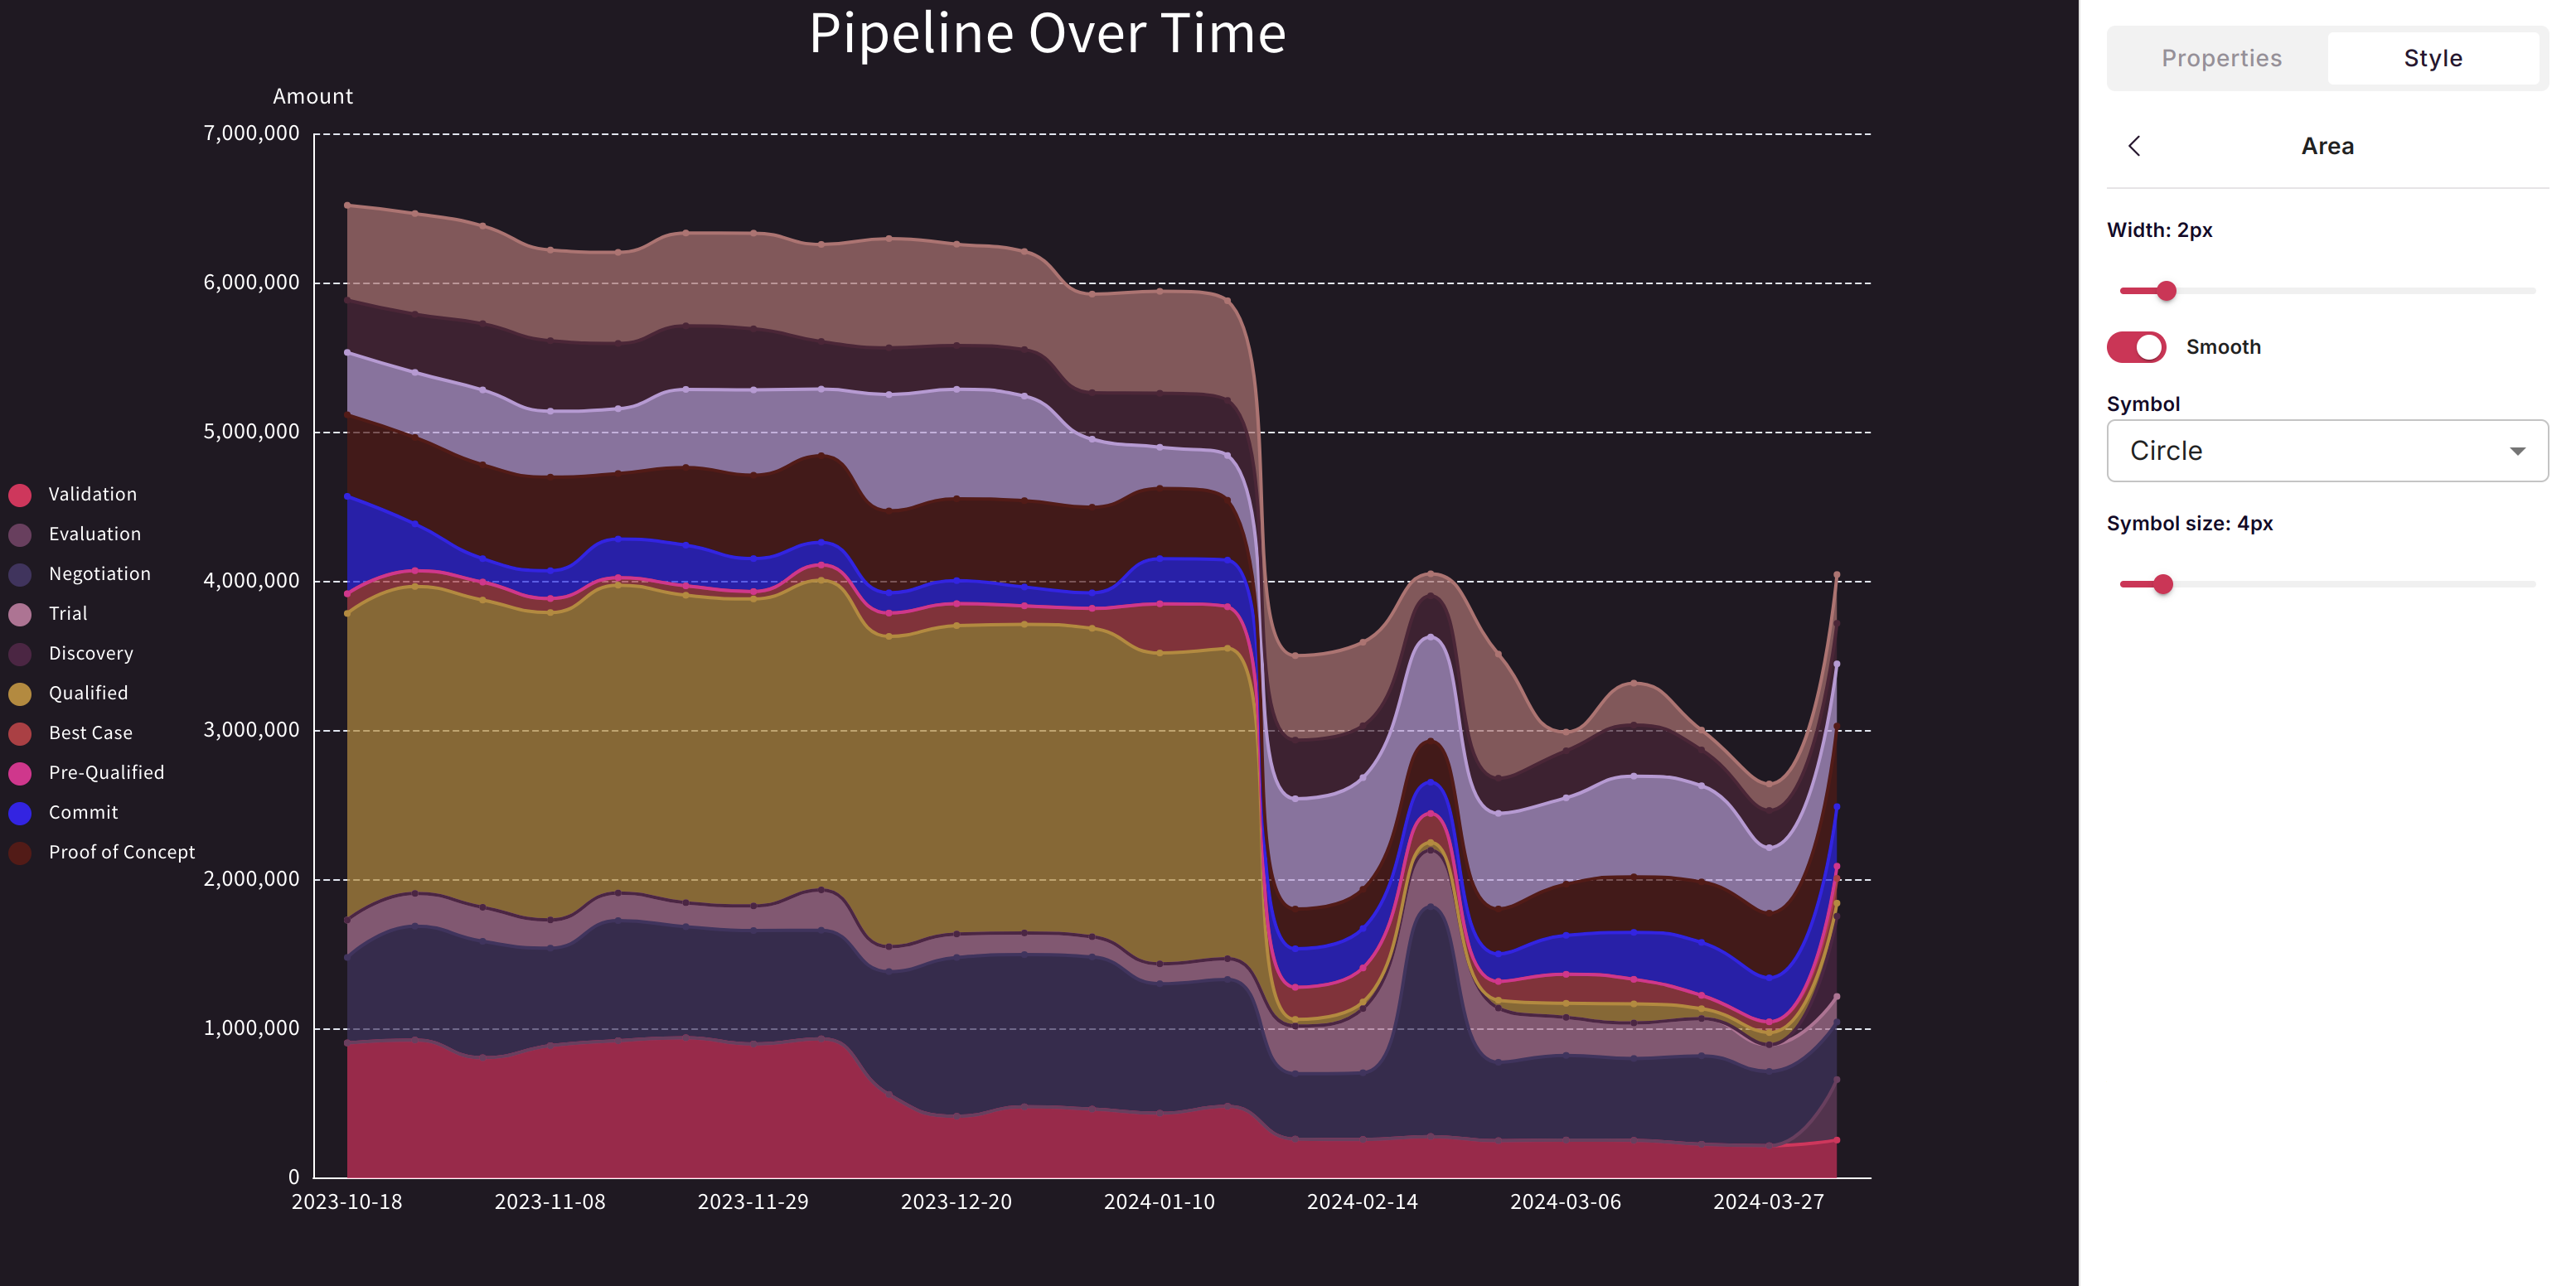
Area charts combine the trend-showing power of line charts with filled regions that emphasize magnitude and cumulative values.
Variant Best For Simple area Single metric magnitude over time Stacked area Part-to-whole over time 100% stacked Proportion changes over time
Scenario Example Cumulative totals YTD revenue accumulation Composition over time Pipeline by stage over months Volume emphasis Order volume trends Stacked comparisons Revenue by product line
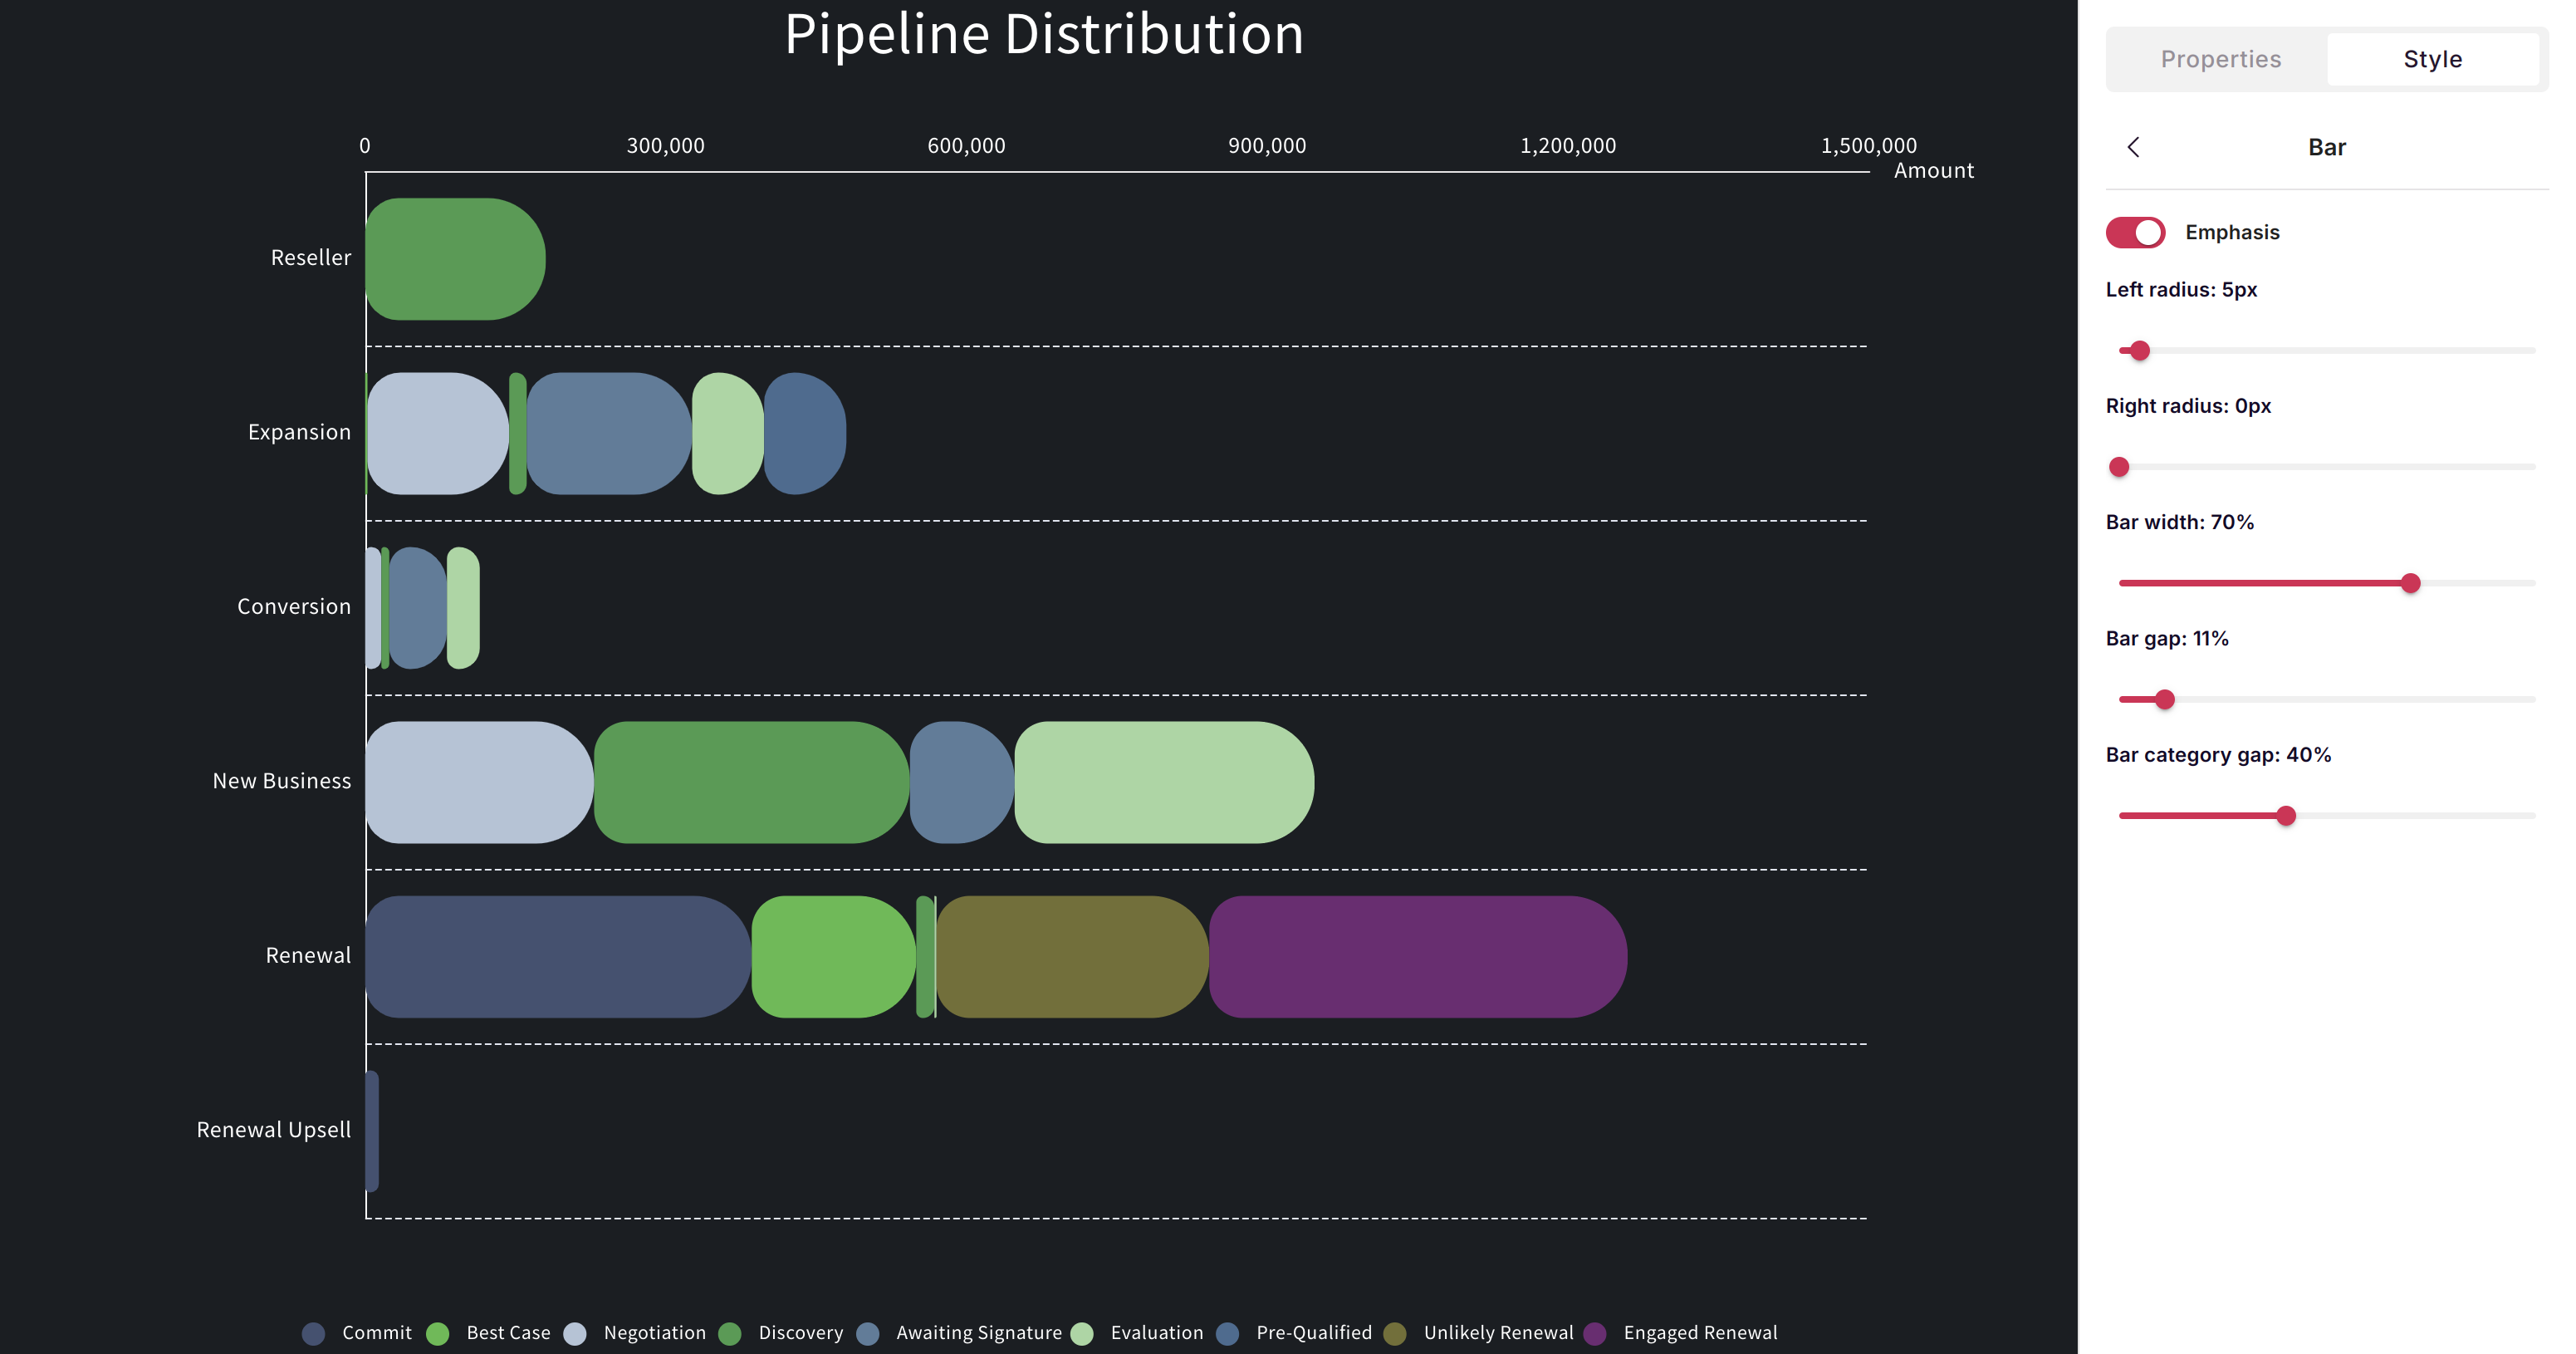
Bar charts display data horizontally—ideal when category names are long or when you have many categories to compare.
Feature Description Horizontal layout Easy to read category labels Long labels Accommodates lengthy text Many categories Scrollable for 10+ items Sorting Automatic ranking by value
Scenario Example Rankings Top 10 products by sales Long category names Sales by full product name Survey results Response frequency by answer Leaderboards Rep performance ranking
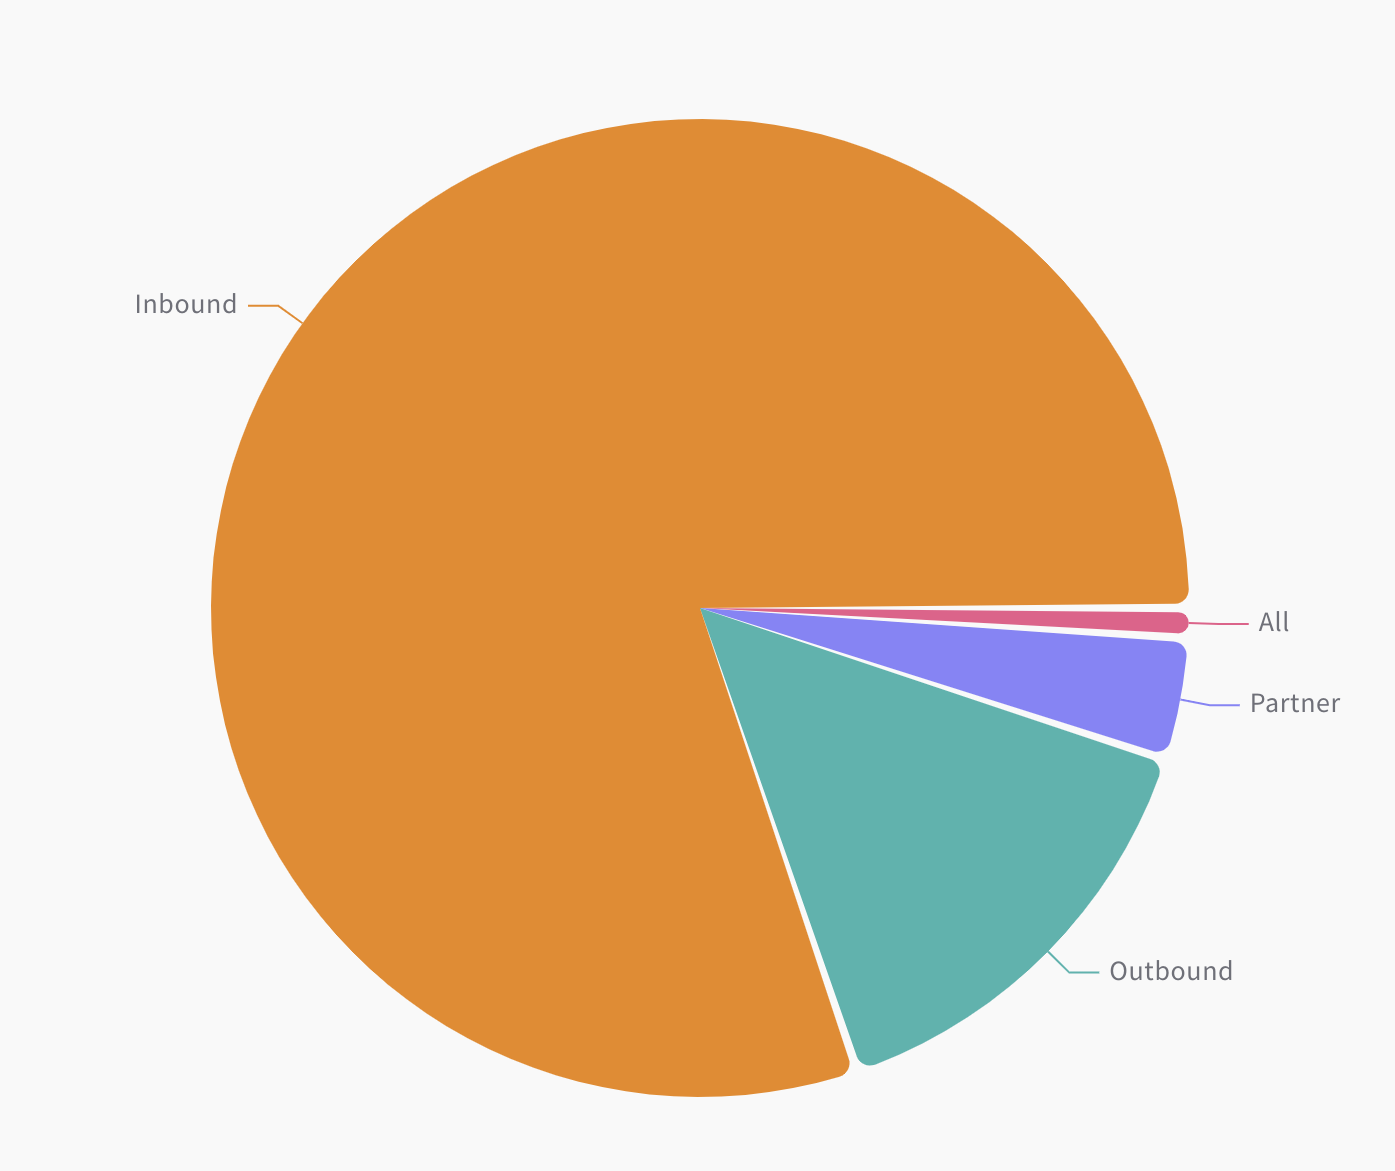
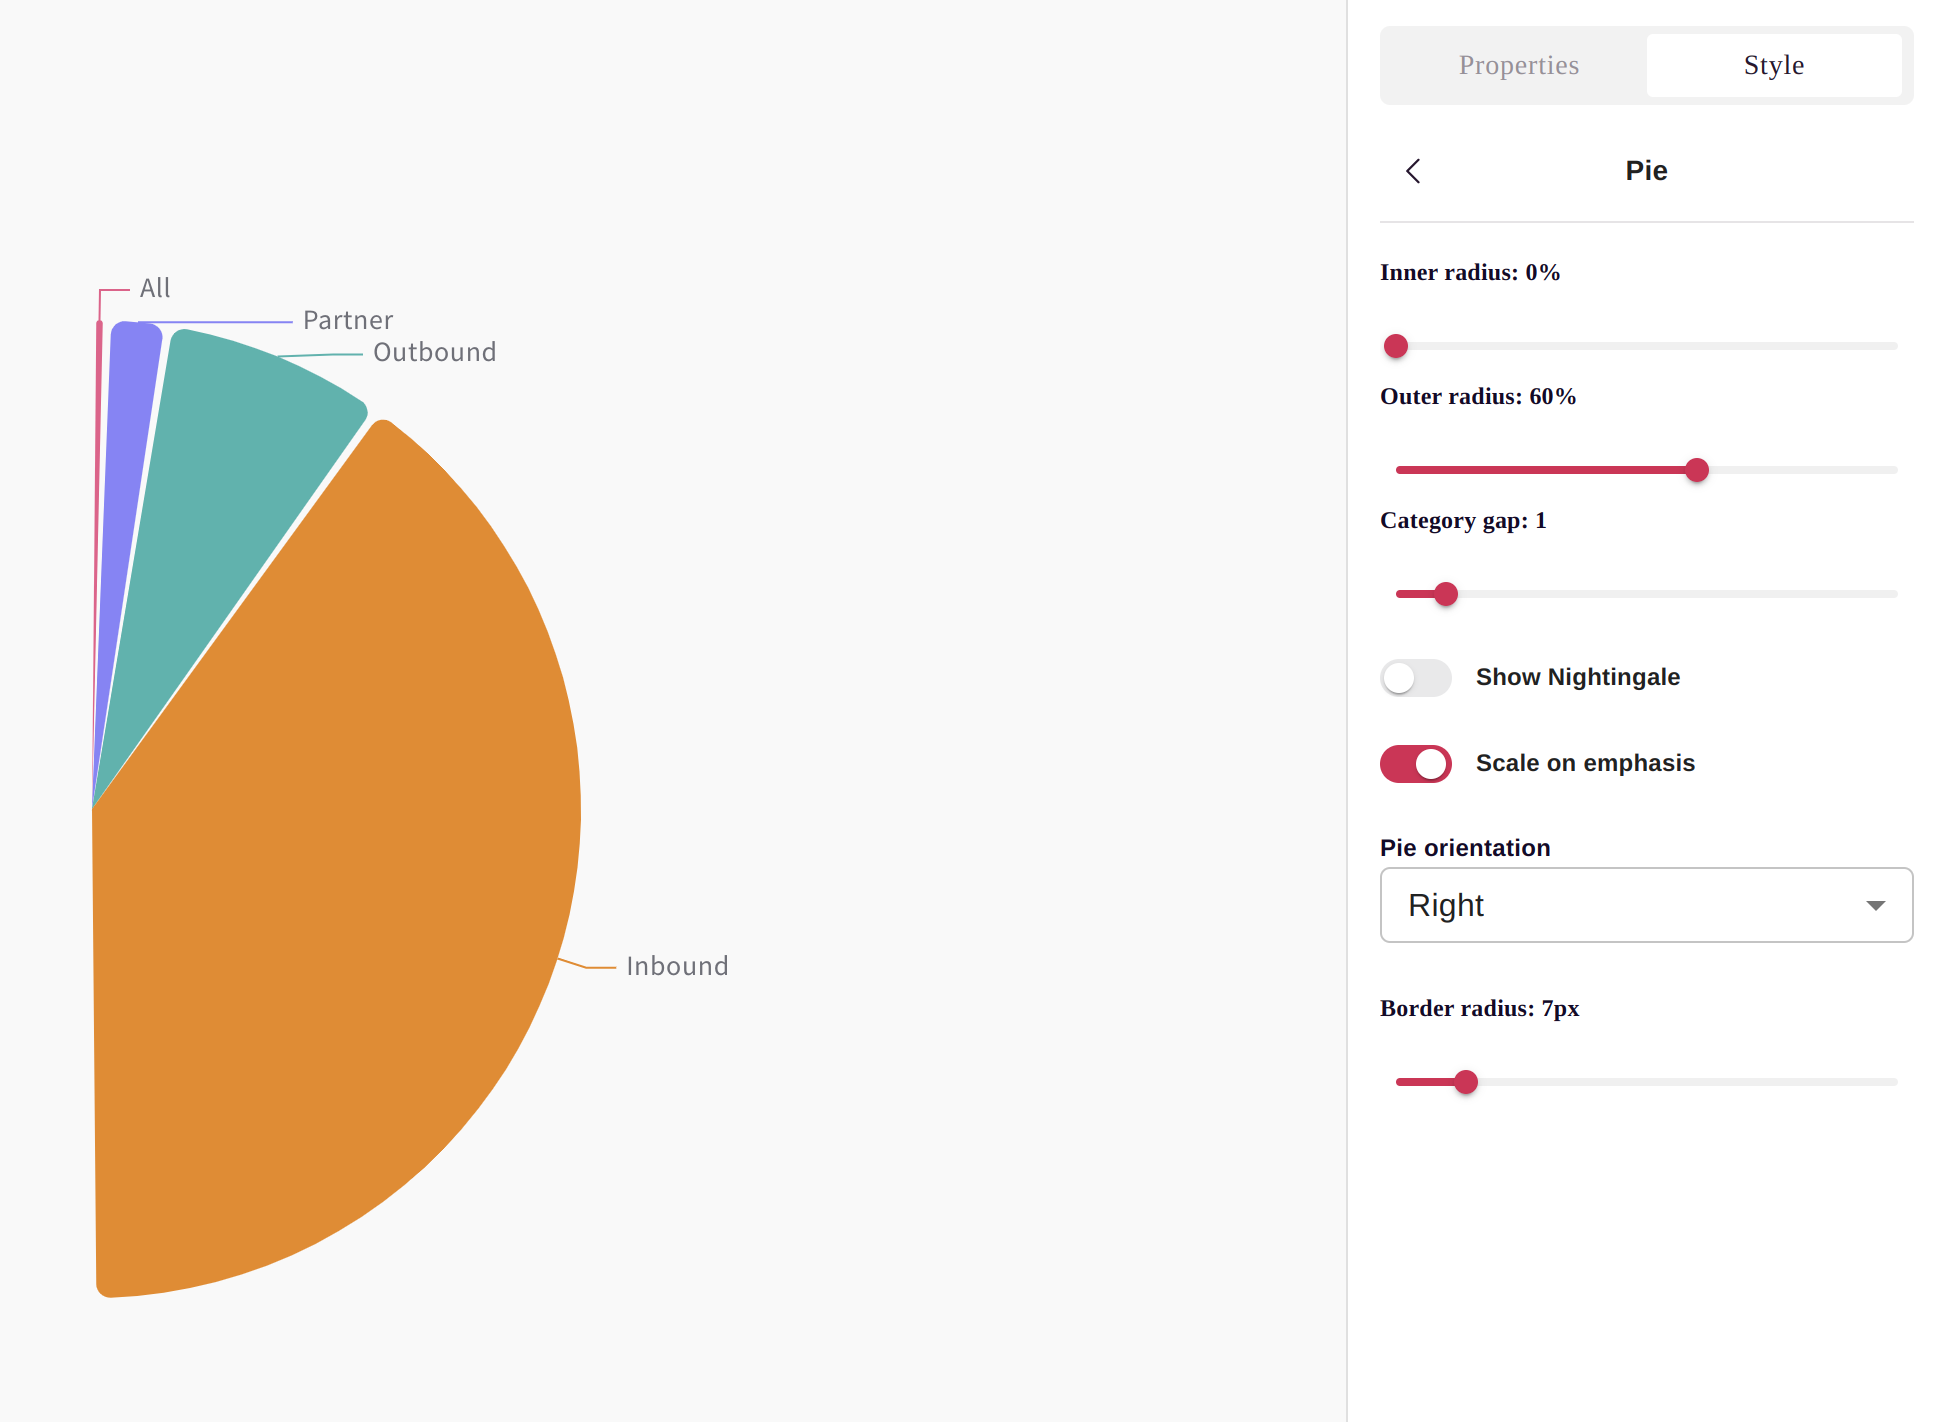
Pie charts show how parts contribute to a whole. Best used with 5 or fewer categories for readability.
Regular Pie Half Pie
Feature Description Regular pie Full circle, classic presentation Half pie Semi-circle, space-efficient Labels Value, percentage, or both Exploded slices Emphasize specific segments
Scenario Example Market share Revenue by competitor Budget allocation Spend by category Survey responses Distribution of answers Simple breakdowns Deals by stage (3-5 stages)
Tip: If you have more than 5-6 categories, consider a bar chart or donut with "Other" grouping for better readability.
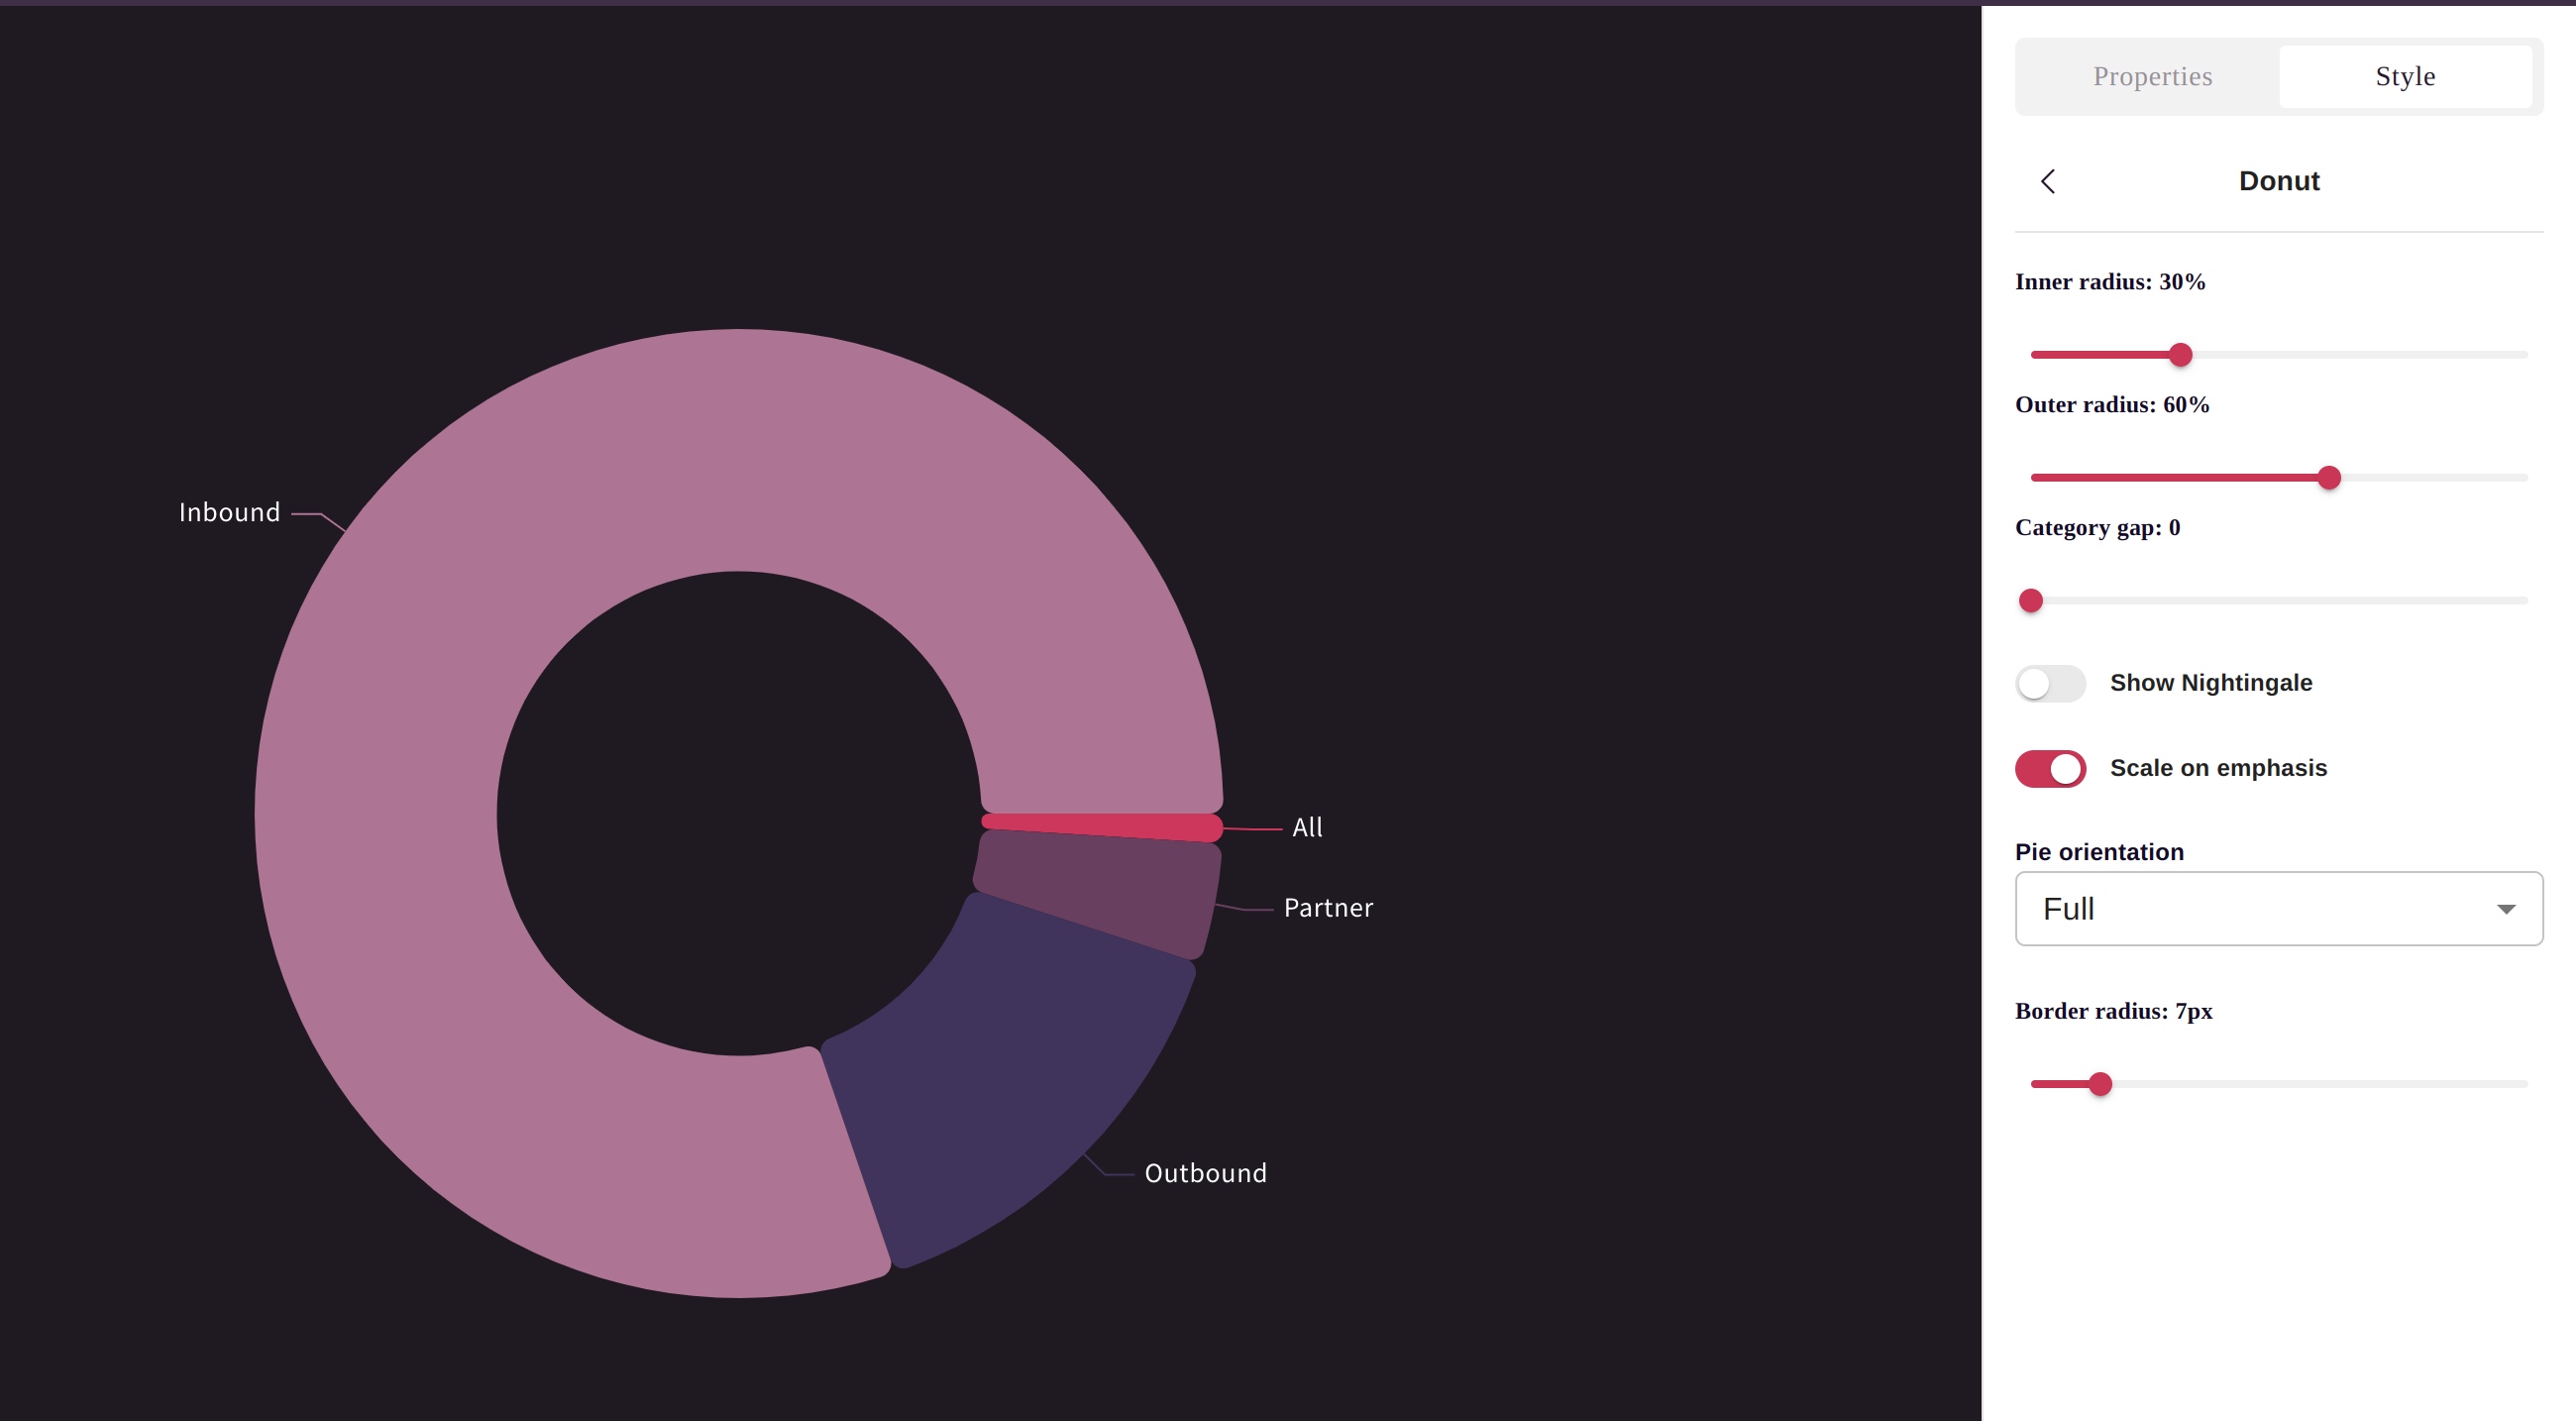
Donut charts add visual flair to pie charts while providing space in the center for a key metric or label.
Feature Description Center metric Display total or key KPI in center Modern aesthetic Contemporary look for dashboards Same data as pie Part-to-whole relationships Center labels Add context to the visualization
Scenario Example Dashboard KPIs Total revenue with breakdown Progress indicators Completion percentage Category breakdown Support tickets by type Executive presentations Clean, professional look
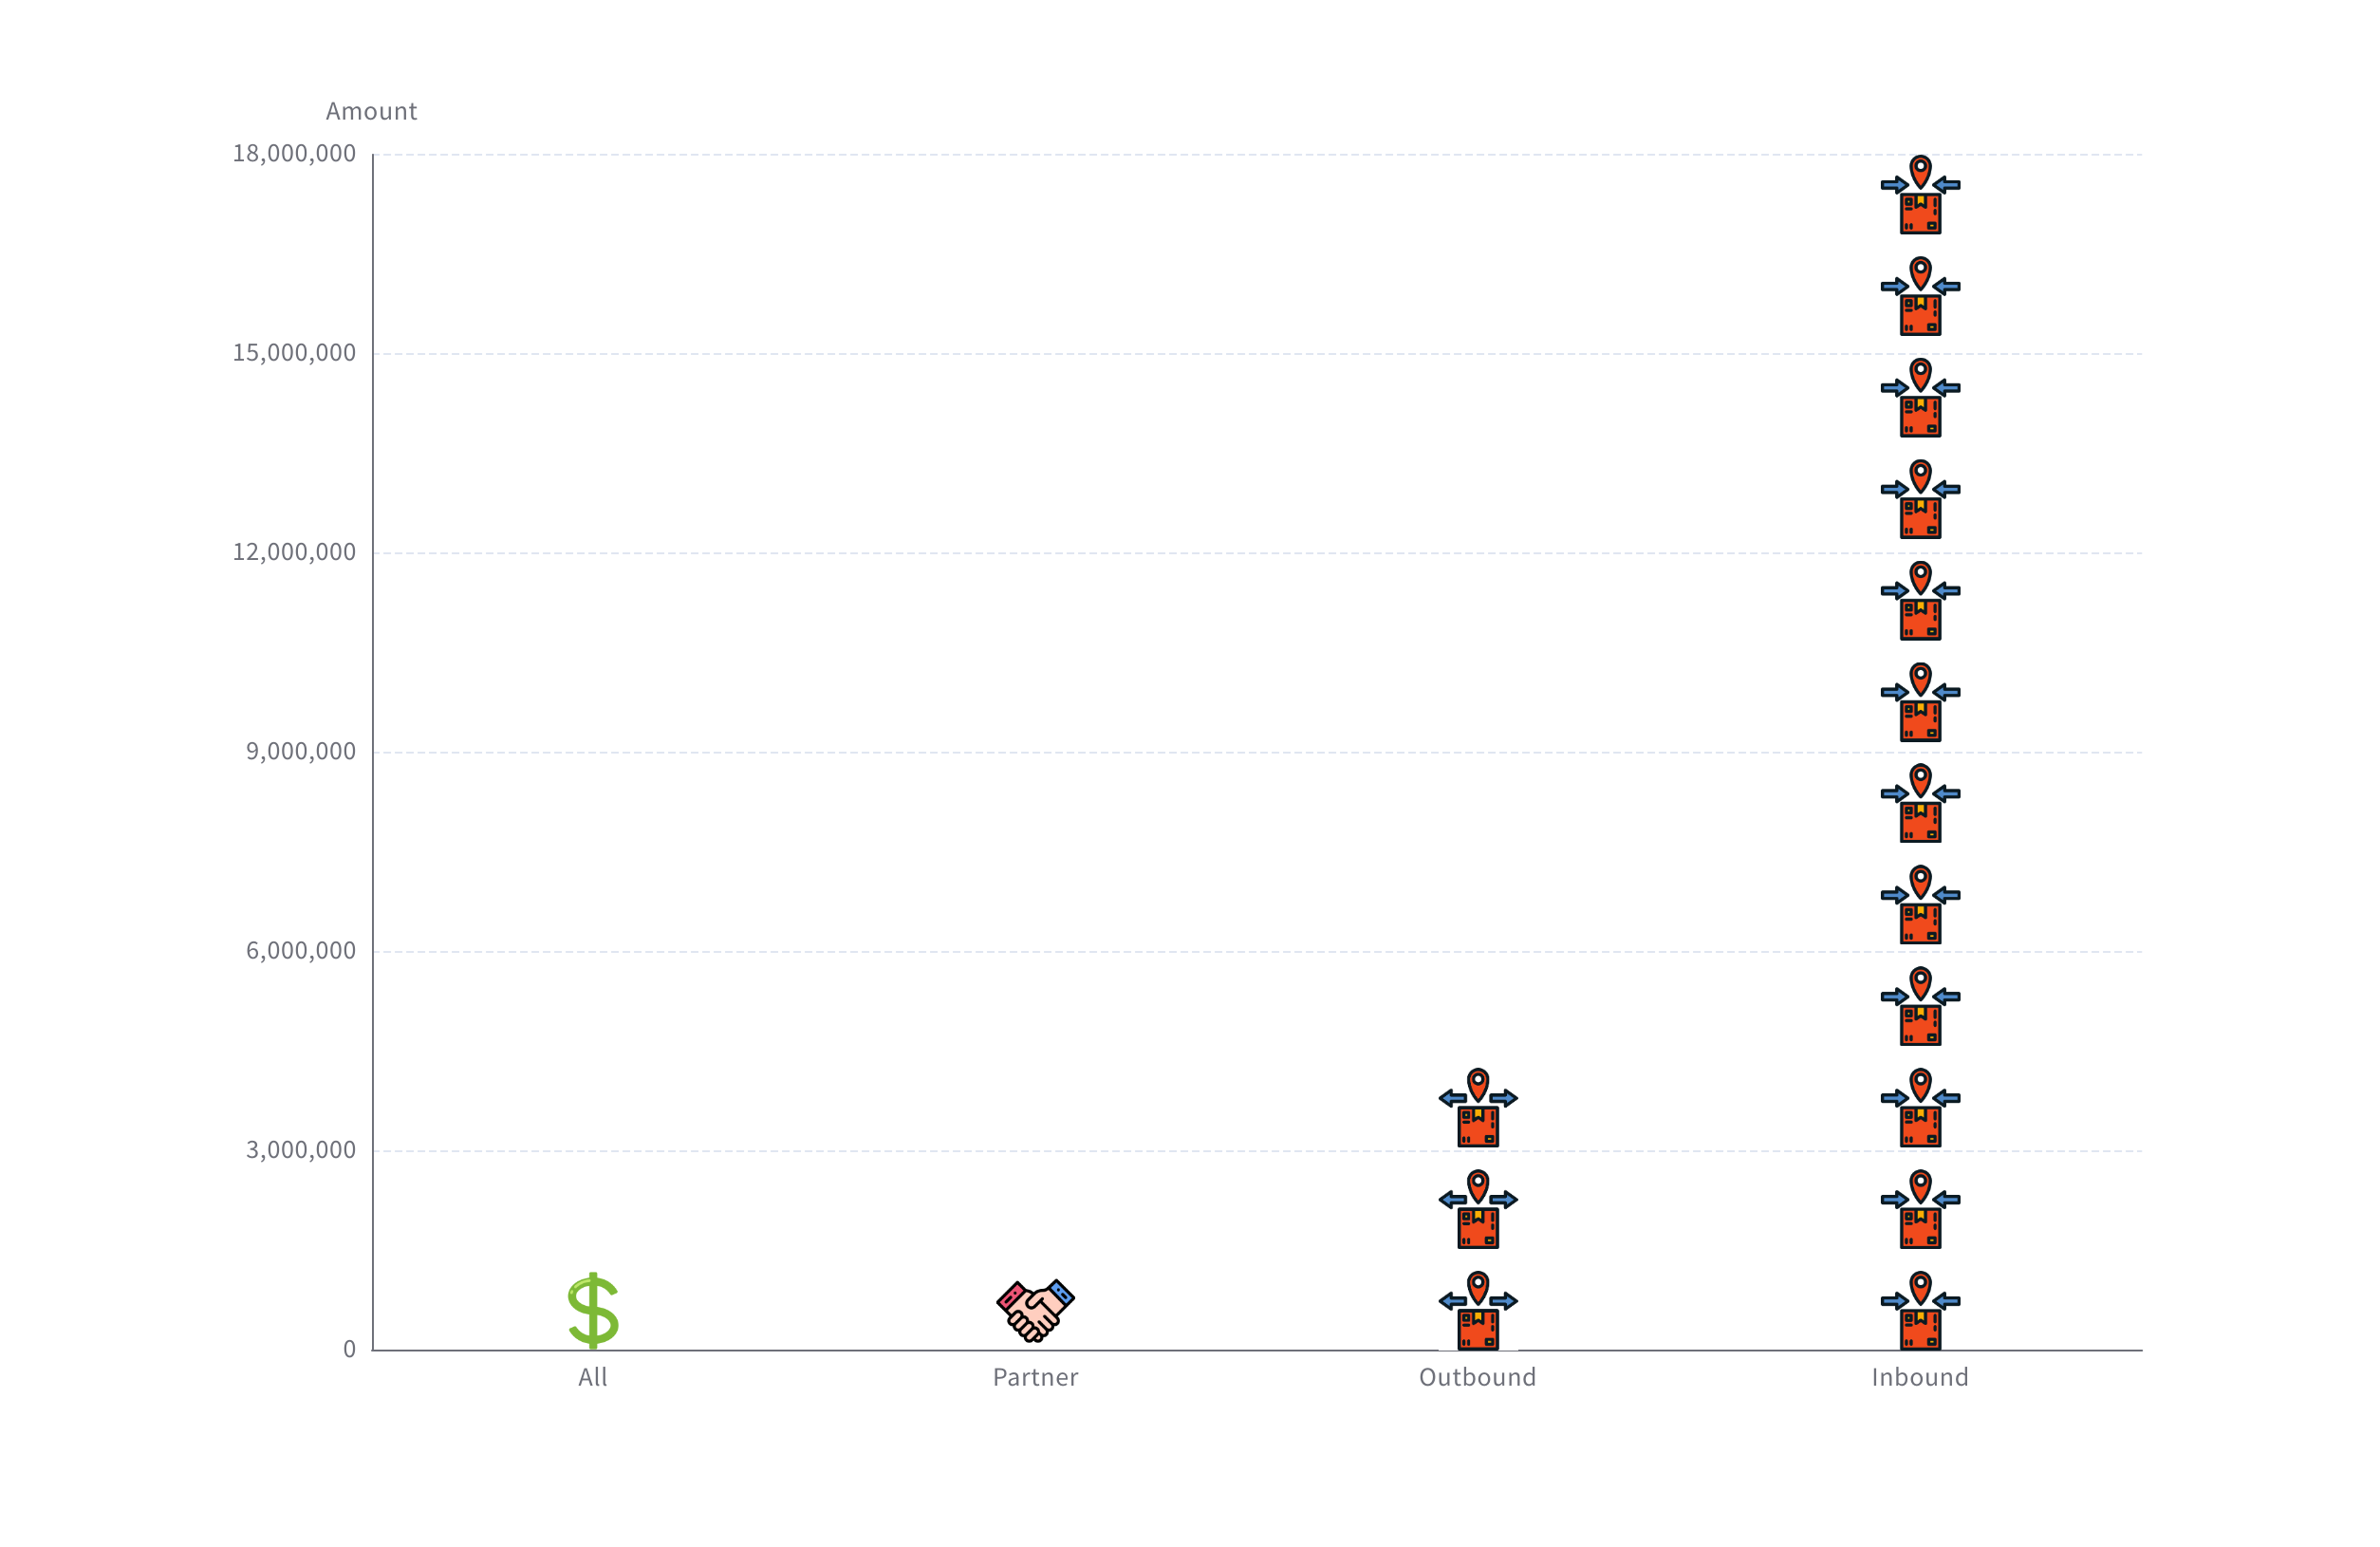
Pictorial charts replace standard bars or areas with custom images, adding visual interest and semantic meaning to your data.
Feature Description Custom images Upload logos, icons, photos Semantic meaning Visual matches the data context Brand alignment Use company imagery Engagement More memorable than standard charts
Scenario Example Product comparisons Products represented by their images Branded presentations Company-specific visualizations Infographics Public-facing reports Creative dashboards Marketing and design contexts
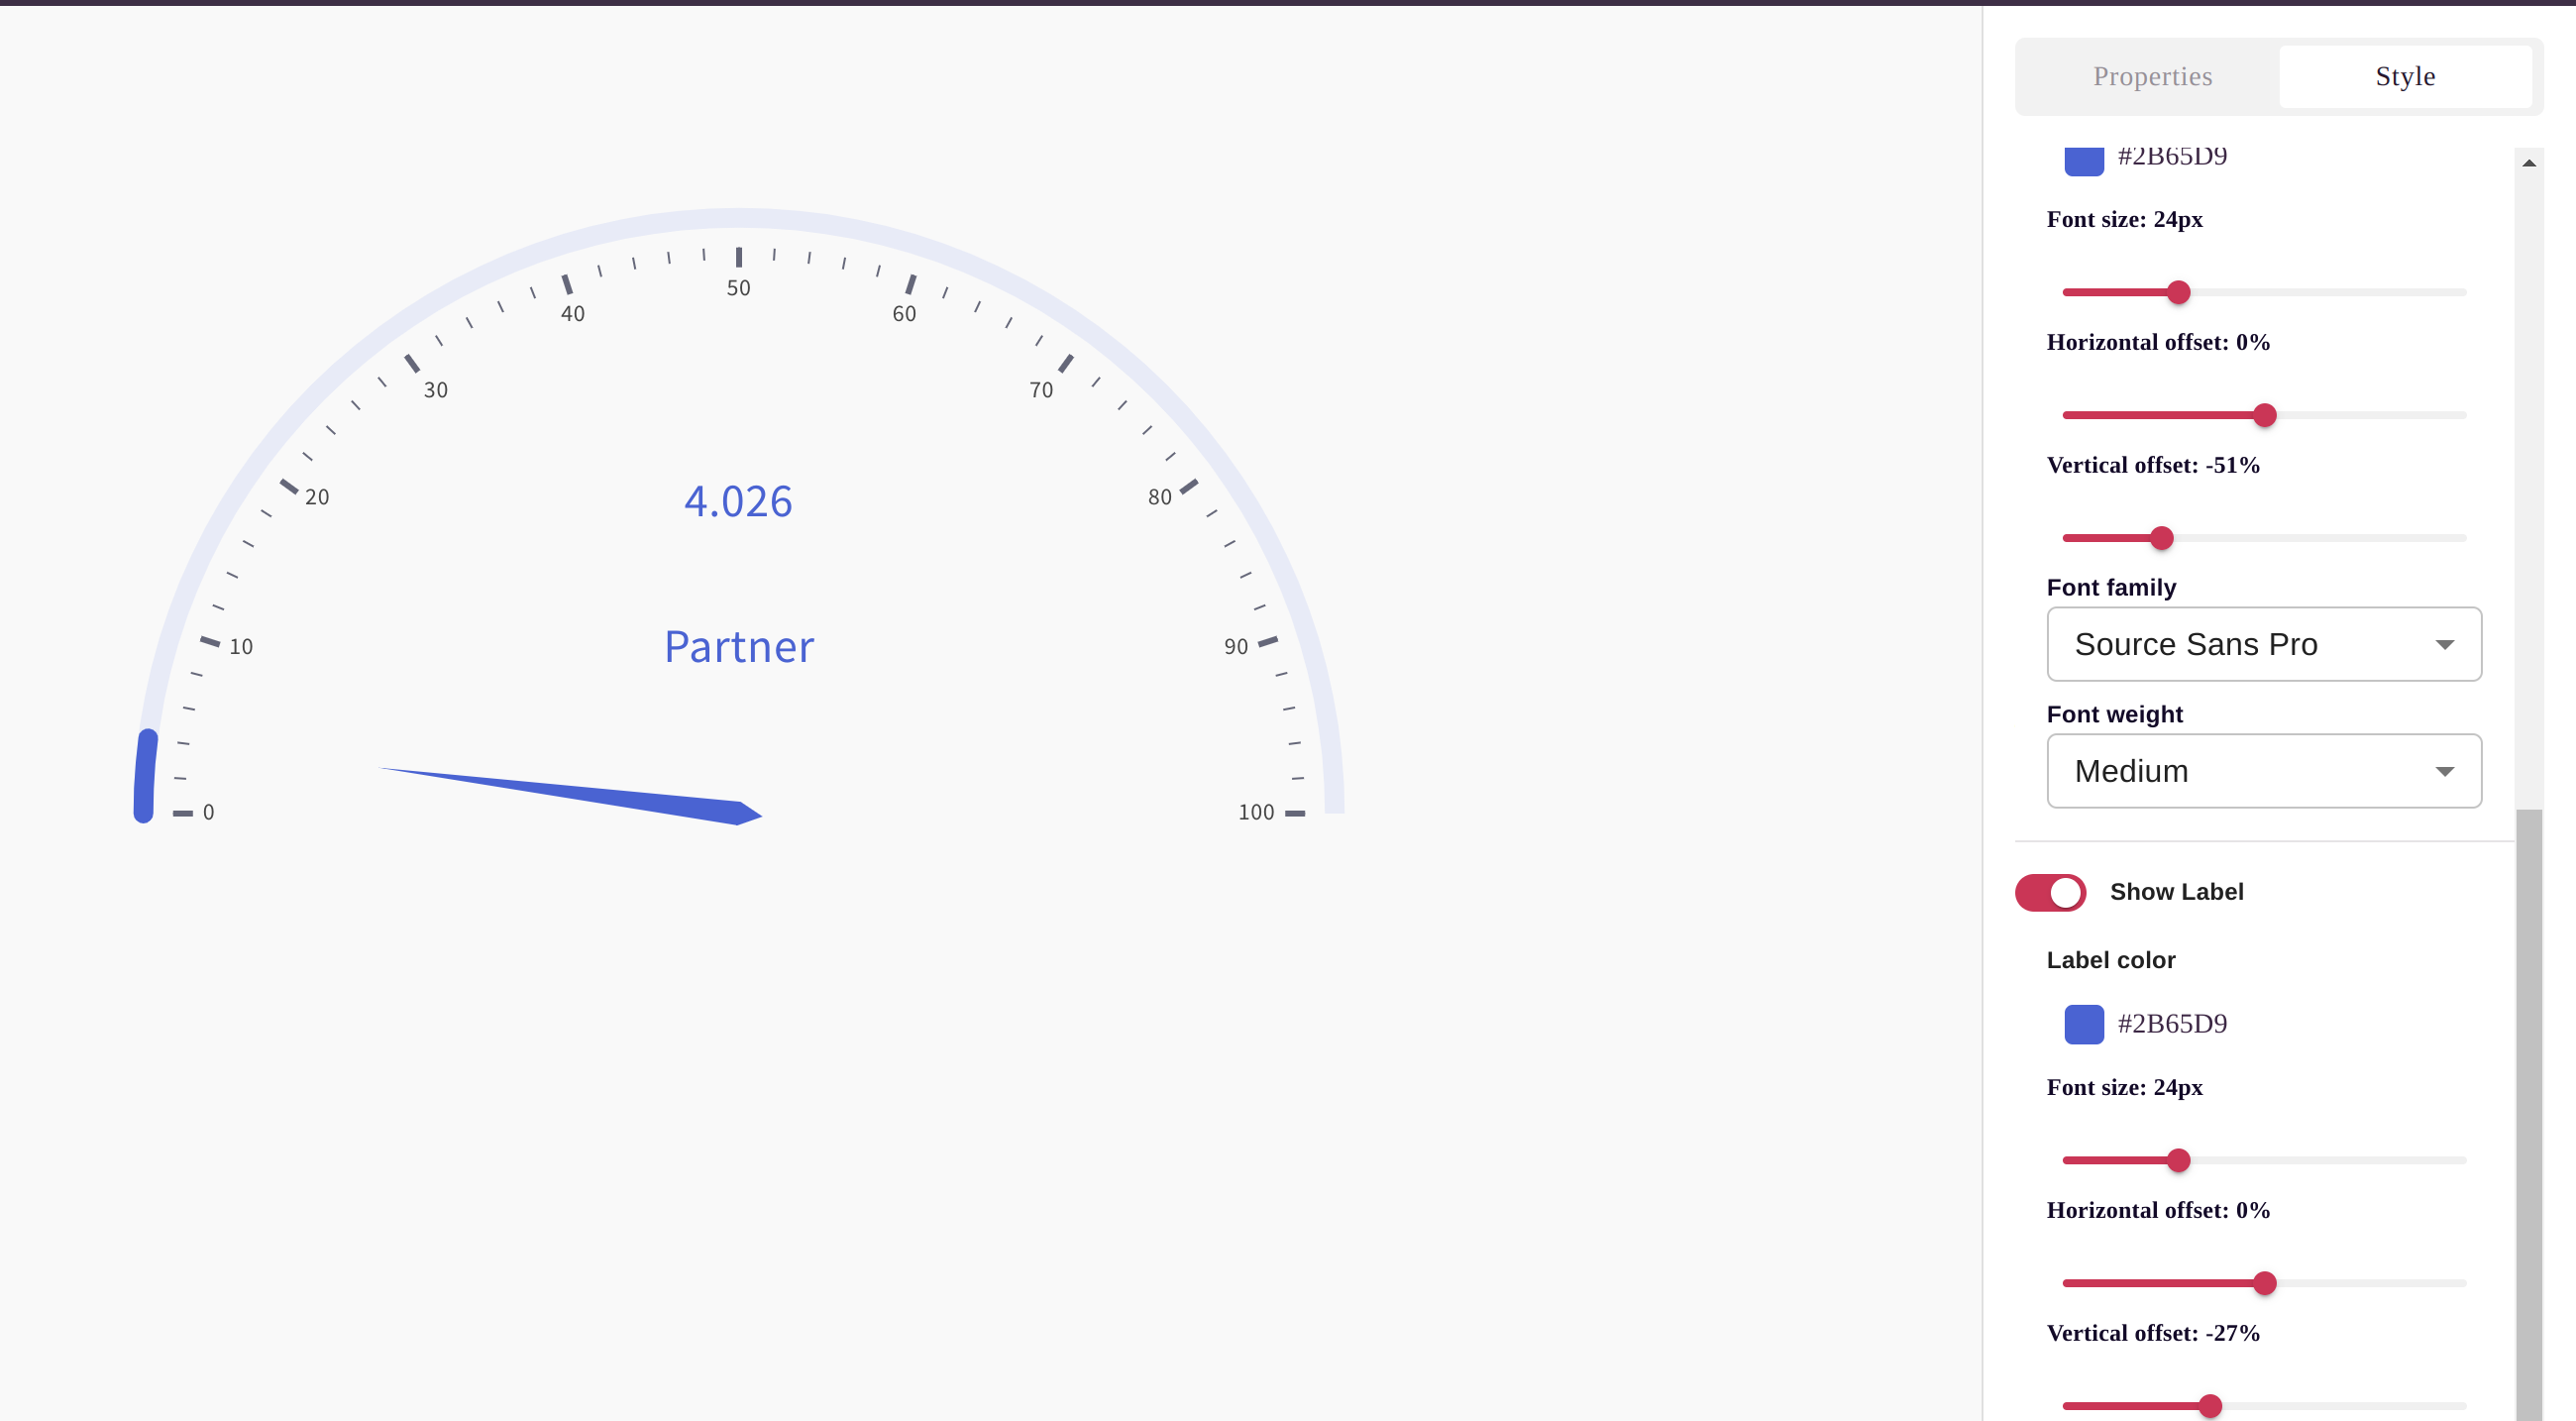
Gauges display progress toward a goal, making them perfect for KPIs and performance tracking.
Feature Description Target indicator Shows goal line Color zones Red/yellow/green for status Percentage display Progress as percentage Min/max configuration Custom scale range
Scenario Example Sales targets Quota attainment SLA compliance Service level percentage Budget tracking Spend vs. budget Goal progress Quarterly objectives
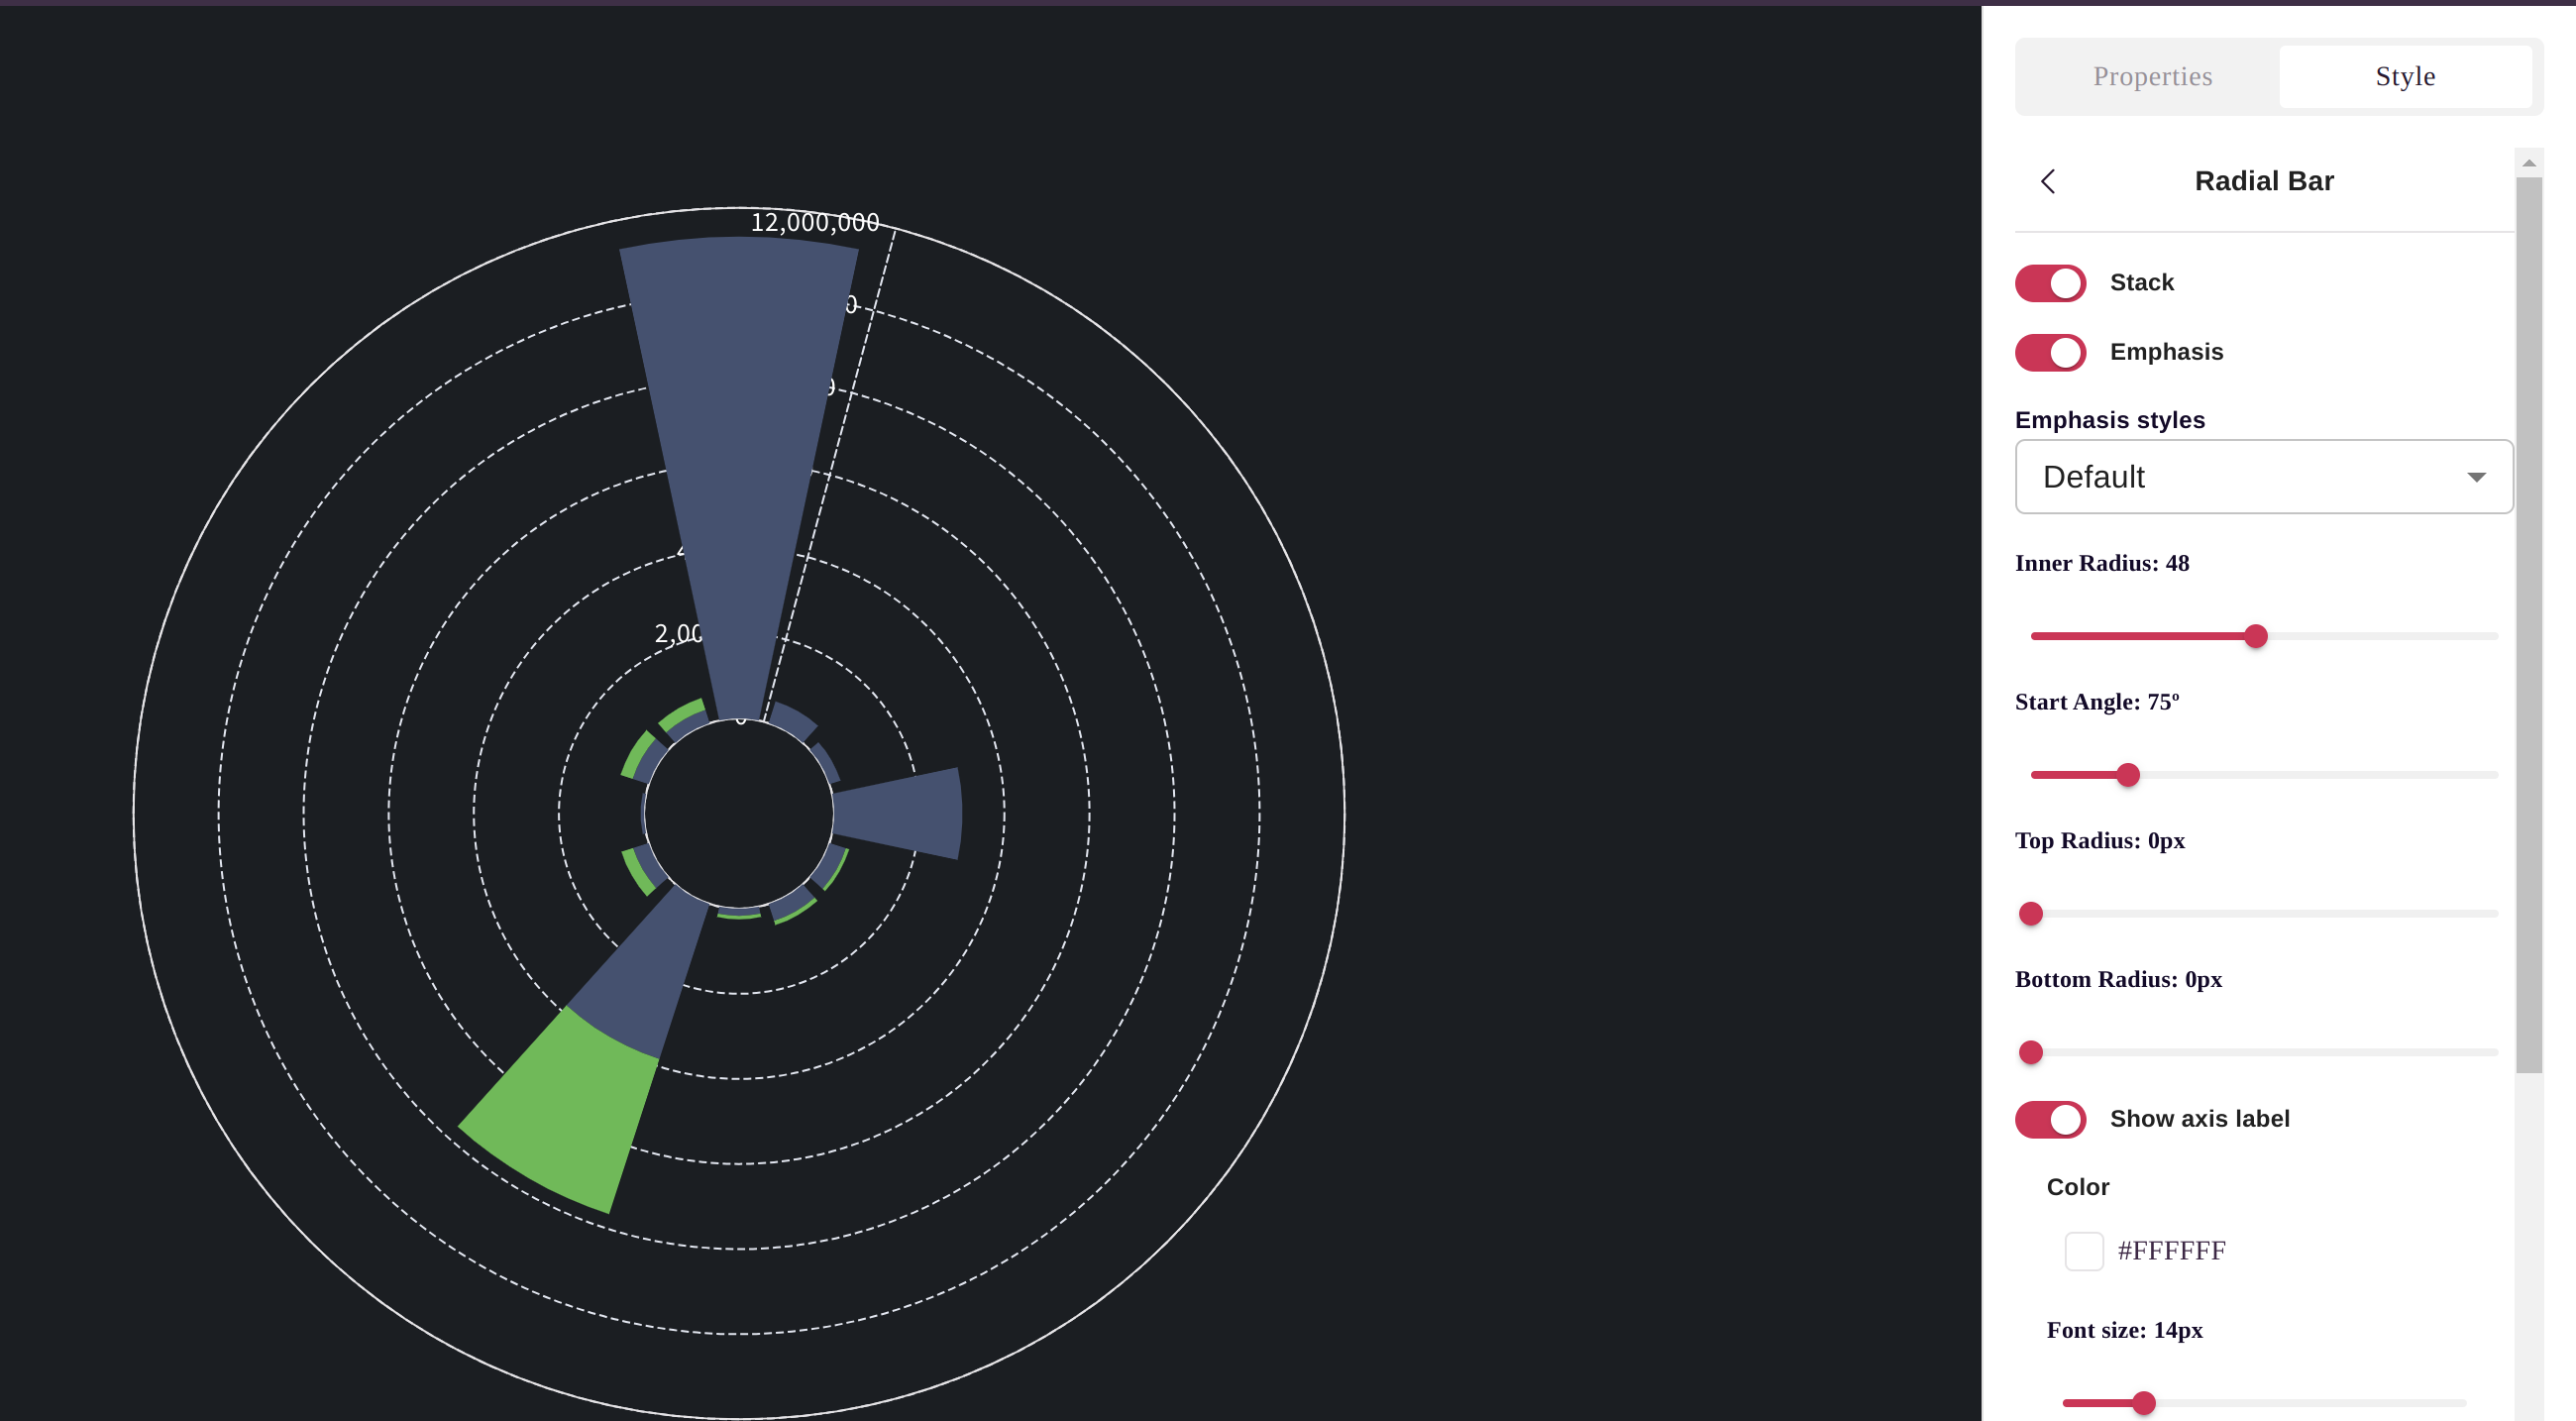
Radial charts arrange data in a circular pattern, useful for cyclical data or comparing multiple dimensions.
Feature Description Circular layout Unique visual presentation Multiple metrics Compare several values Cyclical data Natural for time-of-day, seasons Space efficient Compact multi-metric display
Scenario Example Multi-dimensional comparison Performance across 5 metrics Cyclical patterns Sales by hour of day Compact dashboards Multiple KPIs in small space Creative presentations Unique visual style
All chart types support extensive customization:
Category Options Colors Theme colors, custom palettes, conditional coloring Labels Data labels, axis labels, legend Axes Scale, range, gridlines, tick marks Legend Position, visibility, formatting Title Chart title, subtitle Borders Chart border and background
Practice Why Match chart to data Right chart type tells the story clearly Limit categories Too many makes charts unreadable Use consistent colors Same meaning = same color Label clearly Viewers should understand without explanation
Mistake Better Approach Pie chart with 10+ slices Use bar chart or group into "Other" 3D effects Stick to 2D for accuracy Truncated Y-axis Start at zero for fair comparison Too many chart types Consistency aids comprehension