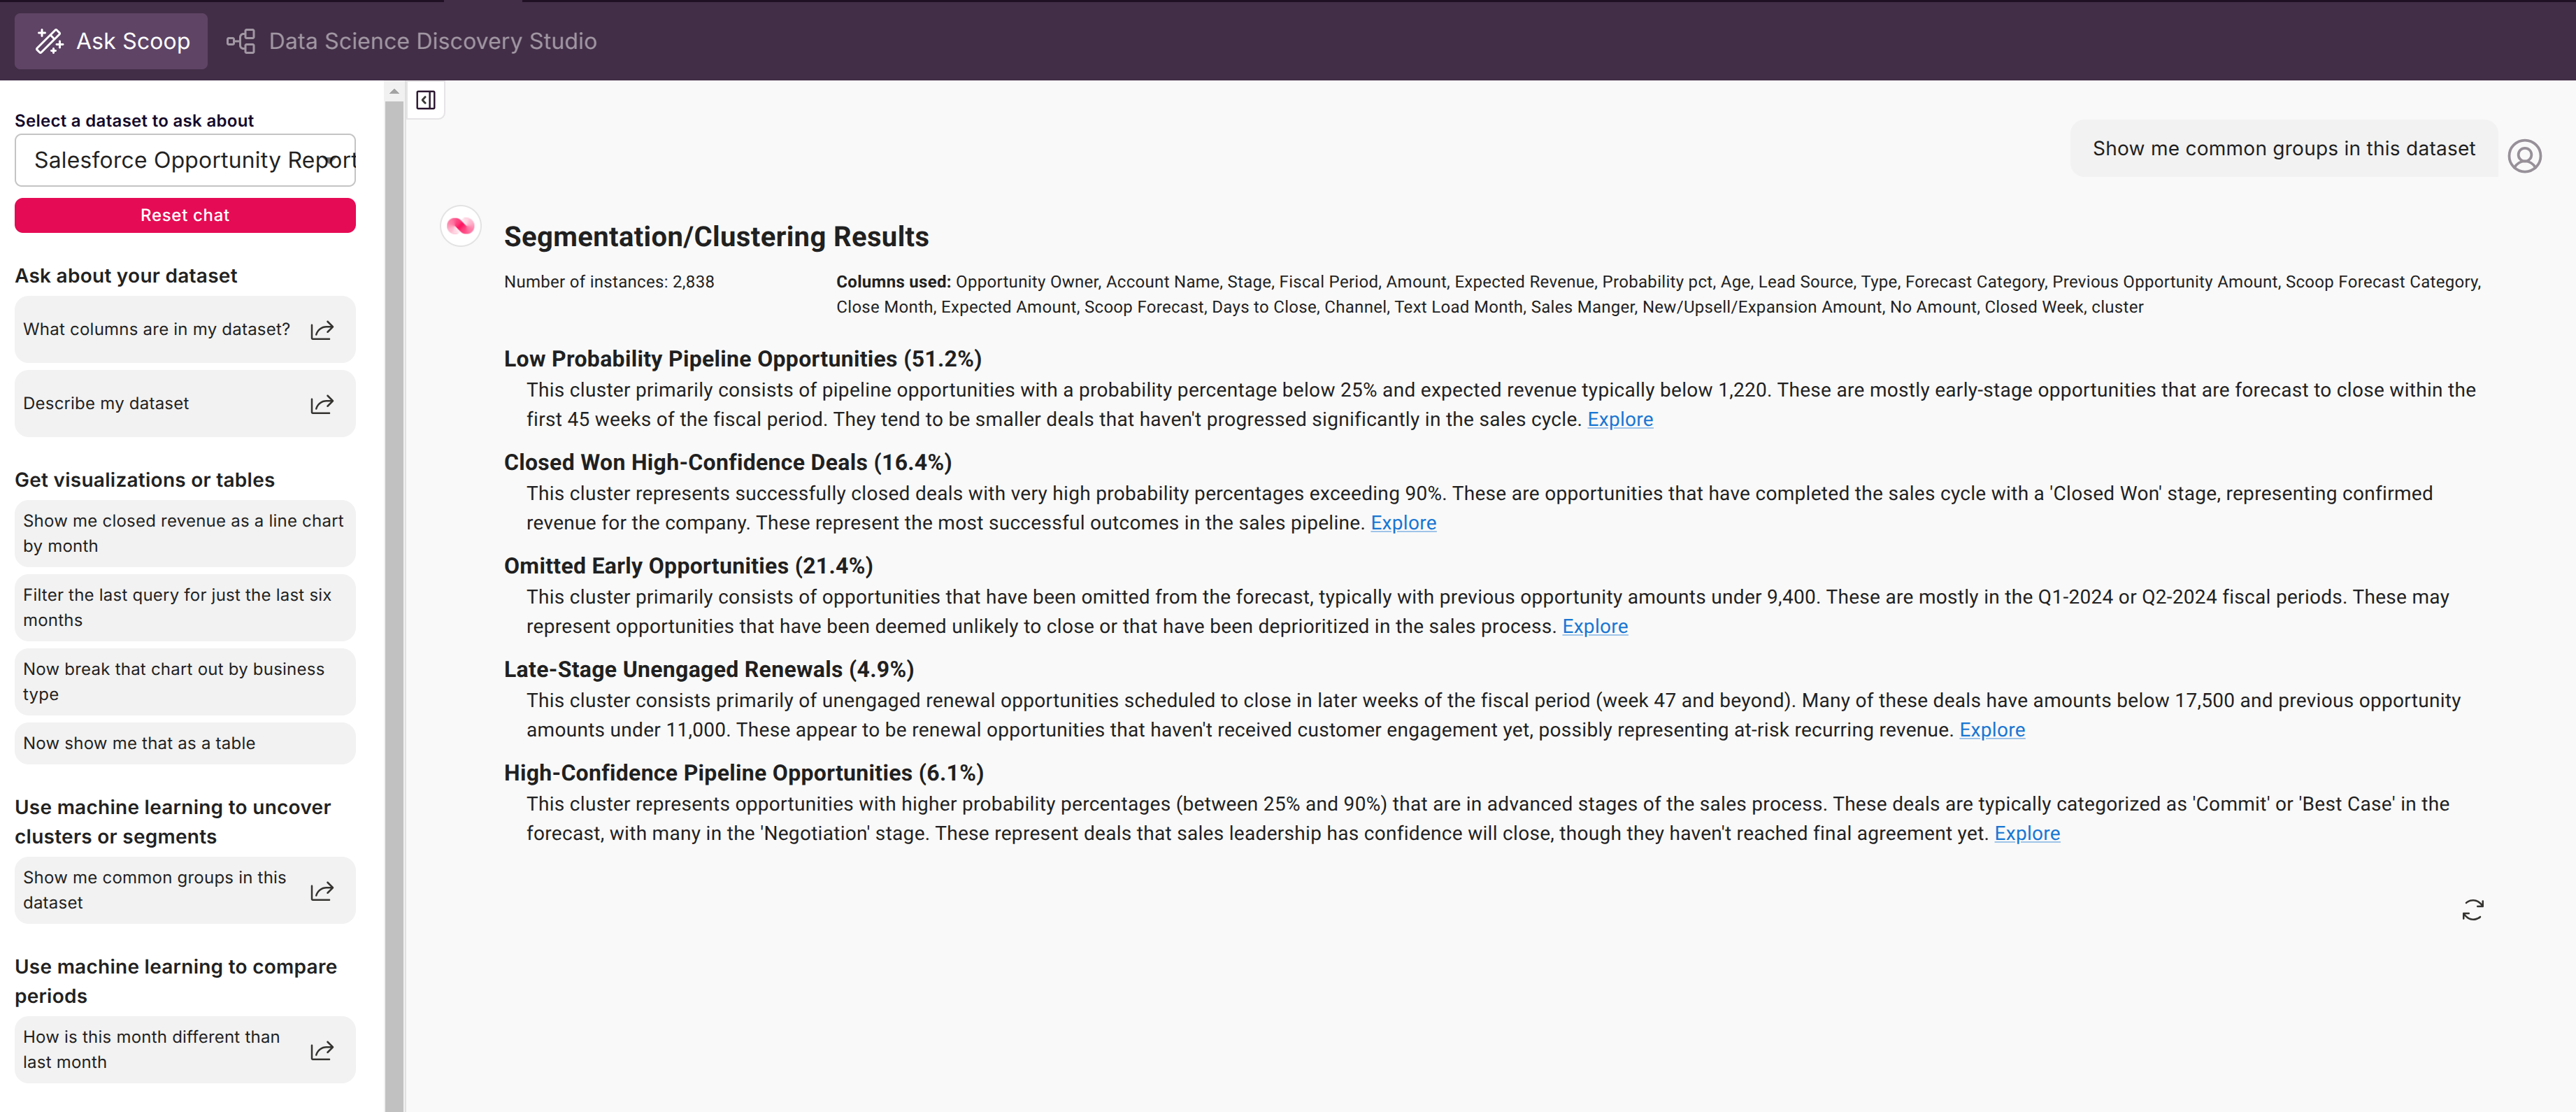
Segmentation/Clustering (Common Groups)
Discover hidden patterns and natural groupings in your data with AI-powered clustering
Clustering automatically discovers natural groupings in your data—customer segments, behavior patterns, or performance tiers—that you might not have thought to look for. Scoop's AI handles the complex math and delivers clear, actionable segment descriptions in plain English.
What Is Clustering?
| Aspect | Description |
|---|---|
| Definition | Machine learning that groups similar records together |
| Method | Analyzes multiple attributes simultaneously |
| Output | Named segments with clear descriptions |
| Skill Required | None—Scoop handles the data science |
Clustering vs. Filtering
| Approach | How It Works | Example |
|---|---|---|
| Filtering | You define the rule | "Show deals over $100K" |
| Grouping | You pick the column | "Group by Region" |
| Clustering | AI finds the patterns | "Discover natural segments" |
Clustering considers combinations of attributes across multiple columns simultaneously, finding patterns you might never have thought to look for.
Tip: Use clustering when you want to discover "unknown unknowns"—patterns you didn't know existed in your data.
How Clustering Works in Scoop
The Workflow
Select Dataset → Click "Find Common Groups" → AI Analyzes → Segments Revealed
      ↓                    ↓                        ↓              ↓
   Your data          One click              EM algorithm    Named segments
                                            + Rules models   with descriptions
Step-by-Step
- Select Your Dataset: Load the dataset to analyze (deals, customers, tickets, etc.)
- Click "Find Common Groups": Access from Data Science Studio tab
- AI Builds Clusters: Scoop determines optimal number of clusters automatically
- Clusters Named: AI translates statistical patterns into human descriptions
- Results Delivered: See summaries, profiles, and defining rules
What Happens Behind the Scenes
| Stage | Algorithm | Purpose |
|---|---|---|
| Clustering | Expectation Maximization (EM) | Finds natural groupings |
| Interpretation | Decision Trees | Identifies defining attributes |
| Naming | Rules Models | Creates human-readable descriptions |
Tip: You don't need to understand the algorithms. Scoop handles variable selection, scaling, and cluster assignment automatically.
Understanding Cluster Results
Cluster Profiles
Each cluster includes:
| Component | Description |
|---|---|
| Name | Descriptive label based on key characteristics |
| Size | Number and percentage of records |
| Key Attributes | What defines this segment |
| Rules | Conditions that predict membership |
How Clusters Are Named
Scoop creates meaningful names from the data:
| Pattern Detected | Cluster Name |
|---|---|
| High revenue, short cycles | "Quick Wins" |
| Large deals, many stakeholders | "Strategic Accounts" |
| Frequent engagement | "High Touch Customers" |
| Low activity, at-risk signals | "Needs Attention" |
Names are derived from actual patterns—not random labels.
Cluster Rules
Each cluster comes with defining rules:
Cluster: "Fast Closers"
Rules:
- Deal Size < $50K
- Sales Cycle < 30 days
- Decision Makers = 1-2
- Industry IN (Tech, Retail)
These rules tell you exactly why records belong to this segment.
Example: Sales Opportunity Clusters
Sample Results
After running clustering on opportunities:
| Cluster | Size | Key Characteristics |
|---|---|---|
| Quick Wins | 35% | Small deals, single decision maker, fast close |
| Enterprise Deals | 15% | Large value, long cycle, multiple stakeholders |
| Stalled Opportunities | 20% | Aging deals, low engagement, needs intervention |
| Competitive Battles | 18% | Competitor mentioned, price sensitive |
| Expansion Deals | 12% | Existing customers, upsell/cross-sell |
What Each Cluster Tells You
| Cluster | Actionable Insight |
|---|---|
| Quick Wins | Prioritize for this month's close |
| Enterprise Deals | Assign senior reps, plan resources |
| Stalled Opportunities | Intervention needed—re-engage or disqualify |
| Competitive Battles | Arm reps with competitive positioning |
| Expansion Deals | Leverage existing relationship |
Example: Support Ticket Clusters
Sample Results
| Cluster | Key Characteristics |
|---|---|
| Quick Resolutions | Resolved < 1 hour, repeat customers, known issues |
| Escalated Criticals | High severity, specific products, long resolution |
| Low Engagement | Minimal customer response, incomplete descriptions |
| Complex Investigations | Multiple back-and-forths, cross-team involvement |
Insights
- Quick Resolutions: Document common fixes for knowledge base
- Escalated Criticals: Route to senior agents immediately
- Low Engagement: Implement proactive outreach
- Complex Investigations: Allocate specialist time
Example: Customer Segmentation
Sample Results
| Cluster | Size | Profile |
|---|---|---|
| Power Users | 8% | High engagement, many features, advocates |
| Steady State | 45% | Regular usage, core features only |
| Growing | 22% | Increasing activity, adding users |
| At Risk | 15% | Declining usage, no recent logins |
| Dormant | 10% | Minimal activity, churn candidates |
Actions by Segment
| Cluster | Recommended Action |
|---|---|
| Power Users | Reference program, beta access |
| Steady State | Feature adoption campaigns |
| Growing | Upsell opportunities, success check-ins |
| At Risk | Intervention, health check calls |
| Dormant | Re-engagement campaign or churn prevention |
Using Cluster Results
Filter by Cluster
Once clusters are identified, use them as filters:
- View all records in a specific cluster
- Compare metrics across clusters
- Track cluster distribution over time
Export for Action
| Use Case | How |
|---|---|
| Targeted campaigns | Export cluster for marketing automation |
| Sales prioritization | Filter opportunities by cluster |
| Support routing | Assign tickets based on cluster |
Track Changes
Monitor how clusters evolve:
- Are "At Risk" customers increasing?
- Is "Quick Wins" cluster growing?
- Movement between clusters over time
Best Practices
When to Use Clustering
| Good Fit | Poor Fit |
|---|---|
| Discover unknown patterns | Confirm known groups |
| Explore large datasets | Very small datasets |
| Find natural segments | Simple filtering needed |
| Multi-dimensional analysis | Single-attribute grouping |
Data Preparation
| Practice | Why |
|---|---|
| Include relevant attributes | More columns = richer segments |
| Clean data quality | Missing values affect clustering |
| Sufficient records | Need enough data for patterns |
| Mix of attributes | Variety enables discovery |
Interpreting Results
| Tip | Description |
|---|---|
| Review cluster sizes | Very small clusters may be noise |
| Check rules | Understand what defines each segment |
| Validate with domain knowledge | Do segments make business sense? |
| Test actionability | Can you act on these insights? |
Common Applications
| Domain | Clustering Use |
|---|---|
| Sales | Opportunity segmentation, rep assignment |
| Marketing | Customer segments, campaign targeting |
| Support | Ticket routing, workload planning |
| Product | User personas, feature usage patterns |
| Finance | Customer value tiers, risk groups |
Troubleshooting
Too Many/Few Clusters
Scoop automatically determines optimal cluster count. If results seem off:
- Check if data has clear natural groupings
- Verify data quality and completeness
- Consider filtering to relevant subset
Clusters Don't Make Sense
If segments aren't meaningful:
- Review which columns are included
- Check for data quality issues
- Validate with domain experts
Clusters Too Similar
If segments overlap significantly:
- Data may not have strong natural groupings
- Consider adding more discriminating attributes
- Focus on the most distinct clusters
Related Topics
- Automated Dataset Analysis - Full AI analysis workflow
- Understanding Recipes - Pre-built analytics templates
- Process Analysis - Visualize flows
- Creating KPIs - Custom metrics by segment
Updated 8 months ago