Embedding a Named Range in a Canvas (Sheetlet)
Display and edit spreadsheet data directly on your canvas
A sheetlet is a live, editable window into your spreadsheet displayed directly on a canvas. Unlike static images, sheetlets maintain full interactivity—click cells to edit values, see formulas, and watch calculations cascade through your model in real-time.
How Sheetlets Work
Sheetlets connect to named ranges in your Live Worksheets:
┌─────────────────────────────────────────────────────────┐
│                     Canvas                               │
│  ┌─────────────────────────────────────────────────┐    │
│  │              Sheetlet                            │    │
│  │  ┌─────────┬─────────┬─────────┐                │    │
│  │  │ Cell A1 │ Cell B1 │ Cell C1 │                │    │
│  │  ├─────────┼─────────┼─────────┤   ← Editable! │    │
│  │  │ Cell A2 │ Cell B2 │ Cell C2 │                │    │
│  │  └─────────┴─────────┴─────────┘                │    │
│  │         ↓                                        │    │
│  │   Named Range in Live Worksheet                  │    │
│  └─────────────────────────────────────────────────┘    │
└─────────────────────────────────────────────────────────┘
When you edit a cell in a sheetlet:
- The change syncs to the Live Worksheet
- Formulas recalculate immediately
- Other elements referencing that worksheet update
- All viewers see the change in real-time
Adding a Sheetlet to a Canvas
Step 1: Create a Named Range
In your Live Worksheet (Google Sheets):
- Select the cells you want to display
- Go to Data → Named ranges
- Give it a descriptive name (e.g., "Assumptions", "Summary", "Inputs")
- Click Done
Naming tips:
- Use descriptive names: "Q4_Forecast" not "Range1"
- Avoid spaces and special characters
- Keep names short but meaningful
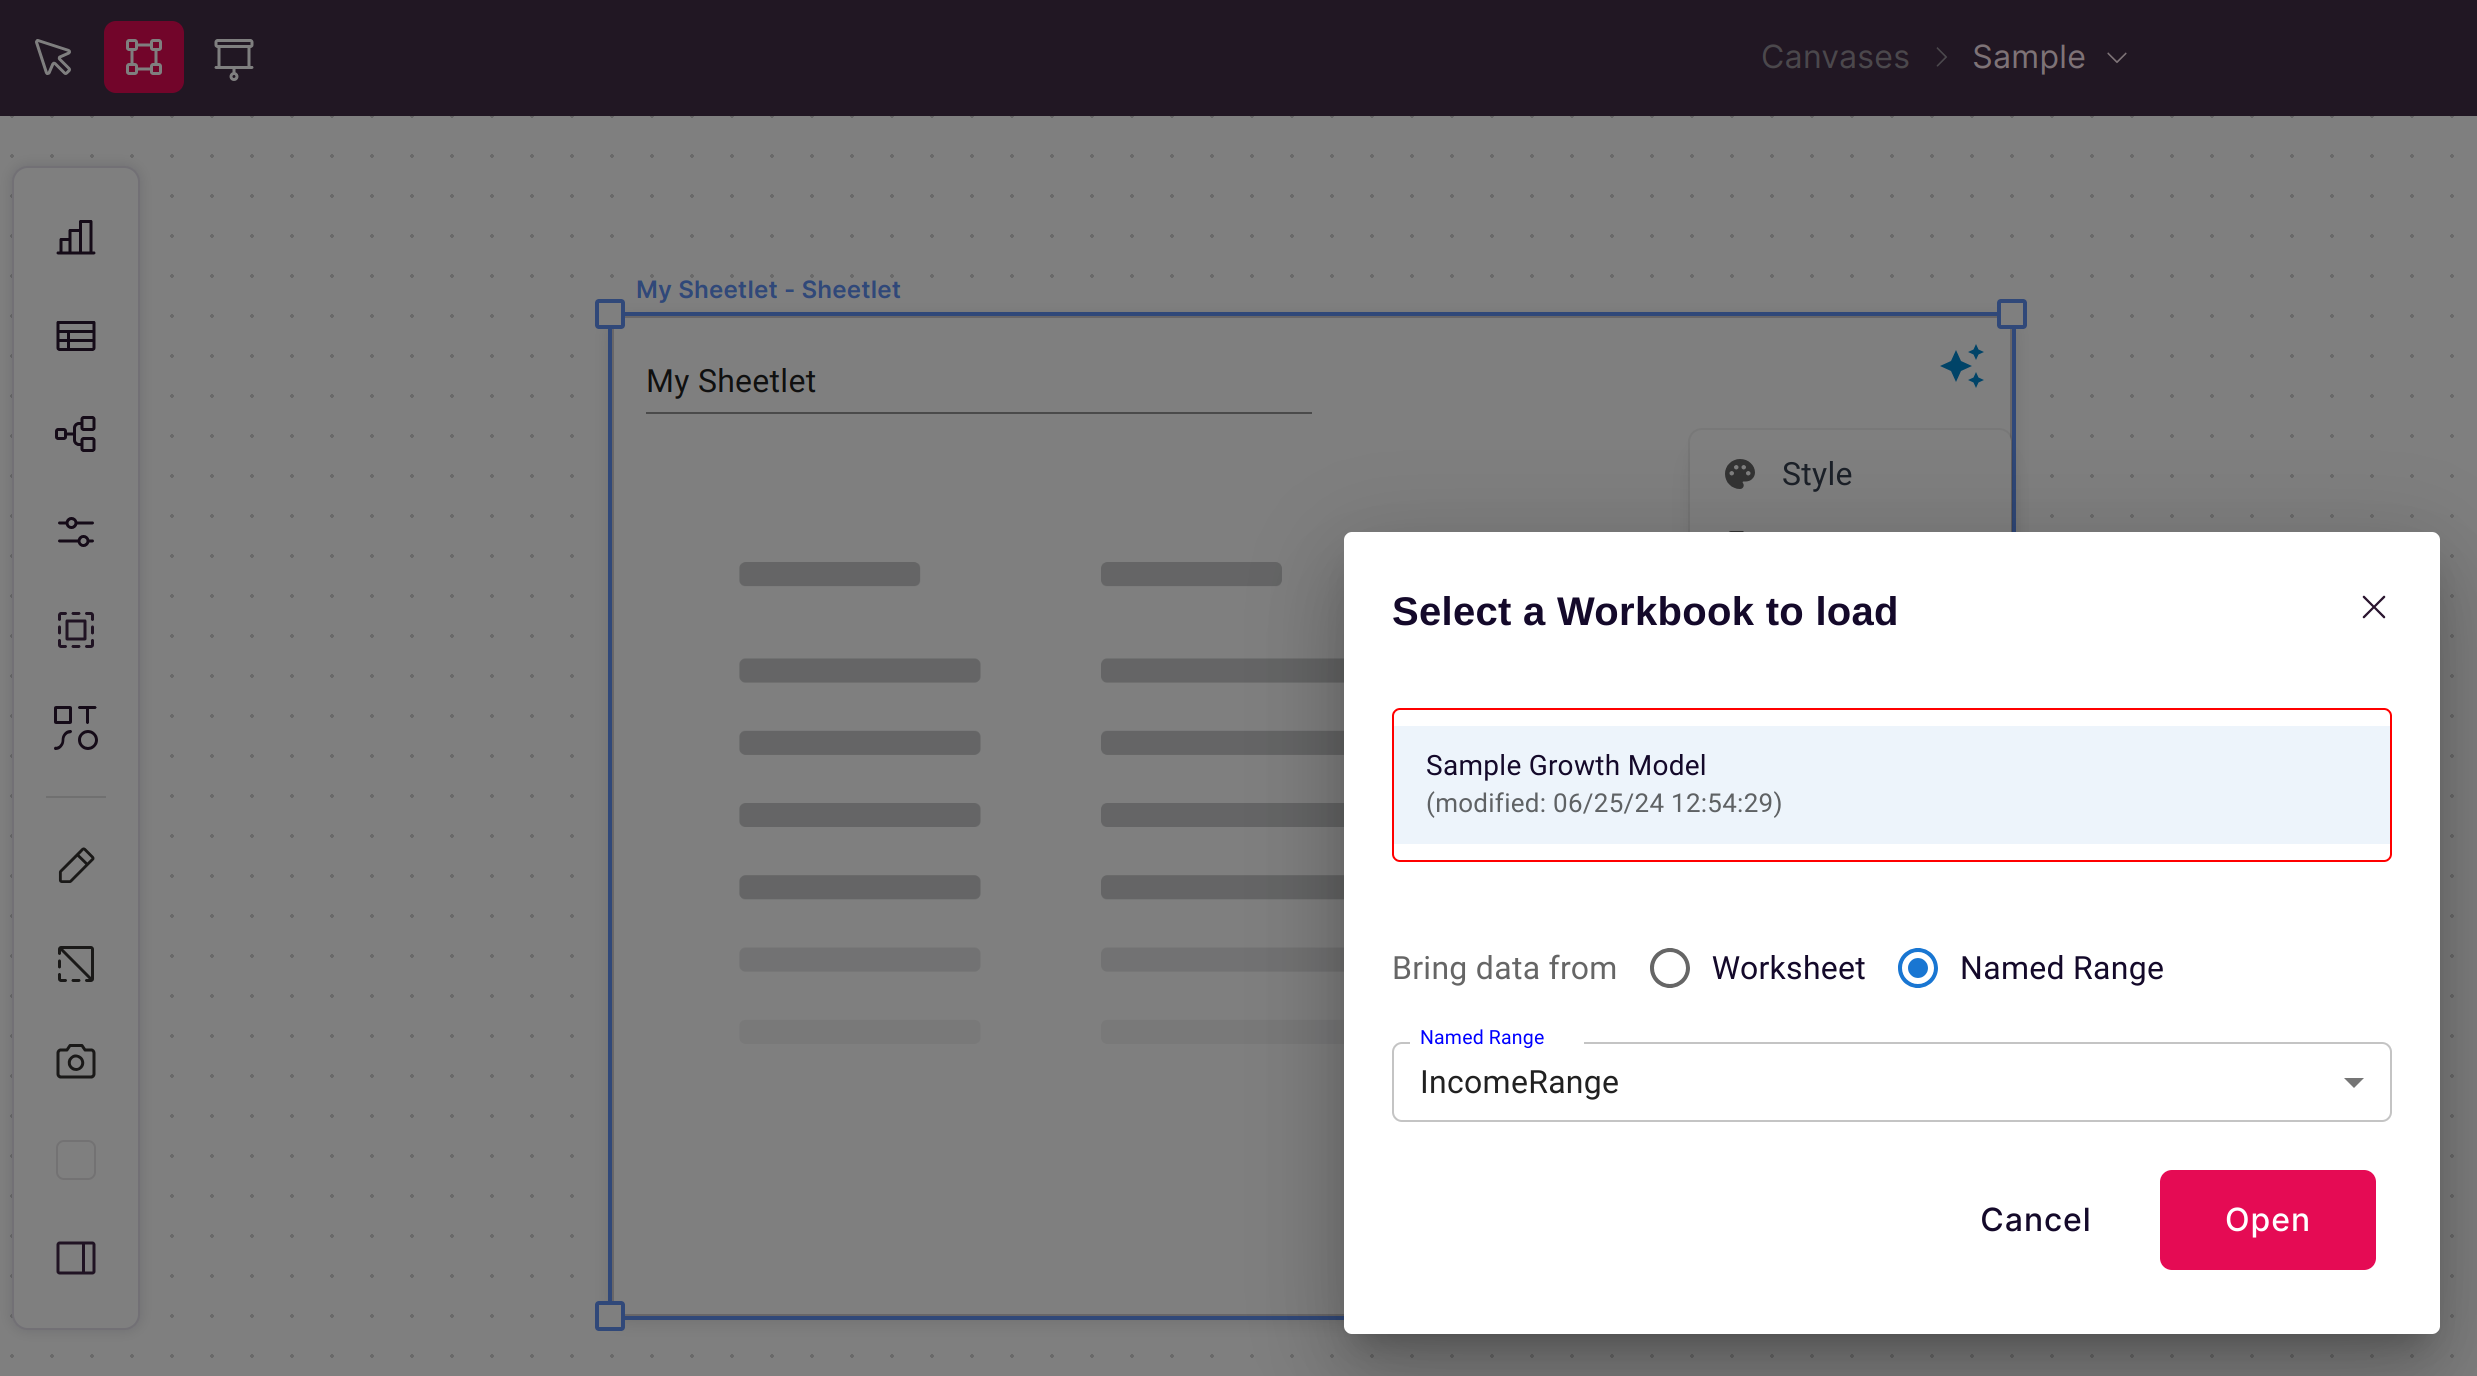
Step 2: Add to Canvas
- Open your canvas in edit mode
- Click + Add from the toolbar
- Select Sheetlet
- Choose your Live Worksheet from the dropdown
- Select the named range
- Click to place on your canvas
Step 3: Position and Size
- Drag to reposition
- Resize using corner handles
- The sheetlet automatically shows row and column headers
Working with Sheetlets
Viewing Cell Details
Click any cell to see:
- Current value (formatted)
- Underlying formula (if any)
- Raw numeric value
Editing Cells
Click a cell and type to change its value:
- Numbers update immediately
- Formulas recalculate dependents
- Changes sync to Google Sheets
What you can edit:
- Values in cells without formulas
- Cells marked as editable in the worksheet
What you cannot edit:
- Formula cells (shows formula but can't change)
- Cells outside the named range
- Protected cells
Real-Time Sync
Changes propagate instantly:
Edit cell in sheetlet
        ↓
Google Sheets updates
        ↓
Formulas recalculate
        ↓
Other sheetlets/charts update
        ↓
All viewers see change
This happens in seconds, enabling live collaboration and real-time what-if analysis.
Use Cases
What-If Analysis
Build a model with editable assumptions:
Worksheet structure:
┌──────────────────────────────────────┐
│ Assumptions (Named: "Assumptions") │
├──────────────────┬───────────────────┤
│ Growth Rate │ 12% │ ← Editable
│ Expense Ratio │ 35% │ ← Editable
│ Tax Rate │ 21% │ ← Editable
└──────────────────┴───────────────────┘
┌──────────────────────────────────────┐
│ Results (Named: "Results") │
├──────────────────┬───────────────────┤
│ Revenue │ =Base*(1+B1) │ ← Formula
│ Expenses │ =B4*B2 │ ← Formula
│ Net Income │ =(B4-B5)*(1-B3) │ ← Formula
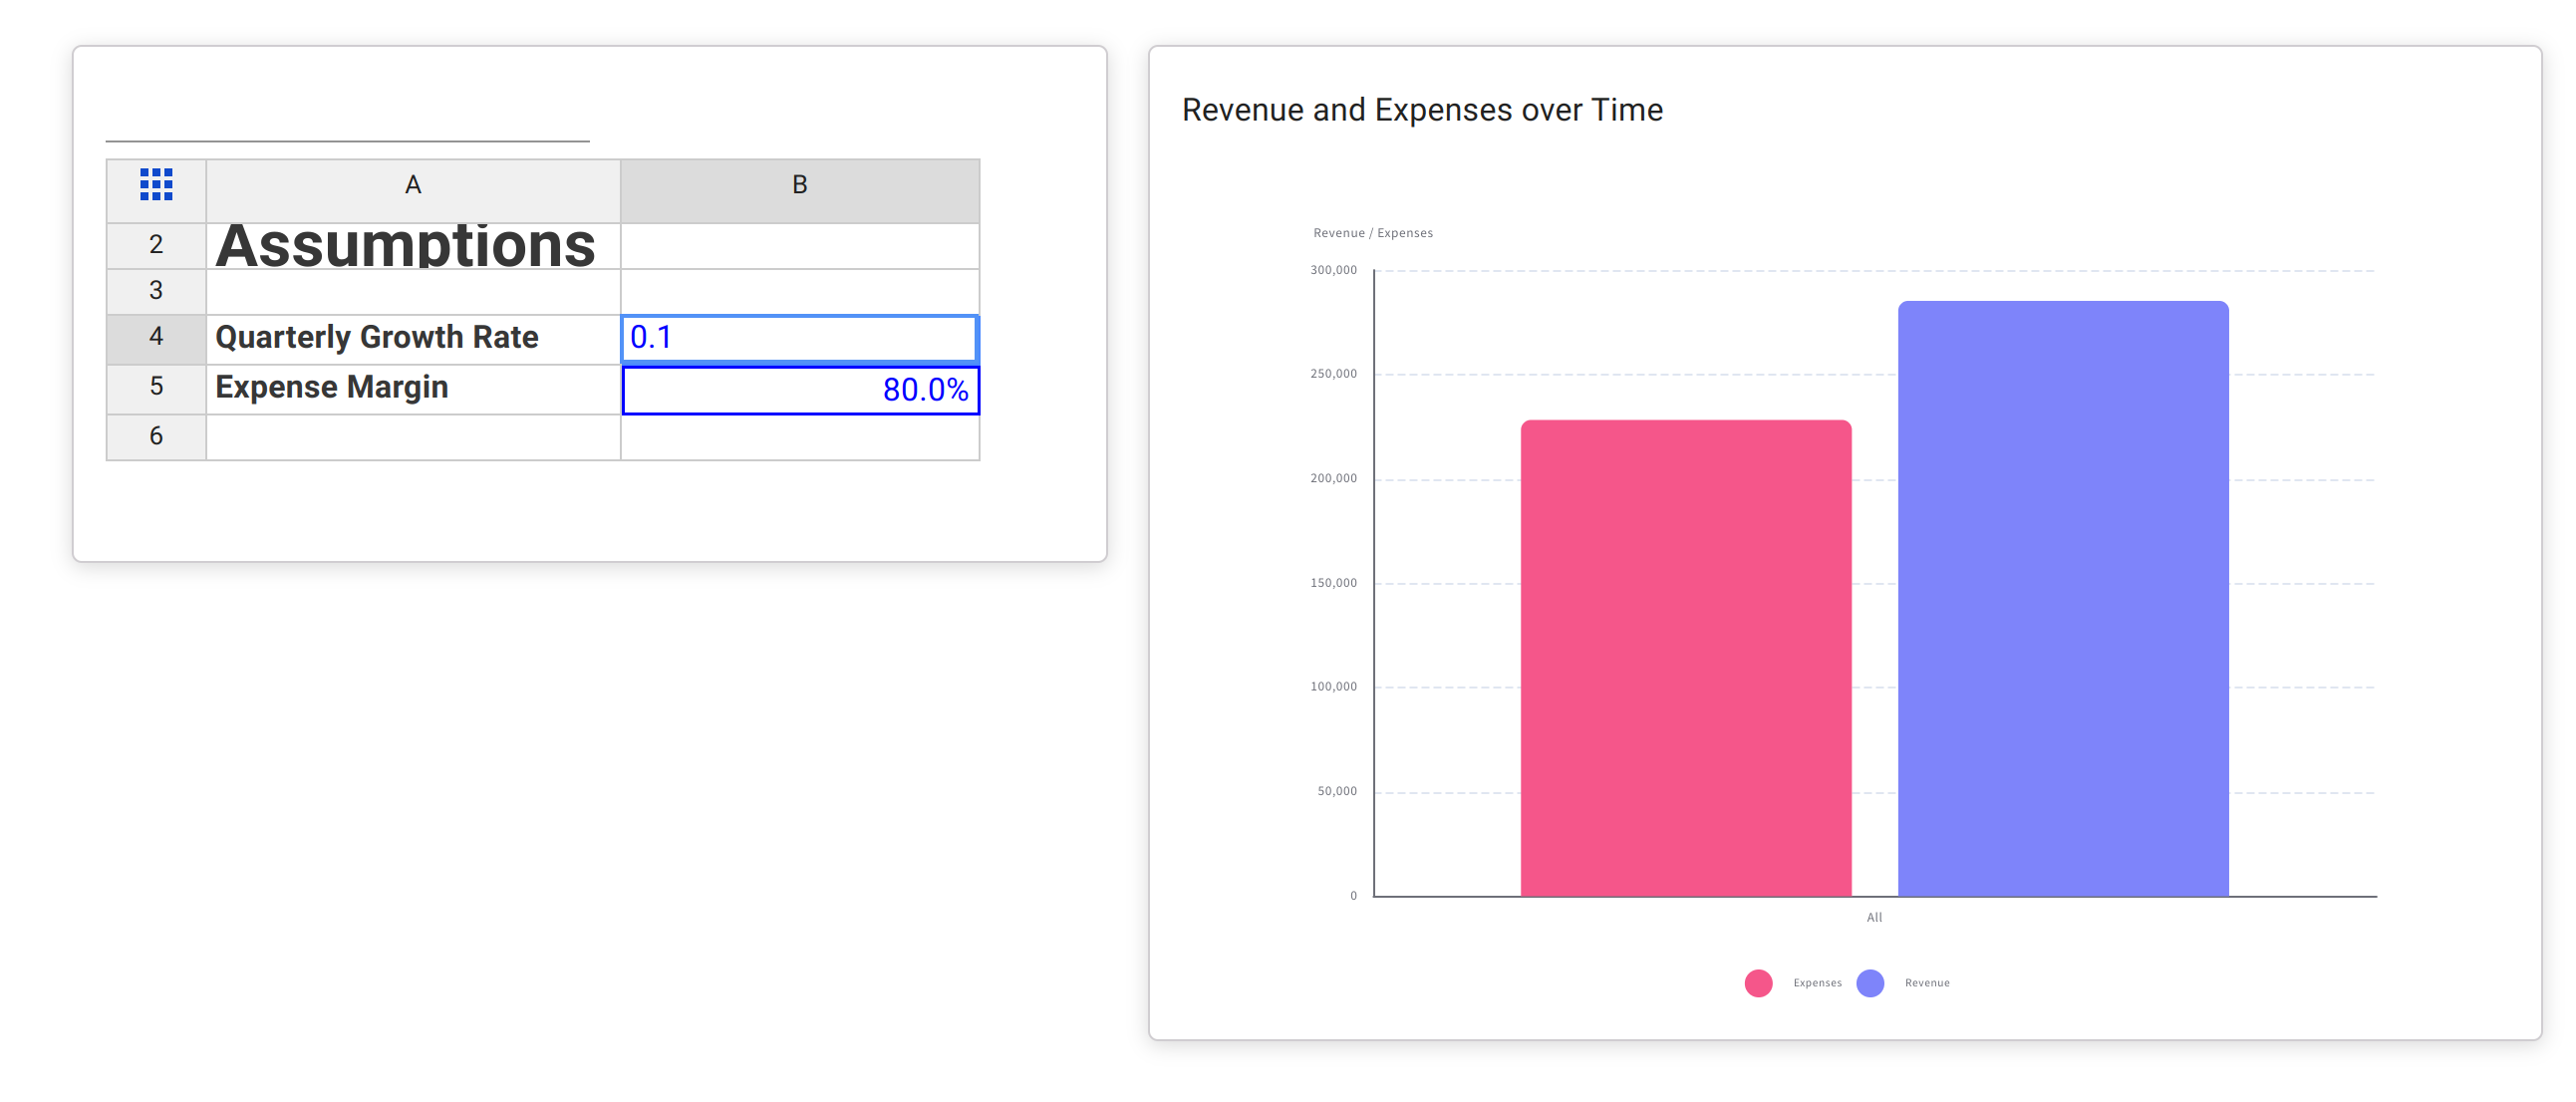
└──────────────────┴───────────────────┘On canvas:
- Sheetlet showing "Assumptions" (editable)
- Sheetlet showing "Results" (calculated)
- Chart visualizing the results
Change Growth Rate → Watch Revenue and Net Income update → Chart reflects new values.
Data Entry Forms
Create input forms for:
- Budget submissions
- Forecast updates
- Inventory counts
- Time tracking
Users enter data directly on the canvas without needing Google Sheets access.
Live Dashboards
Display key metrics calculated in spreadsheets:
- Complex calculations not available in standard Scoop analytics
- Custom scoring models
- Rolling averages with specific logic
- Multi-source data combinations
Assumption Documentation
Show the assumptions behind your analysis:
- Viewers see exactly what inputs drove the results
- Transparent methodology
- Easy to modify and re-run scenarios
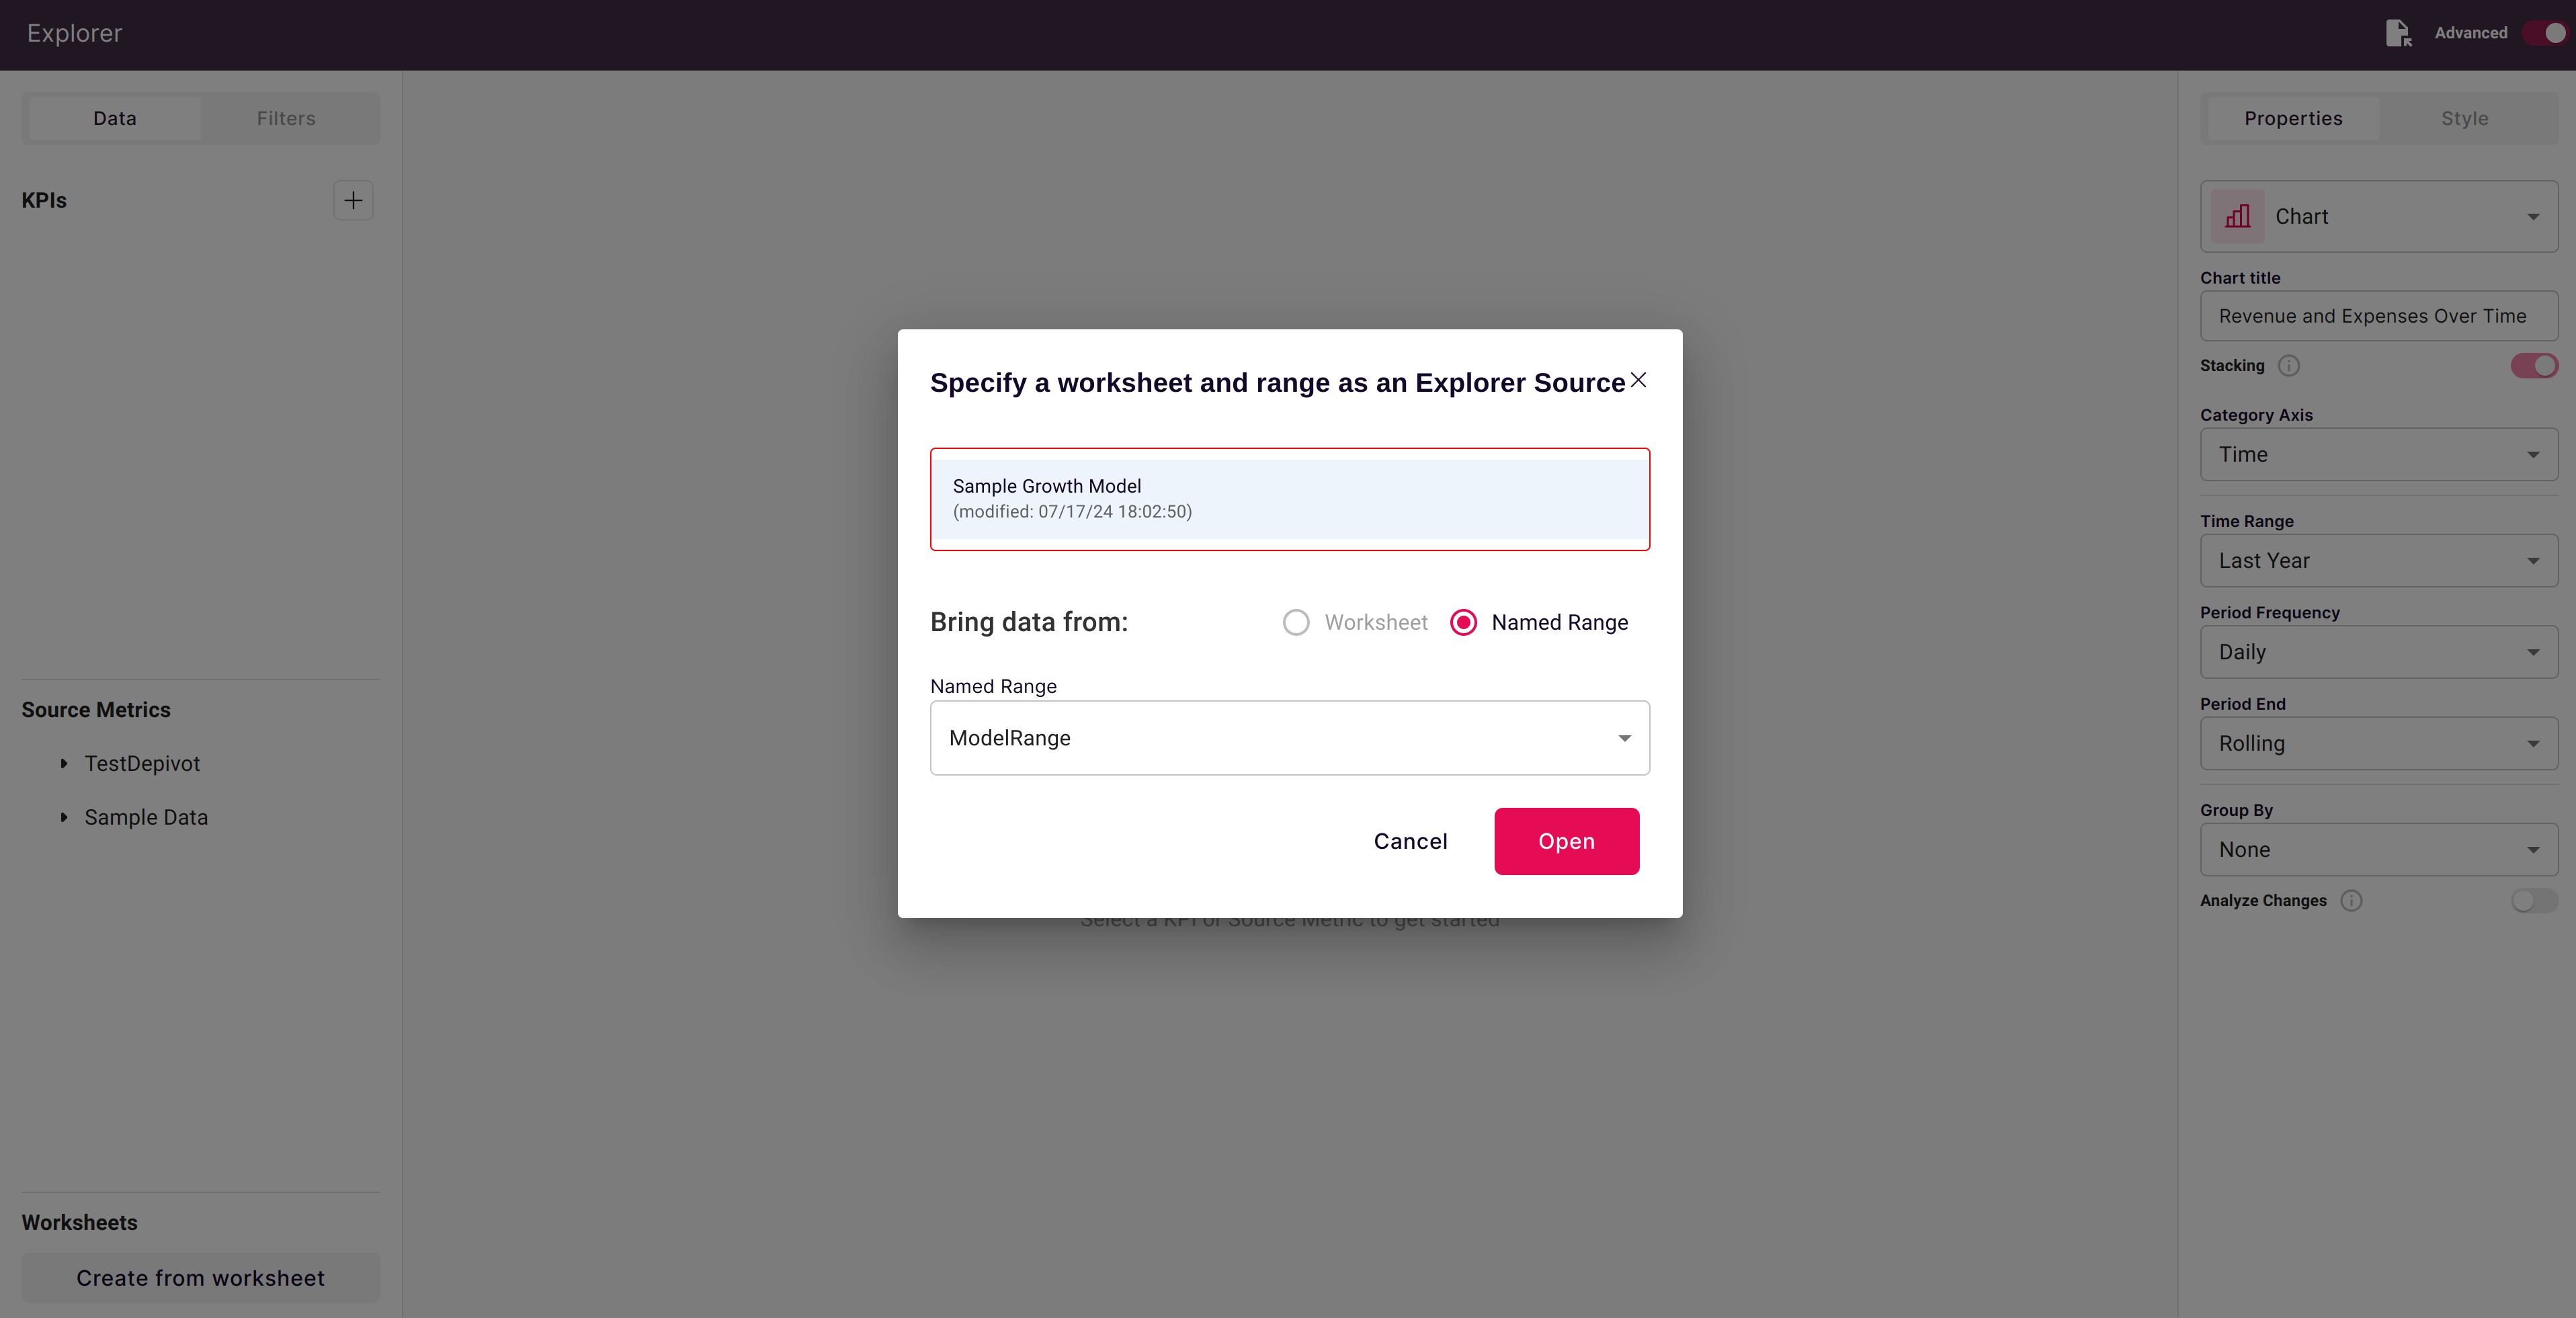
Creating Visualizations from Worksheets
From Worksheet Data
Click "Create from worksheet" to build charts from spreadsheet tables:
Data Requirements
| Requirement | Description |
|---|---|
| Headers | First row must contain column names |
| Structure | Tabular data (rows and columns) |
| Data types | Numbers for metrics, text for dimensions |
| Optional time | Include a date column for time-series charts |
Creating the Visualization
- Select the data range
- Choose which columns are metrics vs. dimensions
- Pick a chart type
- Scoop creates an interactive visualization
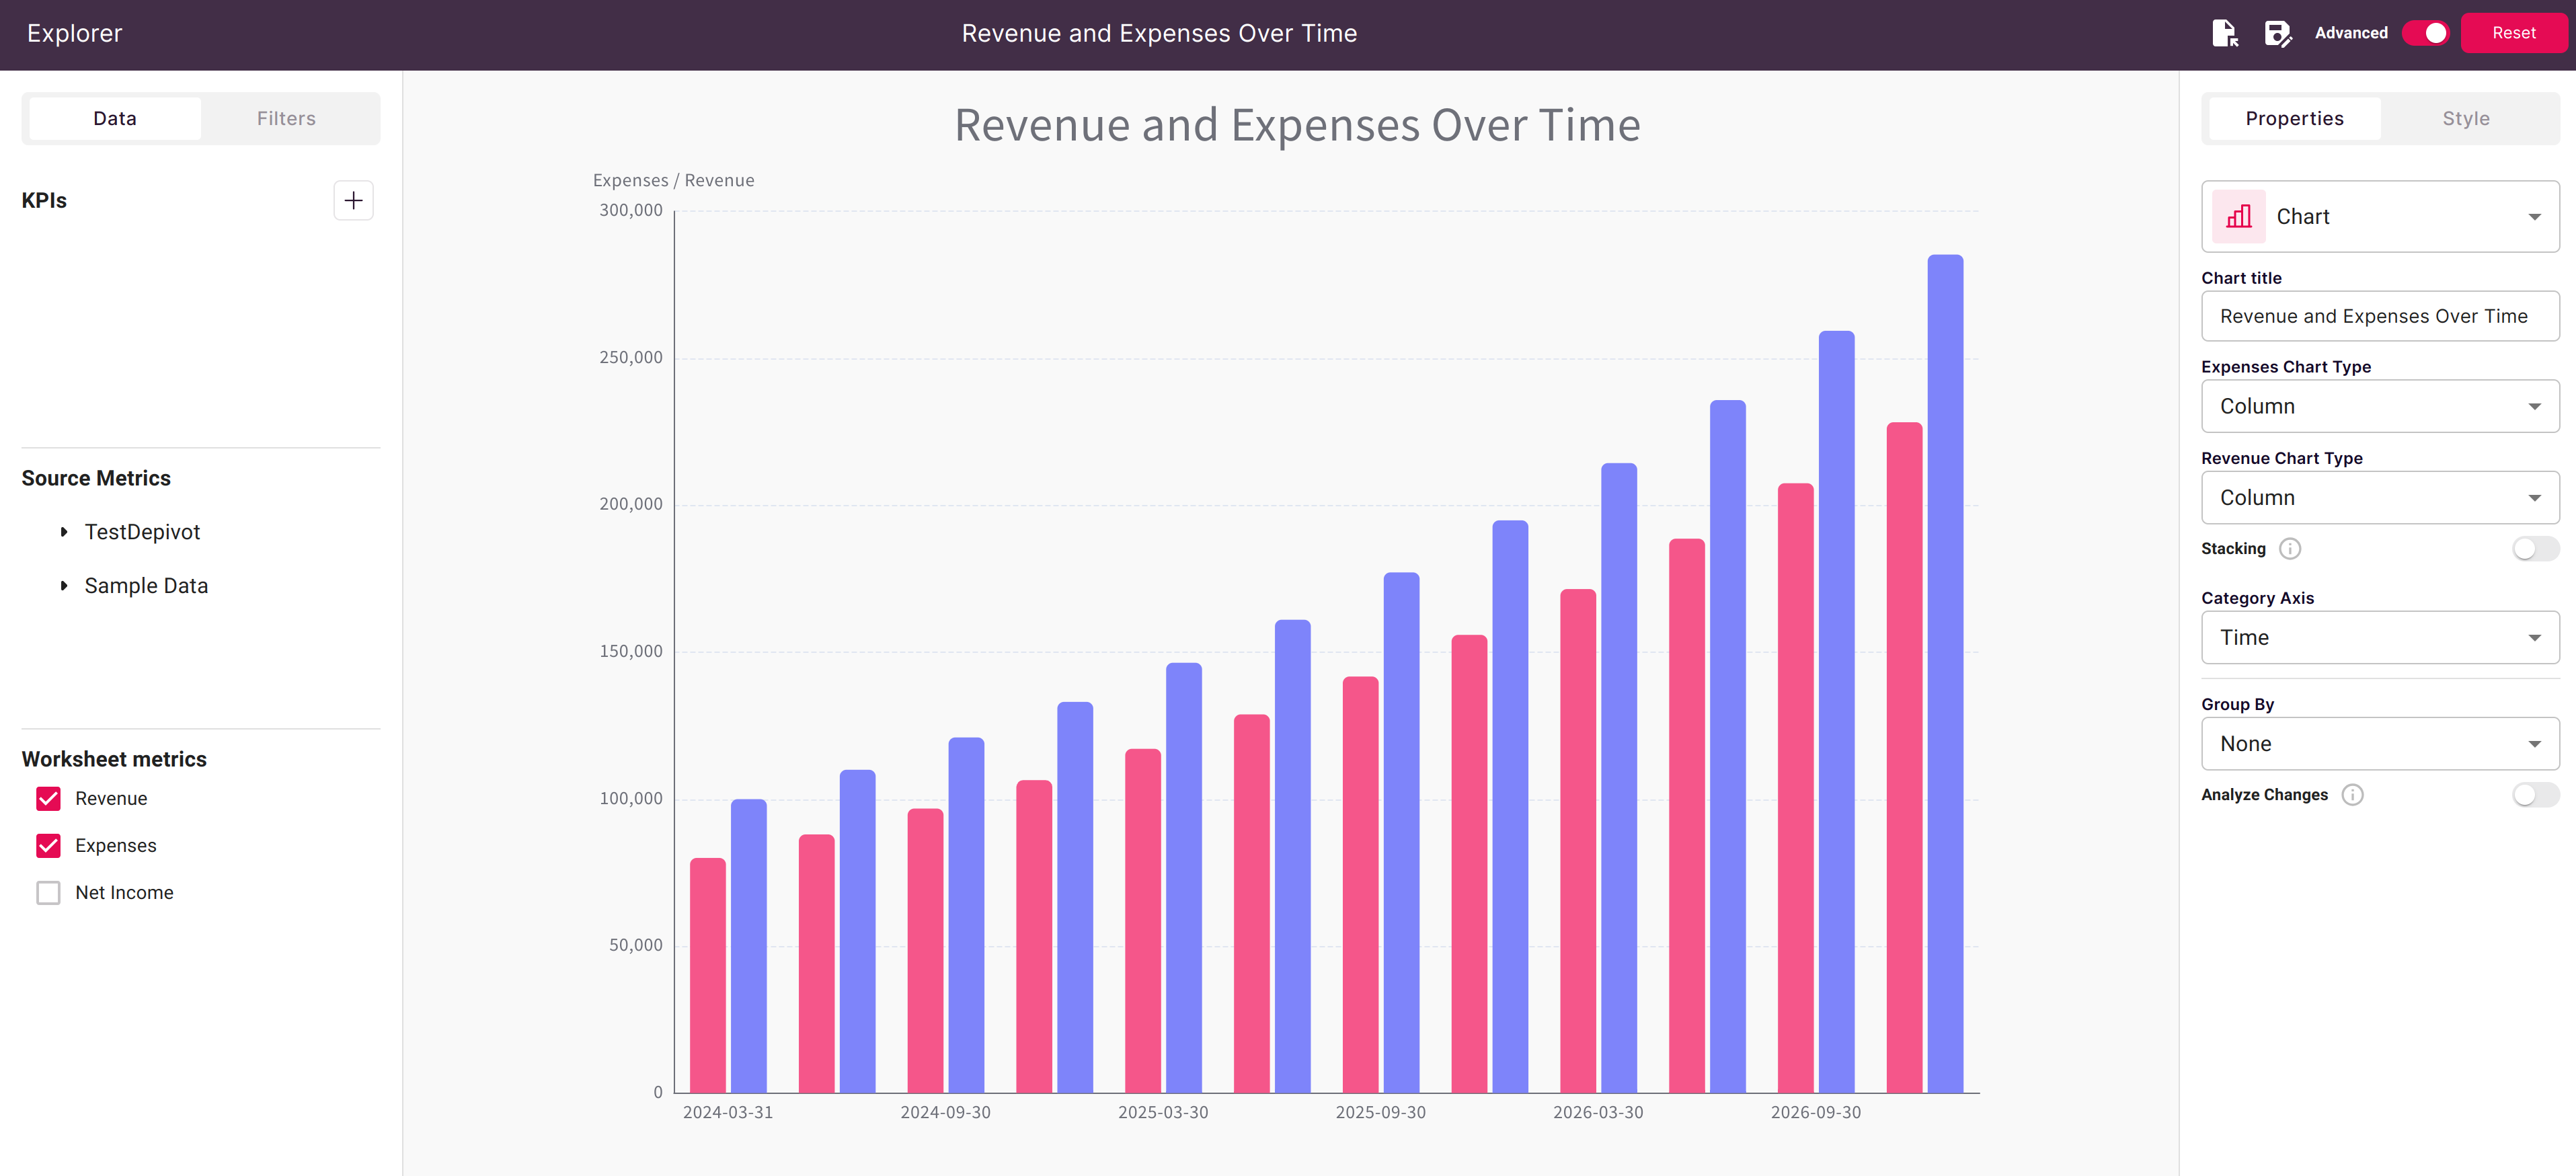
The resulting chart:
- Updates when the worksheet data changes
- Supports drilling and filtering
- Works with prompts like any other Scoop visualization
Linked Sheetlets and Charts
When a sheetlet and chart reference the same worksheet:
- Edit assumptions in the sheetlet
- Chart updates automatically
- Present live what-if scenarios
- No manual refresh needed
Connecting Sheetlets to Prompts
Sheetlets can respond to canvas prompts:
- Create a prompt on your canvas (e.g., Region selector)
- Link the sheetlet to the prompt
- When users select a region, the sheetlet can:
- Filter displayed data
- Pass the selection to worksheet formulas
- Update calculated values based on selection
This enables dynamic models where prompts drive spreadsheet calculations.
Best Practices
Worksheet Organization
- Keep editable inputs in dedicated named ranges
- Separate inputs from calculations
- Use clear, consistent naming
- Document assumptions in the worksheet
Sheetlet Sizing
- Size to show all relevant cells
- Avoid excessive scrolling
- Consider mobile viewing
- Leave room for cell editing UI
Performance
- Limit complex formulas in frequently-edited cells
- Avoid volatile functions (NOW, RAND) in visible ranges
- Keep named ranges focused (not entire sheets)
User Experience
- Label sheetlets clearly
- Indicate which cells are editable
- Group related sheetlets together
- Provide context for what each value means
Troubleshooting
Sheetlet Shows No Data
- Verify the named range exists in the worksheet
- Check that the worksheet is a Live Worksheet
- Confirm you have access to the worksheet
Edits Not Saving
- Check your Scoop session is active
- Verify you have edit permissions on the worksheet
- Look for sync conflicts (multiple simultaneous editors)
Formulas Not Calculating
- Ensure dependent cells are included in named ranges
- Check for formula errors in Google Sheets
- Verify circular references aren't blocking calculation
Display Issues
- Refresh the canvas
- Check column widths in the source worksheet
- Verify formatting is compatible
Related Topics
- Creating a Live Worksheet - Set up cloud-connected spreadsheets
- Google Sheets Plugin - Pull Scoop data into worksheets
- Prompts - Add filter controls to canvases
- What is a Canvas - Canvas overview
Updated 8 months ago