Tables and Pivot Tables
View and analyze your data in flexible tabular formats
Tables provide a direct view of your data, while pivot tables let you summarize and cross-tabulate dimensions. Both are essential tools for understanding what's in your dataset.
Data Tables
By default, when you select a table it displays your data by time (usually by snapshot or load date):
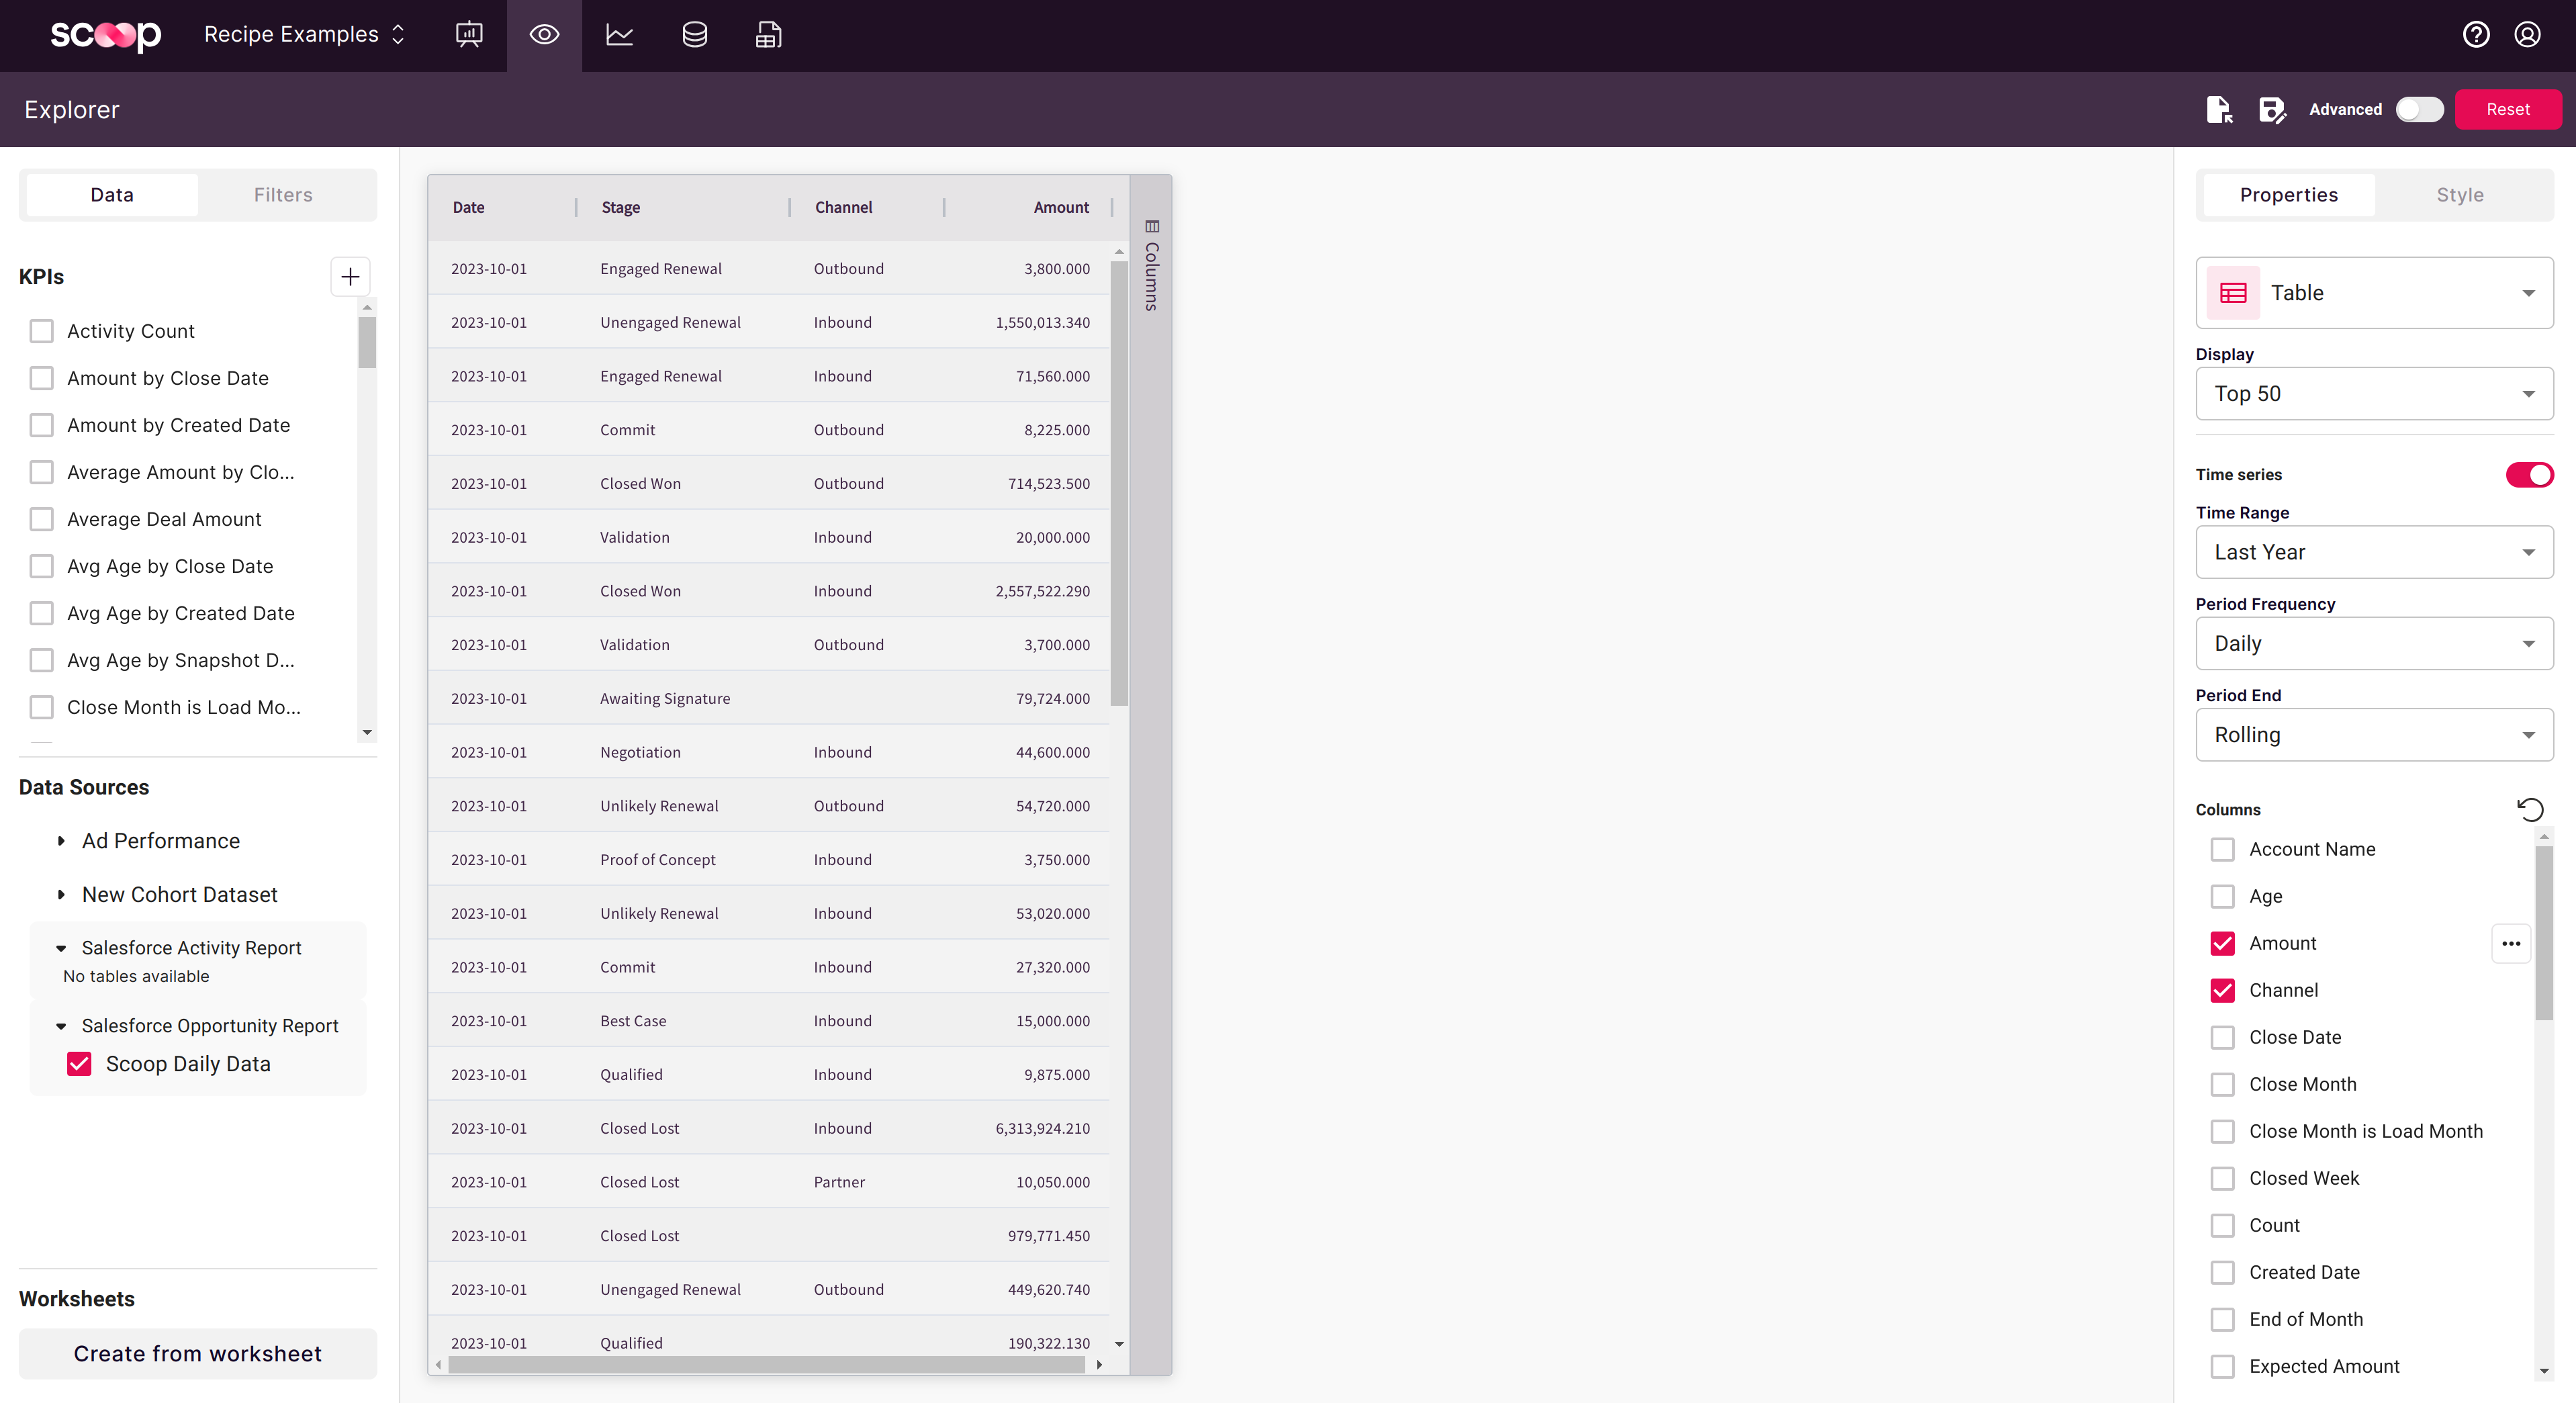
Time Series Toggle
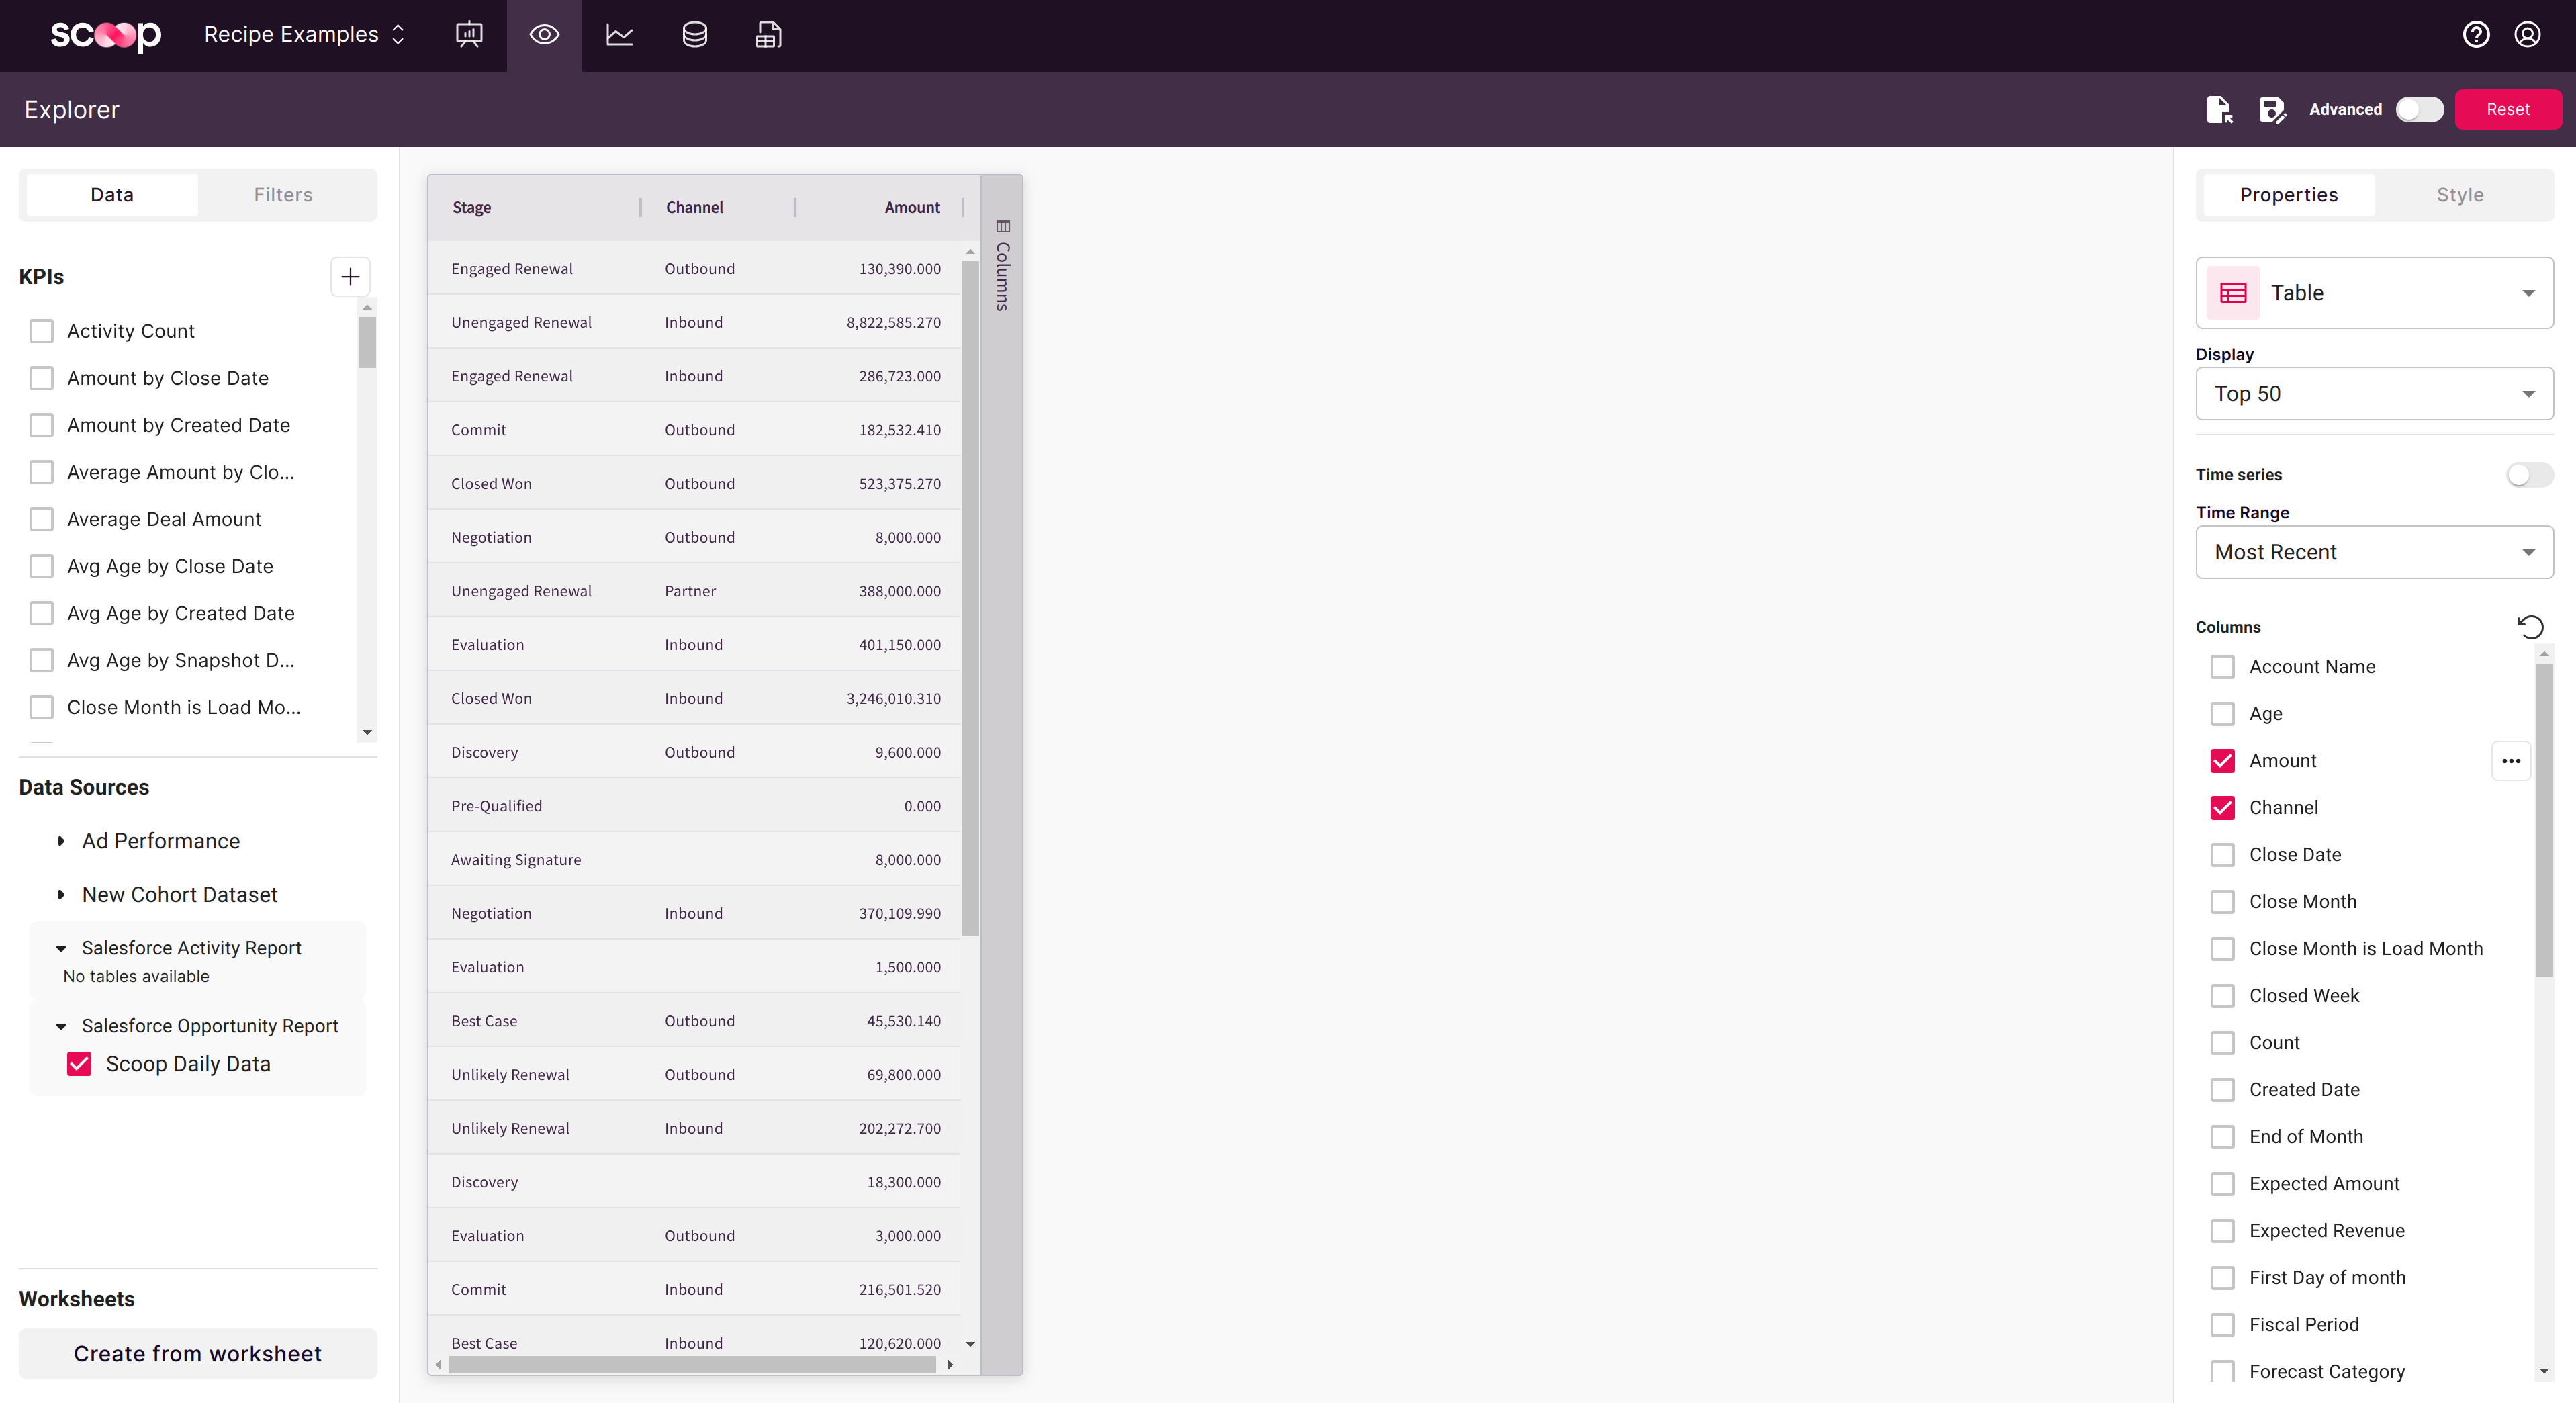
Click the Time Series slider to change how data is aggregated:
| Mode | Description |
|---|---|
| Time Series ON | Groups data by date, shows trends over time |
| Time Series OFF | Aggregates across all dates into summary |
Time Range Selection
By default the time range is set to "Most Recent", limiting to the latest load. You can extend this:
- Most Recent: Latest snapshot only
- Last 7 Days: Rolling week
- Last 30 Days: Rolling month
- Custom Range: Specify start and end dates
- All Time: Complete history
This is especially useful for non-snapshot (transactional) datasets where you want to analyze all historical records.
Table Features
| Feature | How To |
|---|---|
| Sort | Click column header |
| Multi-sort | Shift+click additional columns |
| Filter | Use Filter tab in left panel |
| Show/Hide Columns | Uncheck in column list |
| Export | Click Export button for CSV/Excel |
Pivot Tables
Pivot tables let you summarize data by grouping rows and pivoting columns. Click the table bar to the right of your table to open pivot options:
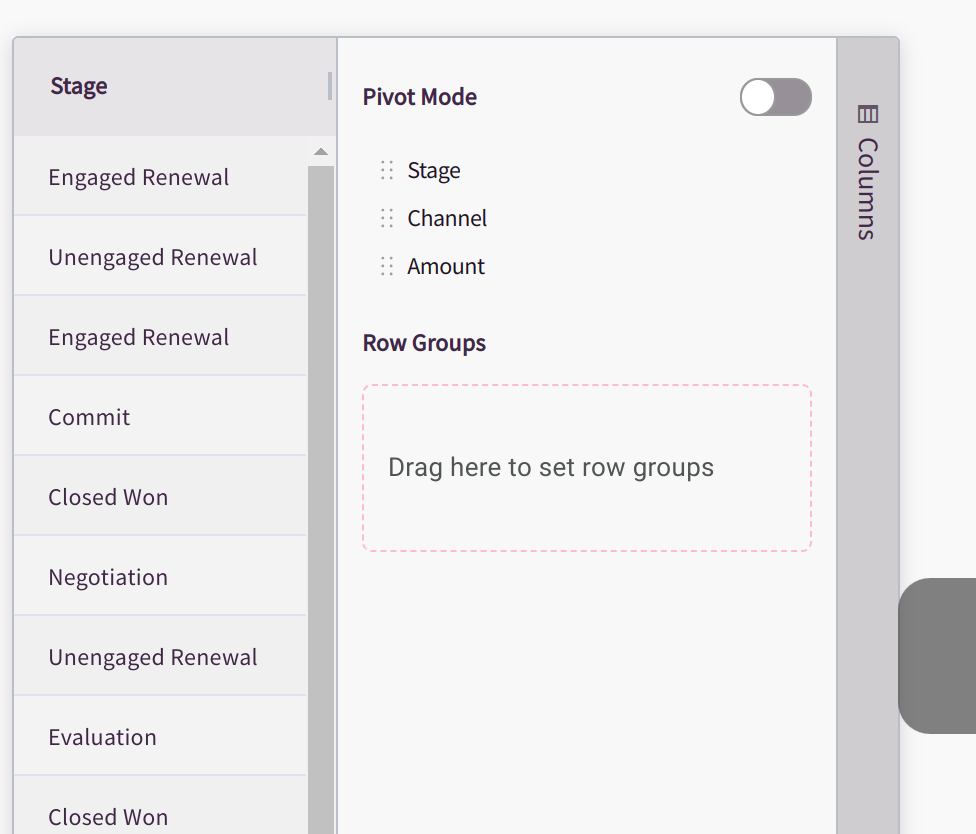
Enabling Pivot Mode
Click the Pivot Mode slider to enable two key capabilities:
- Row Grouping: Nest dimensions hierarchically
- Column Pivoting: Spread an attribute across column headers
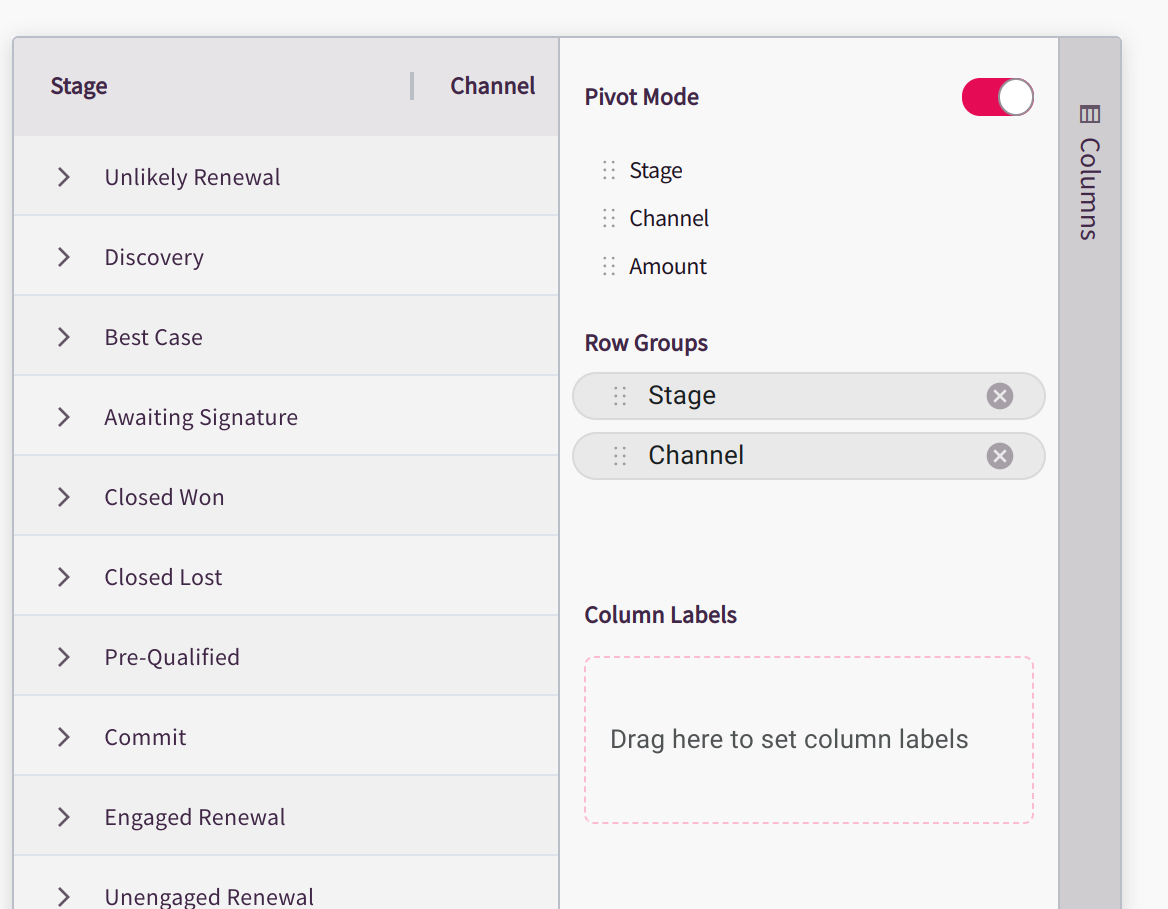
Row Grouping
With row grouping, you can expand and collapse individual items to progressively drill into your data:
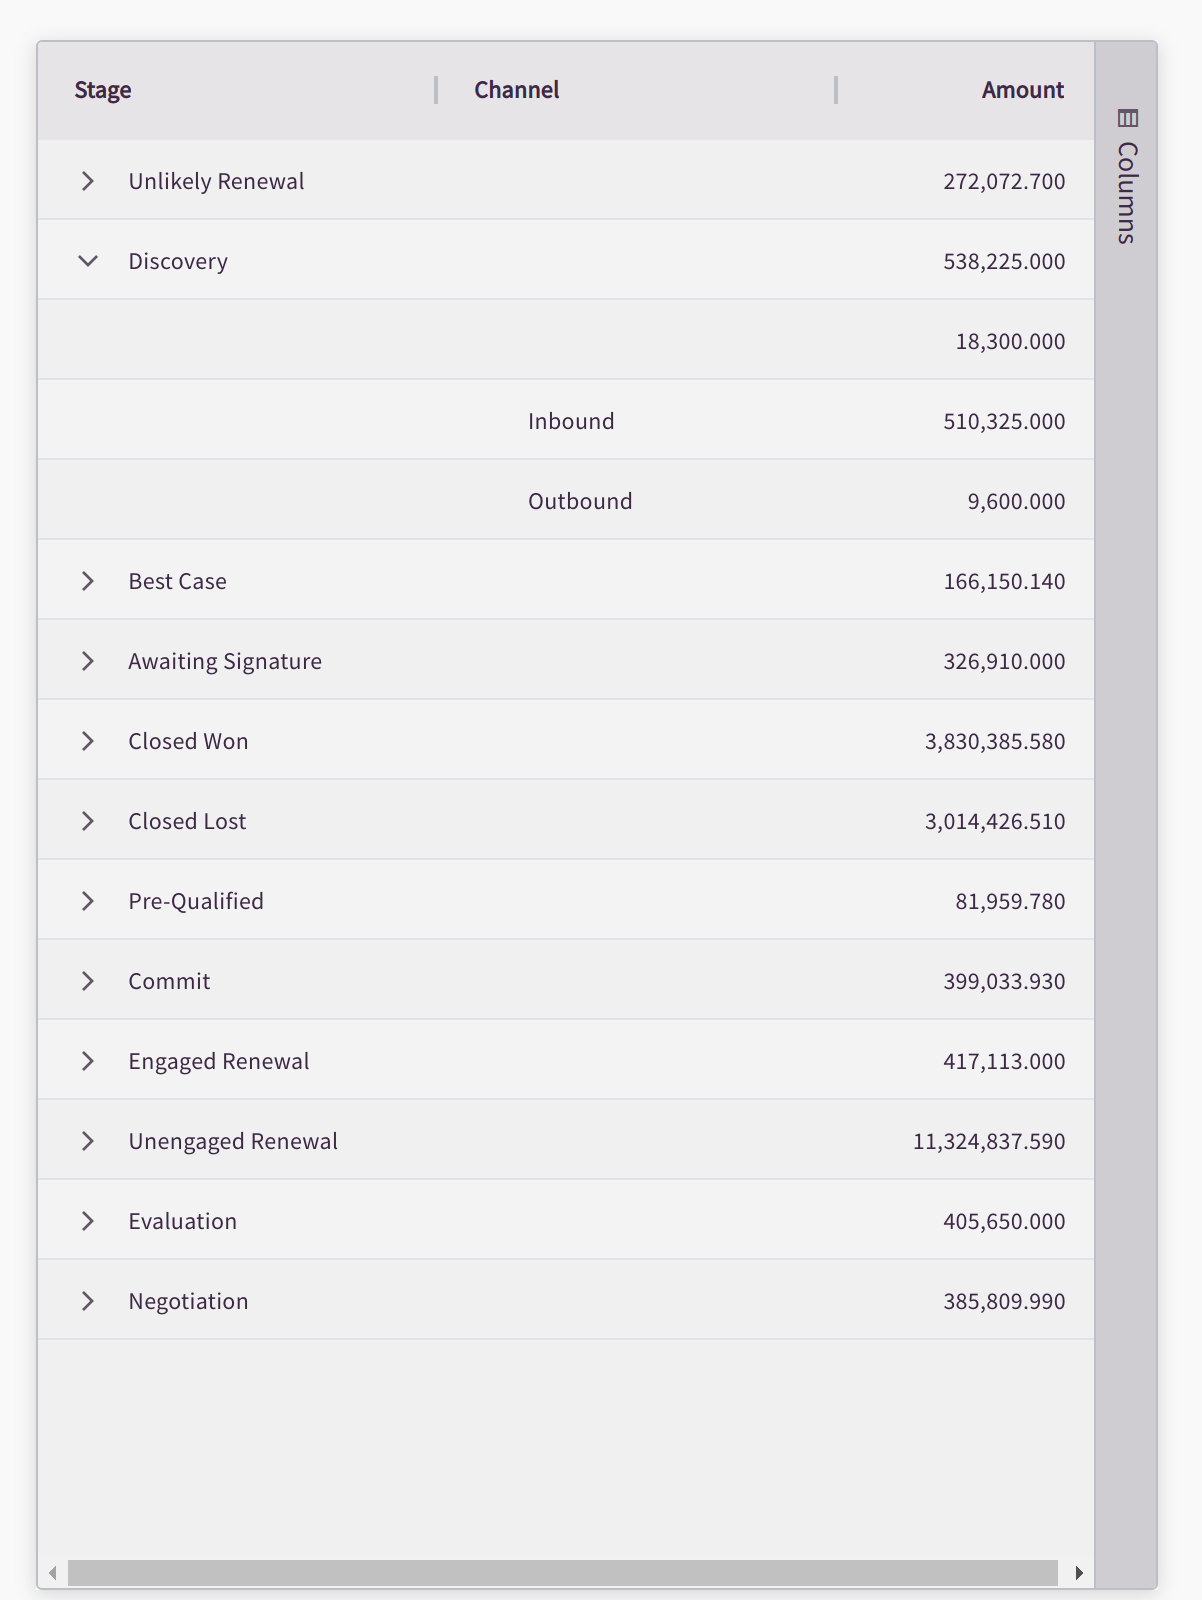
To create row groups:
- Enable Pivot Mode
- Drag columns to the row grouping area
- Order determines nesting (top = outermost)
- Click expand (+) icons to drill down
Example hierarchy:
Region (outer)
  └── State (middle)
        └── City (inner)
Column Pivoting
Drag an attribute to the column labels area to pivot it across columns. For example, dragging "Channel" creates column headers for each channel value:
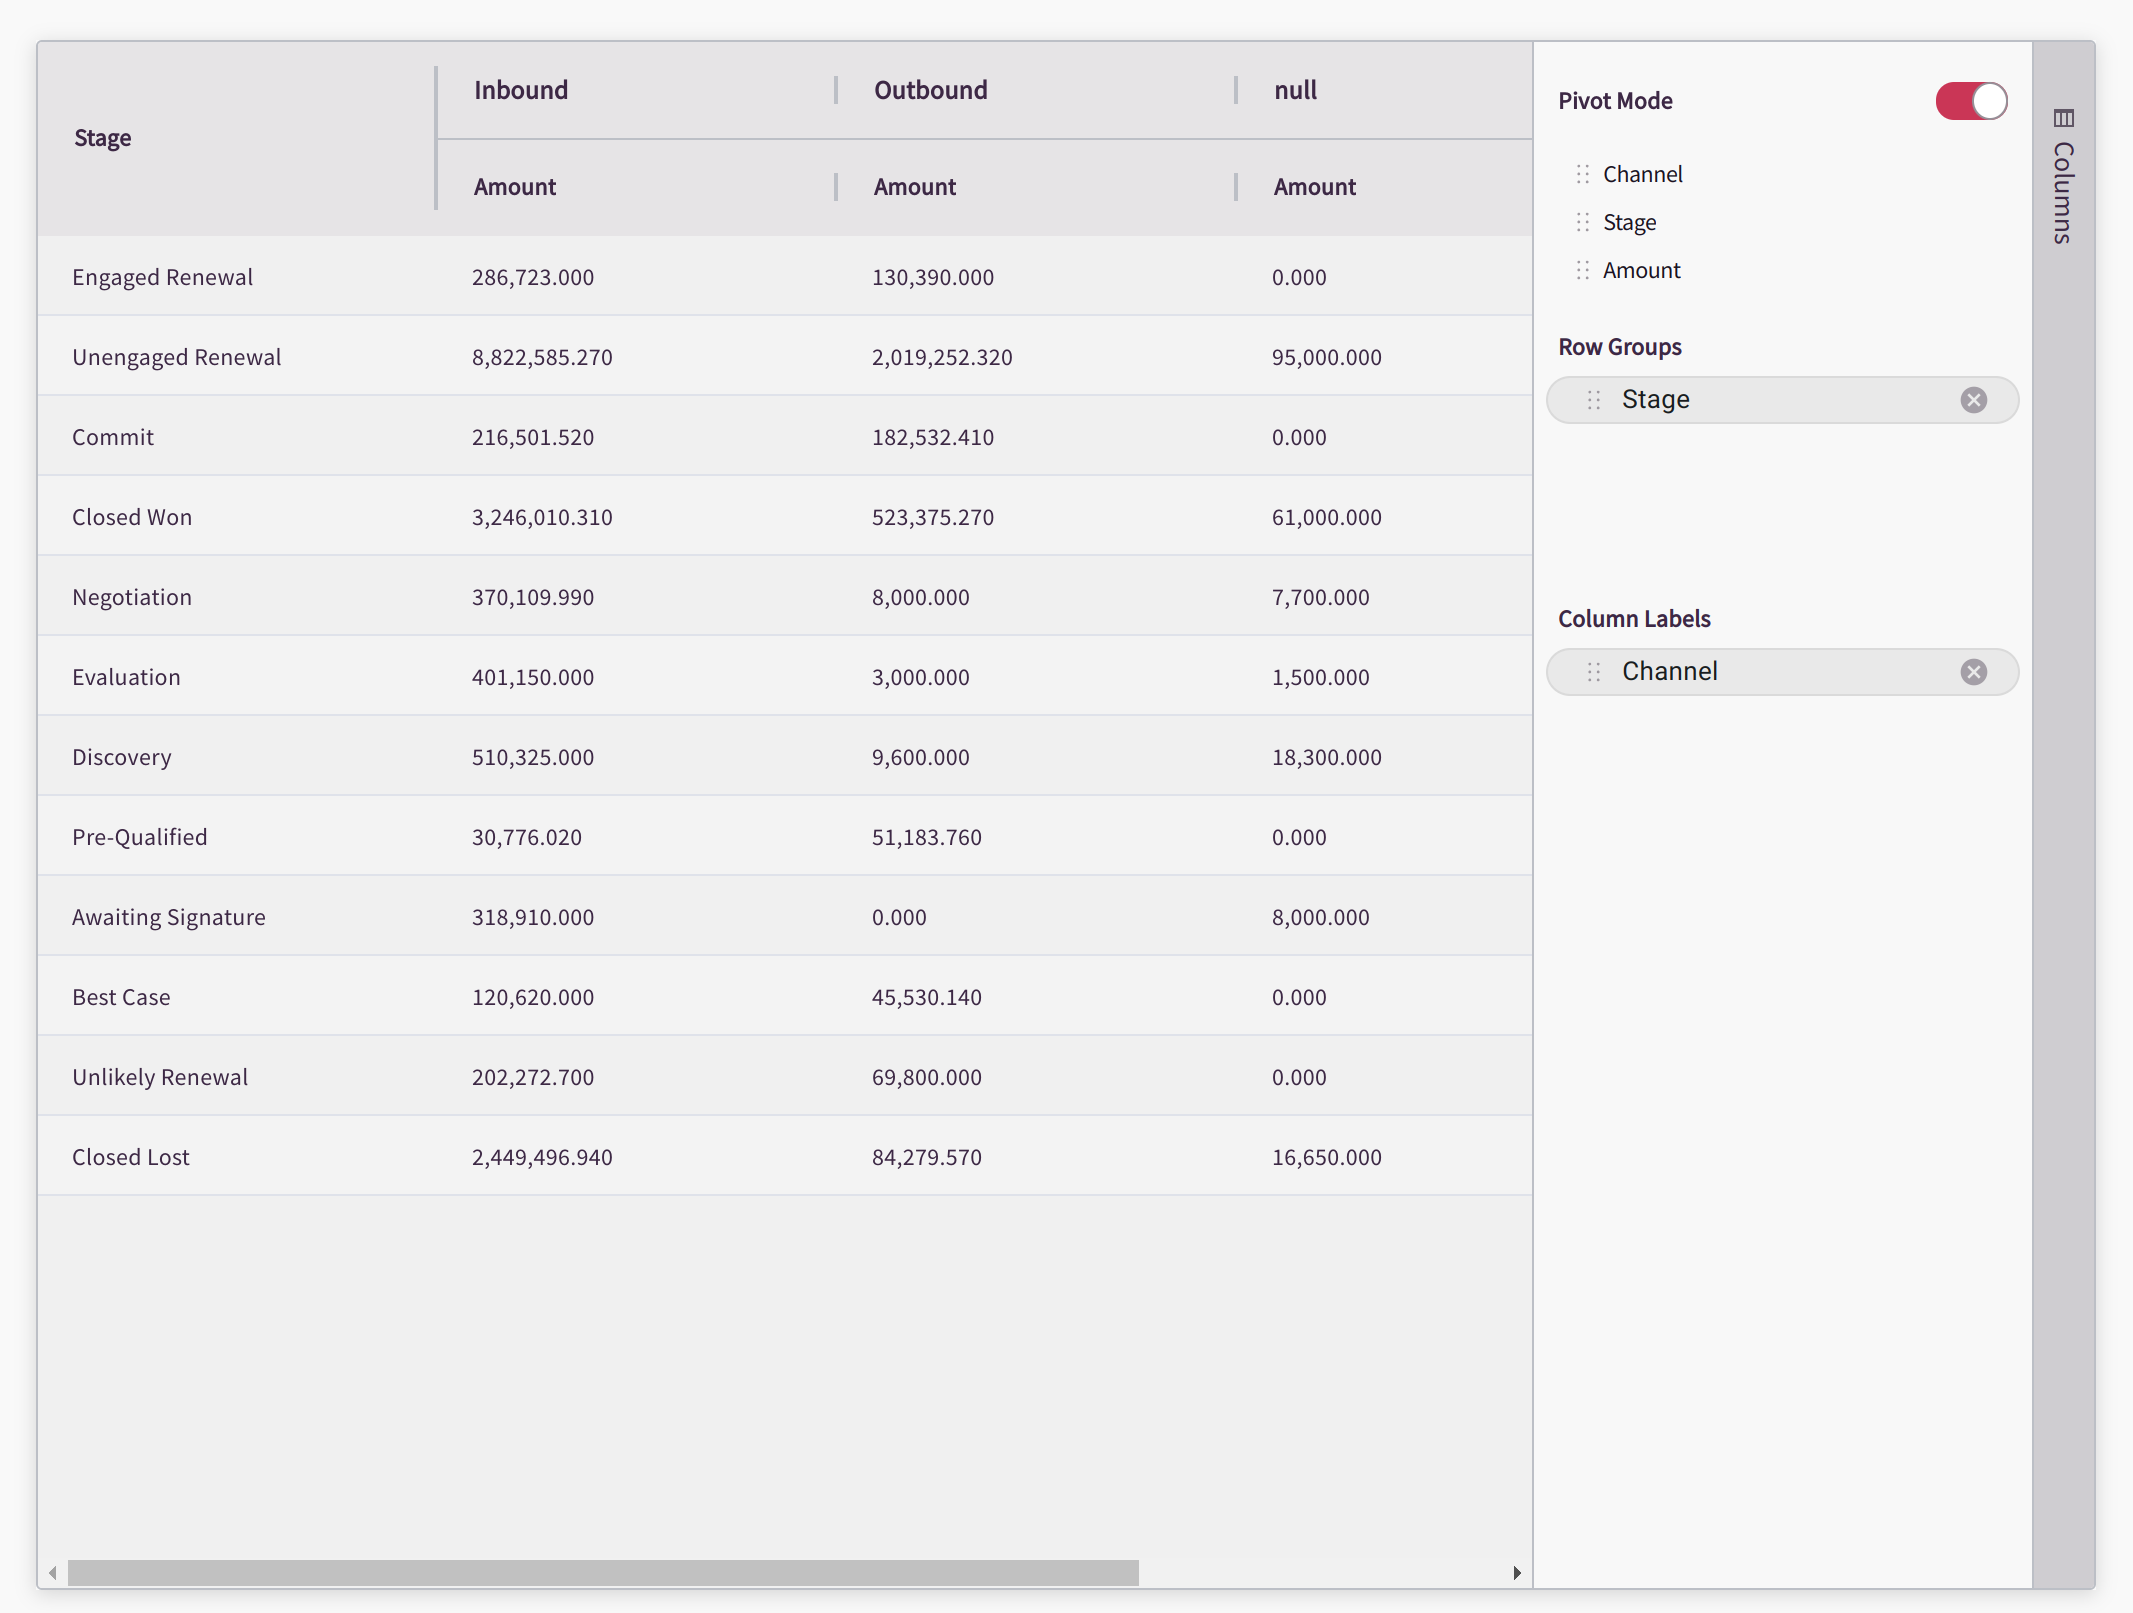
Best practices for column pivoting:
- Choose dimensions with 3-10 unique values
- High cardinality columns (100+ values) create too many columns
- Time periods (Quarter, Month) work well as column pivots
Pivot Table Metrics
At each intersection of row and column, Scoop calculates your selected metric:
| Aggregation | Best For |
|---|---|
| Sum | Revenue, quantities, totals |
| Count | Number of records |
| Average | Rates, percentages, scores |
| Min/Max | Ranges, outliers |
| Distinct | Unique counts |
Common Pivot Patterns
Sales by Region and Quarter
Configuration:
- Row Groups: Region, Rep
- Column Pivot: Quarter
- Value: Sum of Revenue
Result:
                Q1        Q2        Q3        Q4
West        $450K     $520K     $480K     $610K
  Sarah     $180K     $210K     $190K     $240K
  Mike      $150K     $170K     $160K     $200K
  Lisa      $120K     $140K     $130K     $170K
Central     $380K     $410K     $420K     $520K
Pipeline by Stage and Owner
Configuration:
- Row Groups: Stage
- Column Pivot: Owner
- Value: Sum of Amount, Count of Deals
Result: See pipeline distribution across reps at each stage
Conversion by Source and Month
Configuration:
- Row Groups: Lead Source
- Column Pivot: Month
- Value: Count of Leads, Count of Customers, Conversion Rate
Result: Track which sources convert best over time
Working with Large Datasets
Performance Tips
- Filter first: Narrow data before pivoting
- Limit dimensions: Use Top N for high-cardinality columns
- Date rollups: Group by month vs day
- Pre-aggregate: Create blended datasets for common analyses
Row Limits
| Context | Limit |
|---|---|
| Preview | 1,000 rows |
| Full view | Up to 10,000 rows |
| Export | Unlimited |
Exporting Tables
Export Options
Click Export to download:
| Format | Use For |
|---|---|
| CSV | Data processing, imports |
| Excel | Offline analysis, pivot tables |
Export includes:
- Current filters
- Sorting
- All visible columns
- Full data (not just visible rows)
Adding to Canvases
To embed tables in presentations:
- Configure your table in Explorer
- Click Save and name it
- Open your canvas
- Add the saved table as an object
- Table updates when data syncs
Troubleshooting
Table Shows No Data
- Check active filters
- Verify time range includes data
- Confirm dataset has synced
- Look at column selection
Pivot Totals Don't Match
- Check for null values in grouping columns
- Verify aggregation type
- Some rows may be excluded by filters
- Compare to ungrouped table view
Slow Performance
- Add filters to reduce data
- Limit pivot dimensions
- Use monthly vs daily grouping
- Consider pre-aggregated datasets
Related Topics
- Filtering Data - Narrow your results
- Charting Time Series Data - Visualize trends
- Non-Time Series Data - Aggregate analysis
- Visual Themes - Style your tables
Updated 7 months ago