Importing a Powerpoint or Slides Presentation
Transform static slides into live, data-driven presentations
Transform your existing PowerPoint presentations into live, data-driven canvases. Scoop imports your slides while preserving formatting, then lets you layer interactive visualizations directly on top—creating presentations that update automatically with fresh data.
Why Import Presentations?
| Benefit | Description |
|---|---|
| Preserve branding | Keep your company's slide templates and styling |
| Add live data | Layer real-time charts and KPIs on familiar slides |
| Reduce maintenance | One source updates automatically |
| Enable interactivity | Drill into data during presentations |
| Collaborate in Google Slides | Edit content in either platform |
Importing a Presentation
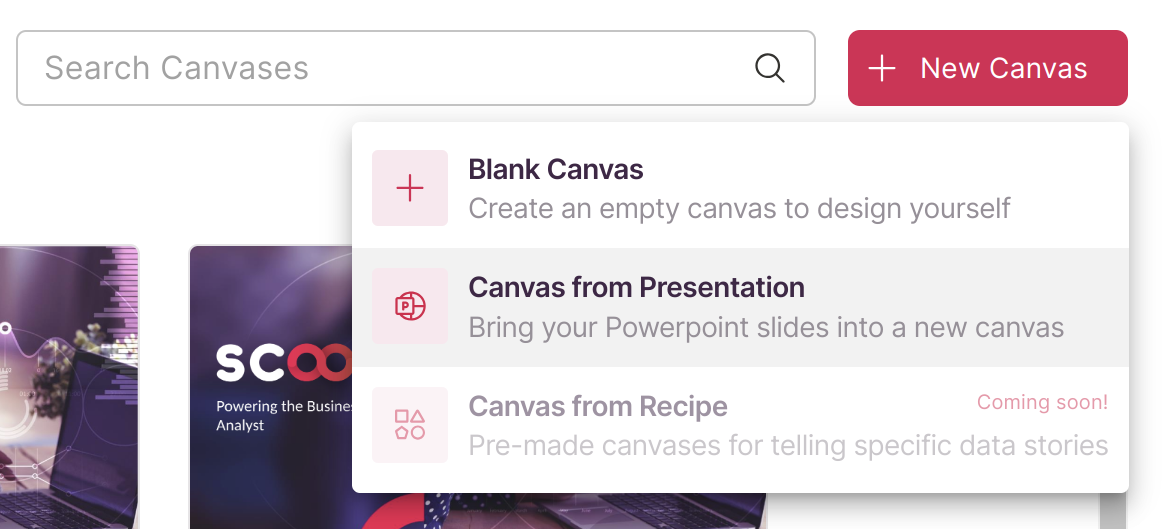
Step 1: Start Import
- Go to the Canvas Navigator
- Click New Canvas
- Select Canvas from Presentation
Step 2: Upload Your File
Upload a .pptx file from your computer. Scoop imports:
| Element | Preserved? |
|---|---|
| Master slides | ✅ Yes |
| Layouts | ✅ Yes |
| Backgrounds | ✅ Yes |
| Images | ✅ Yes |
| Diagrams | ✅ Yes |
| Text | ✅ Yes |
| Tables | ✅ Yes |
| Animations | ❌ Not supported |
| Embedded videos | ❌ Re-add in Scoop |
Step 3: Review Results
After import:
- Each PowerPoint slide becomes a Scoop frame
- A Google Slides copy is created automatically
- Color themes are extracted for use in visualizations
Working with Imported Slides
Slides as Backgrounds
Imported slides serve as backgrounds for your frames. You can:
- Edit text directly in Scoop
- Move and resize elements
- Delete unnecessary items
- Add Scoop visualizations on top
Adding Live Data
Layer Scoop elements over your slides:
┌─────────────────────────────────────────────┐
│ Your imported PowerPoint slide (background) │
│  ┌──────────────────┐  ┌────────────────┐   │
│  │  Scoop Chart     │  │   Scoop KPI    │   │
│  │  (live data)     │  │   (live data)  │   │
│  └──────────────────┘  └────────────────┘   │
│                                             │
│  [Original slide text and graphics]         │
└─────────────────────────────────────────────┘
Elements you can add:
- Charts and tables from your datasets
- KPI summaries with real-time values
- Sheetlets from Live Worksheets
- Prompts for filtering
Editing in Google Slides
Every imported presentation syncs with Google Slides:
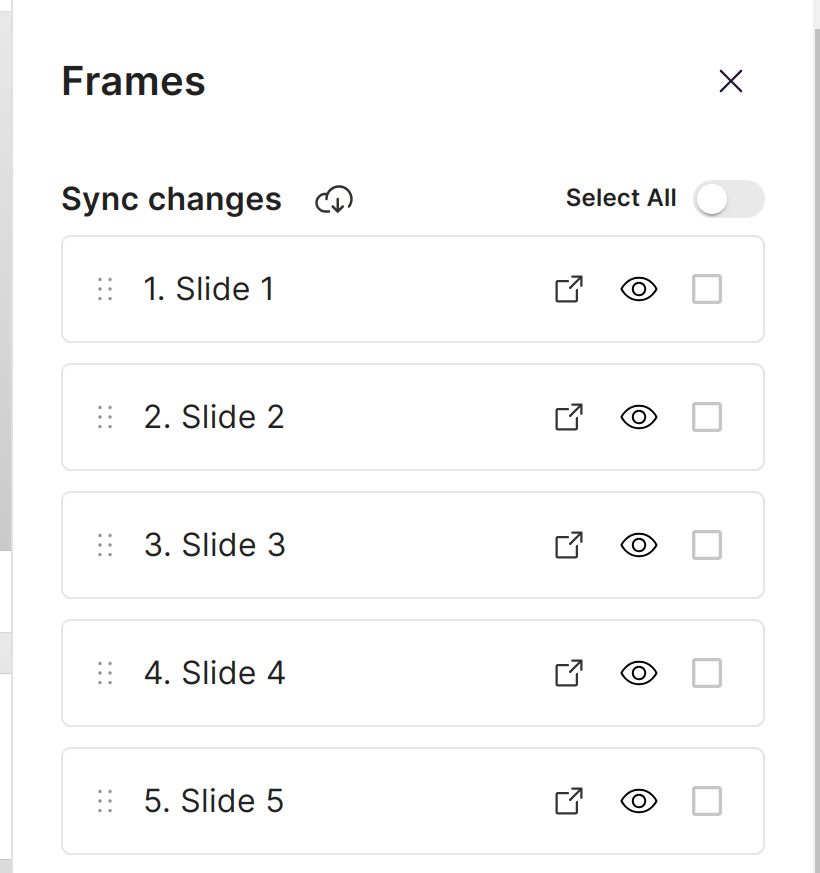
- Open Manage Frames in Scoop
- Click the link next to any slide to open it in Google Slides
- Edit in Google Slides
- Sync changes back to Scoop
Managing Frames
The Manage Frames window provides:
| Feature | Description |
|---|---|
| Google Slides link | Open each slide directly in Google Slides |
| Hide/Unhide | Show or hide slides in presentation |
| Synchronize | Pull latest changes from Google Slides |
| Reorder | Change slide sequence |
| Delete | Remove individual frames |
Synchronizing Changes
To update slides from Google Slides:
- Make edits in Google Slides
- Open Manage Frames in Scoop
- Select slides to synchronize
- Click Sync Selected
- Scoop re-imports those slides with your changes
Note: Synchronization replaces the slide background—any Scoop elements you've added remain in place.
Color Theme Import
Scoop extracts color themes from your presentation:
Automatic Import
Colors from your PowerPoint theme are available for:
- Chart colors
- KPI backgrounds
- Text highlighting
- Shape fills
AI-Generated Colors
Scoop also analyzes your presentation and suggests complementary colors using AI. See AI Generated Color Themes for details.
Using Imported Colors
When creating visualizations:
- Open the color picker
- Look for "Presentation Colors" section
- Select colors that match your slides
Best Practices
Before Import
- Simplify complex animations — They won't transfer
- Use standard fonts — Or ensure fonts are available
- Optimize images — Large images slow loading
- Consider layout — Leave space for data elements
After Import
- Add visualizations strategically — Don't overcrowd
- Use consistent placement — Data in same location across slides
- Test interactivity — Ensure drilling works
- Verify colors match — Adjust if needed
For Ongoing Updates
- Edit in Google Slides — For slide content changes
- Edit in Scoop — For data visualization changes
- Sync regularly — Keep both platforms in sync
- Document which slides have data — For team awareness
Common Workflows
Monthly Report Updates
- Import standard monthly template once
- Add live data visualizations
- Data updates automatically each month
- Sync template changes from Google Slides as needed
Executive Presentations
- Import branded executive template
- Add KPIs and charts with live data
- Present with current numbers
- Drill into details during Q&A
Sales Decks
- Import sales presentation template
- Add pipeline and performance charts
- Customize per client with prompts/filters
- Share with preset filters for each region
Troubleshooting
Fonts Look Different
- Check if fonts are web-safe or installed
- Consider using standard fonts in original
- Scoop substitutes unavailable fonts
Images Not Displaying
- Verify images were embedded, not linked
- Check image file sizes
- Re-add problematic images in Scoop
Layout Shifted
- Complex layouts may need adjustment
- Use Scoop's alignment tools
- Consider simplifying original slides
Colors Don't Match
- Check color theme was imported
- Verify using RGB values
- Manually set colors if needed
Related Topics
- AI Generated Color Themes - Automatic color matching
- What is a Canvas - Canvas overview
- Presenting a Canvas - Presentation mode
- Drawing Objects - Adding visual elements
Updated 7 months ago