KPIs (Key Performance Indicators) in Scoop are reusable metrics that go beyond default aggregations. Create precise calculations, combine data across datasets, and build sophisticated business metrics using familiar spreadsheet formulas.
| Capability | Benefit |
|---|
| Custom aggregations | Sum, count, average, min, max with filters |
| Time-shifted metrics | Compare to prior periods automatically |
| Cross-dataset calculations | Combine metrics from different sources |
| Reusability | Define once, use in any visualization |
| Drill-down | Click KPI values to see underlying data |
| Type | Description | Example |
|---|
| Dataset KPI | Aggregates a single column with custom rules | Sum of Amount where Stage = Won |
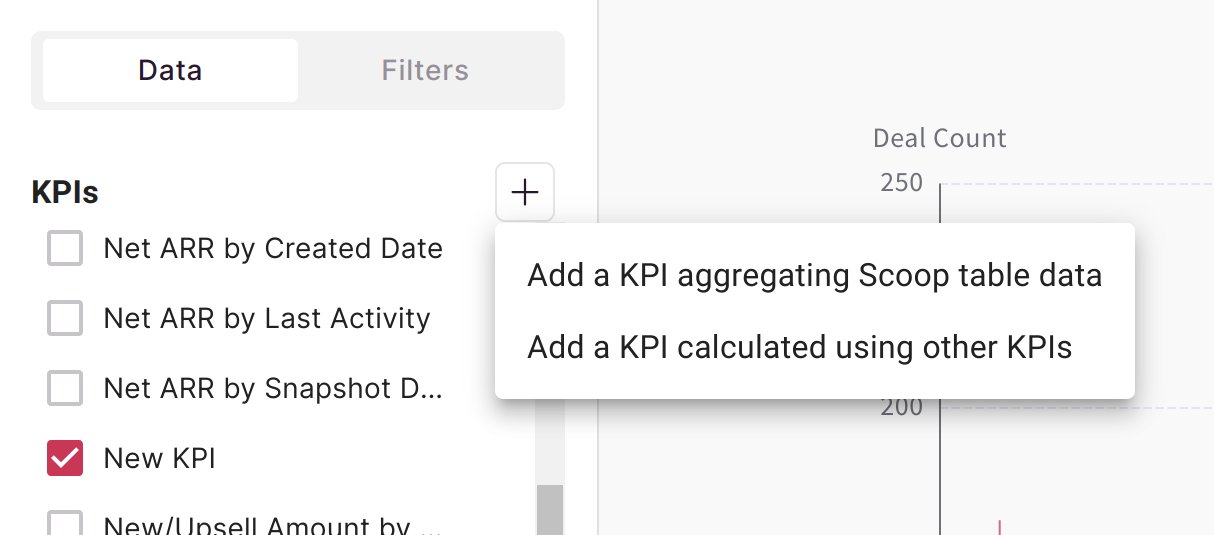
| Compound KPI | Formula combining other KPIs | Win Rate = Won Deals / Total Deals |
Click the plus icon next to the KPIs header in the left panel:
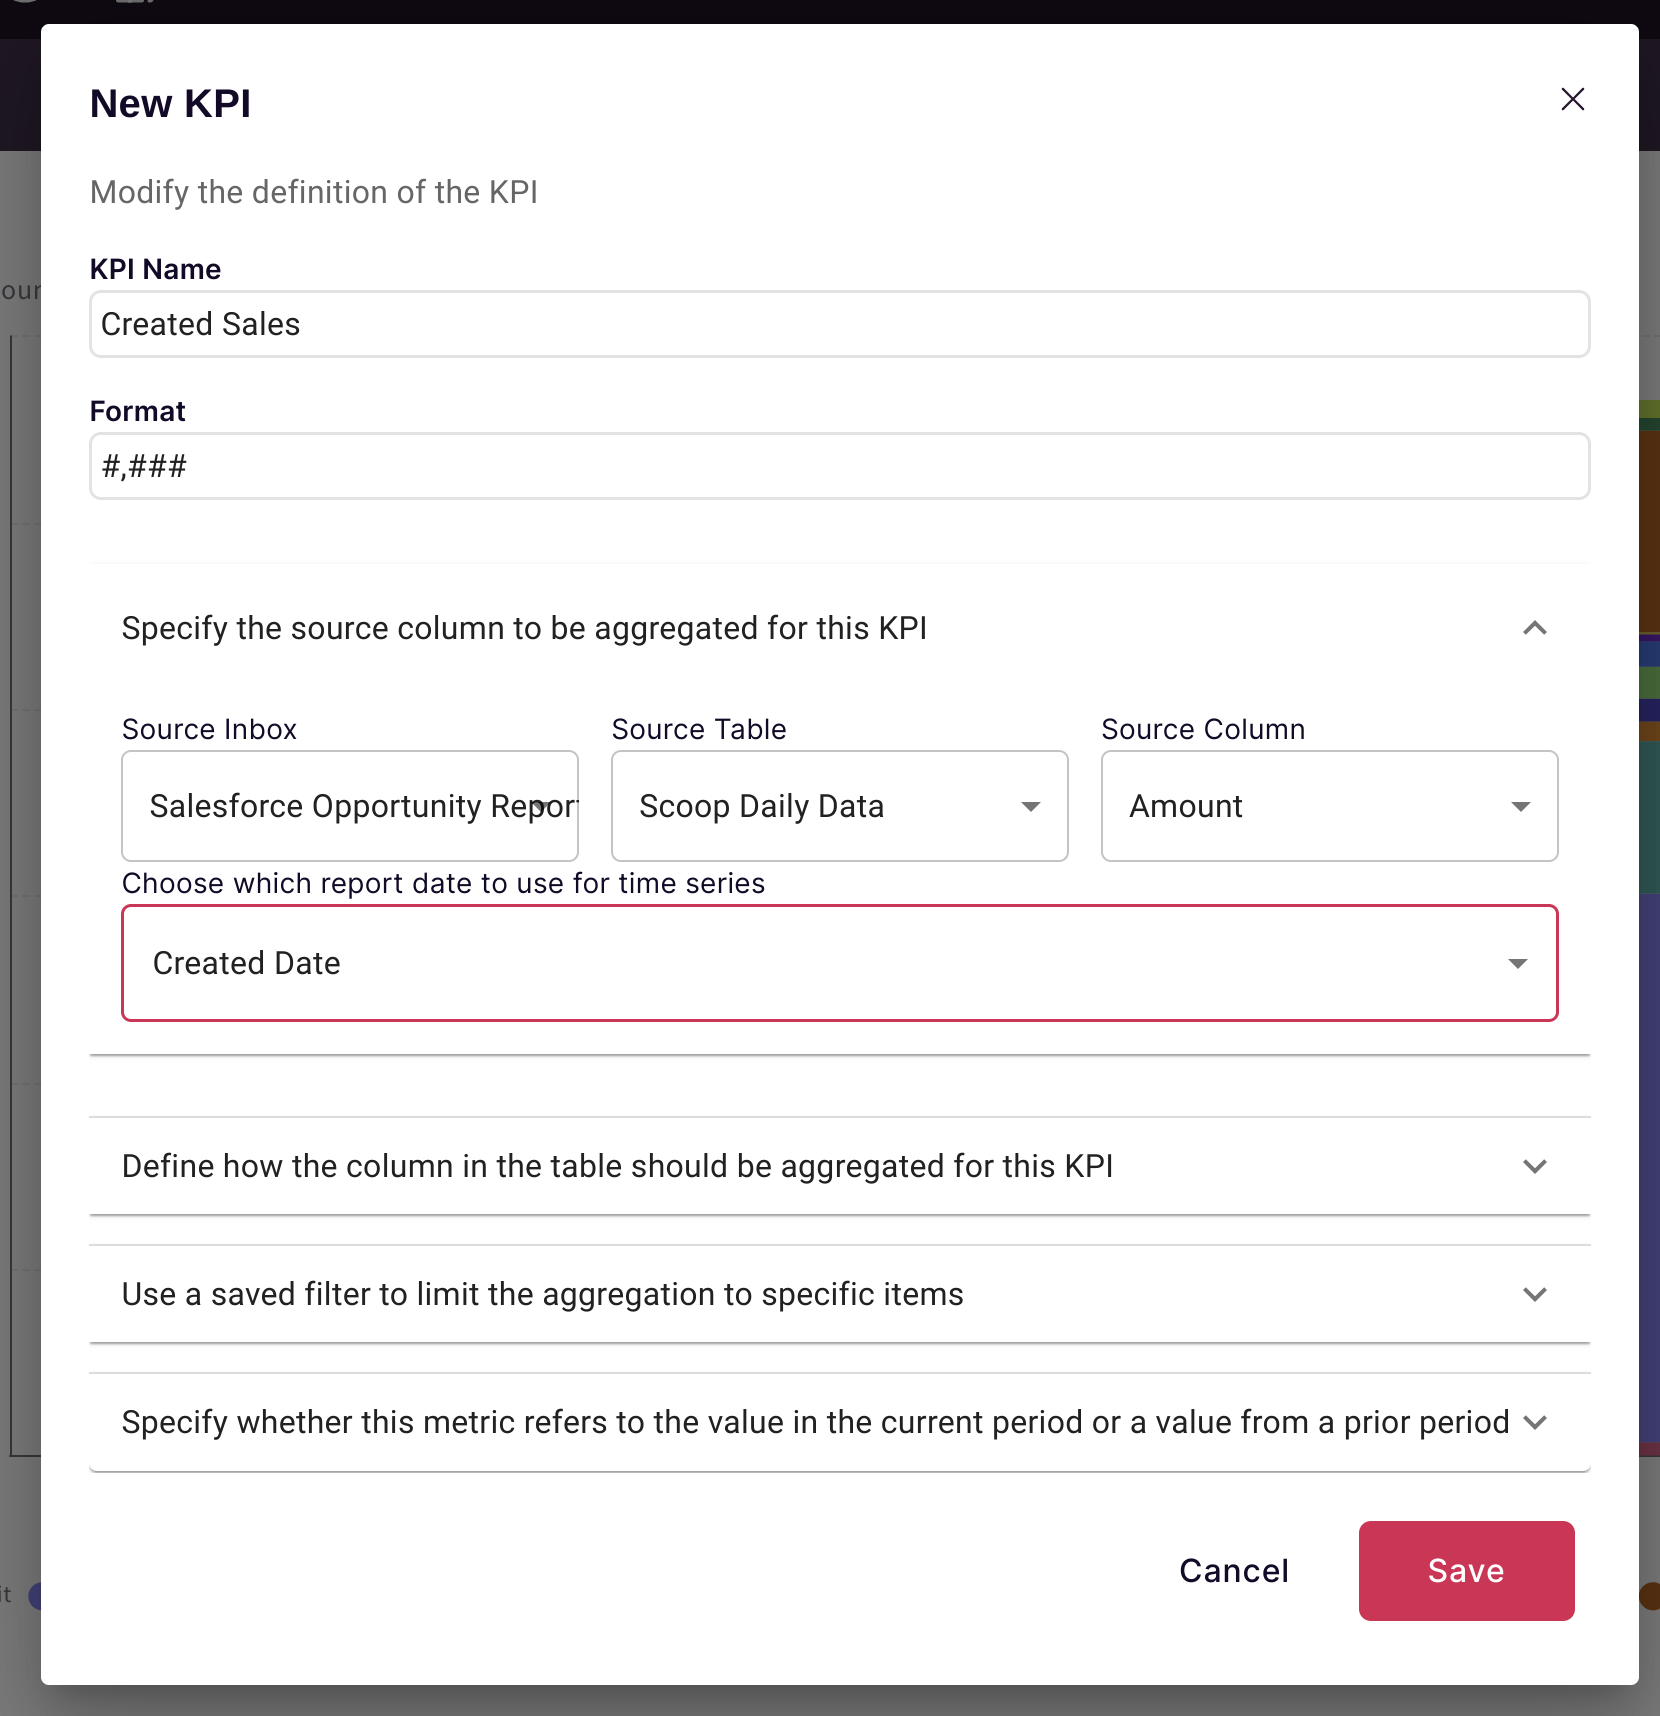
Dataset KPIs aggregate a column from a specific dataset with precise control over how the aggregation works.
| Setting | Description |
|---|
| Name | Descriptive name for the KPI |
| Dataset | Which dataset to aggregate |
| Column | Which numeric column to calculate |
| Date Column | Which date to use for time-based analysis |
| Aggregation | When to Use | Example |
|---|
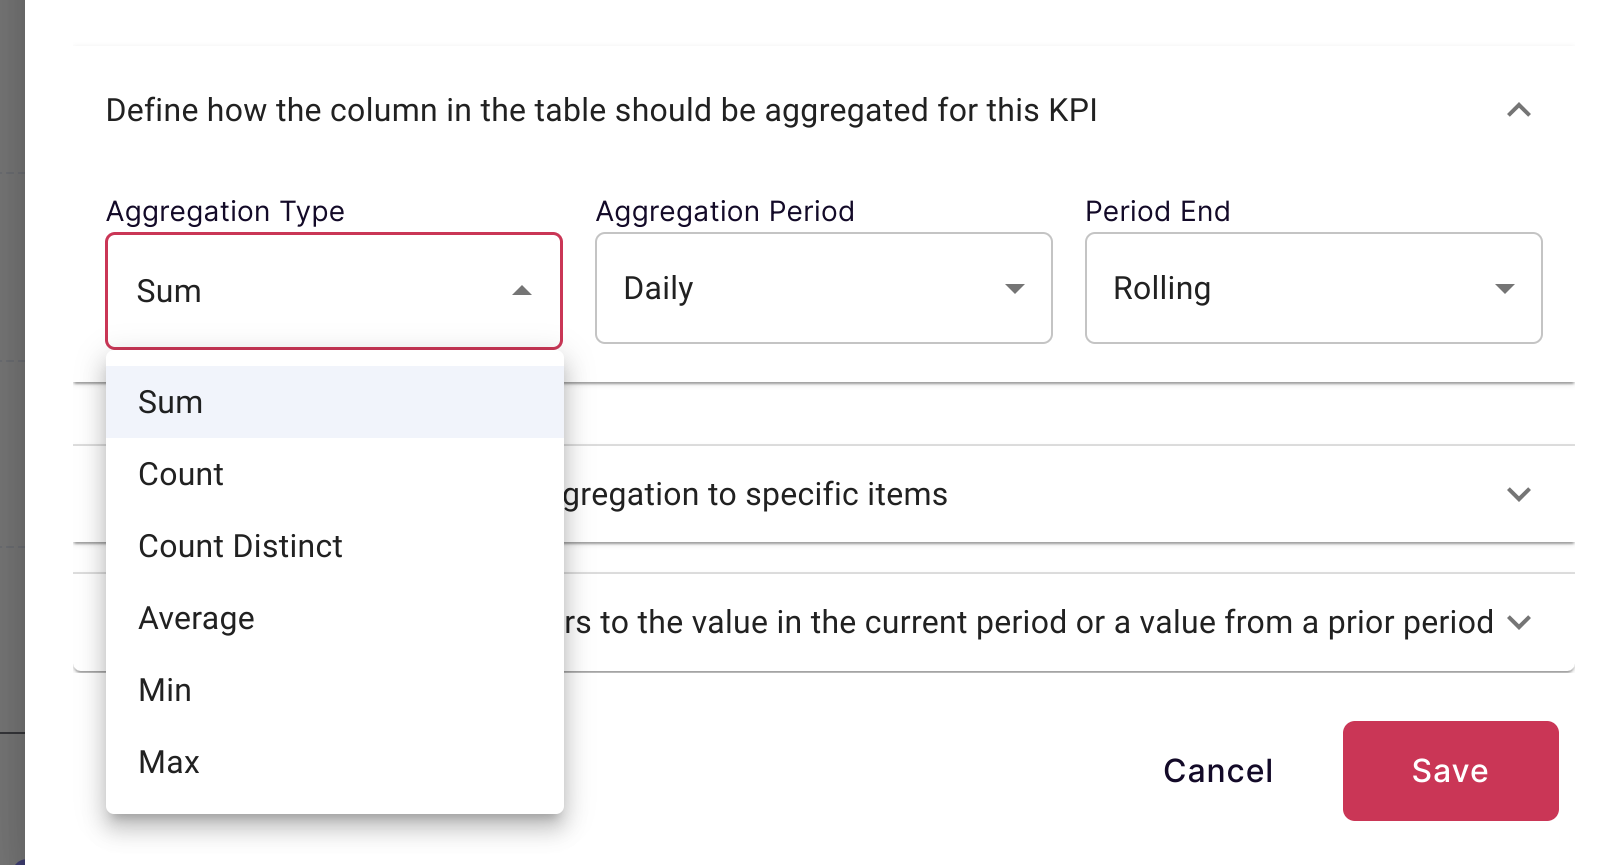
| Sum | Total values | Total Revenue |
| Count | Number of records | Number of Deals |
| Count Distinct | Unique values | Unique Customers |
| Average | Mean value | Average Deal Size |
| Minimum | Smallest value | Lowest Price |
| Maximum | Largest value | Highest Score |
For time series analysis:
| Setting | Options |
|---|
| Period | Daily, Weekly, Monthly, Quarterly, Yearly |
| Type | Calendar (Jan-Dec) or Rolling (trailing) |
Limit the KPI to specific records:
| Filter Type | Example |
|---|
| Dimension filter | Stage = "Closed Won" |
| Date filter | Created Date >= 2024-01-01 |
| Multiple conditions | Region = "West" AND Size > $50K |
| KPI Name | Base Column | Filter |
|---|
| Won Revenue | Amount | Stage = "Closed Won" |
| Open Pipeline | Amount | Stage NOT IN ("Won", "Lost") |
| New Customers | Customer ID (count distinct) | Type = "New" |
| Enterprise Deals | Amount | Segment = "Enterprise" |
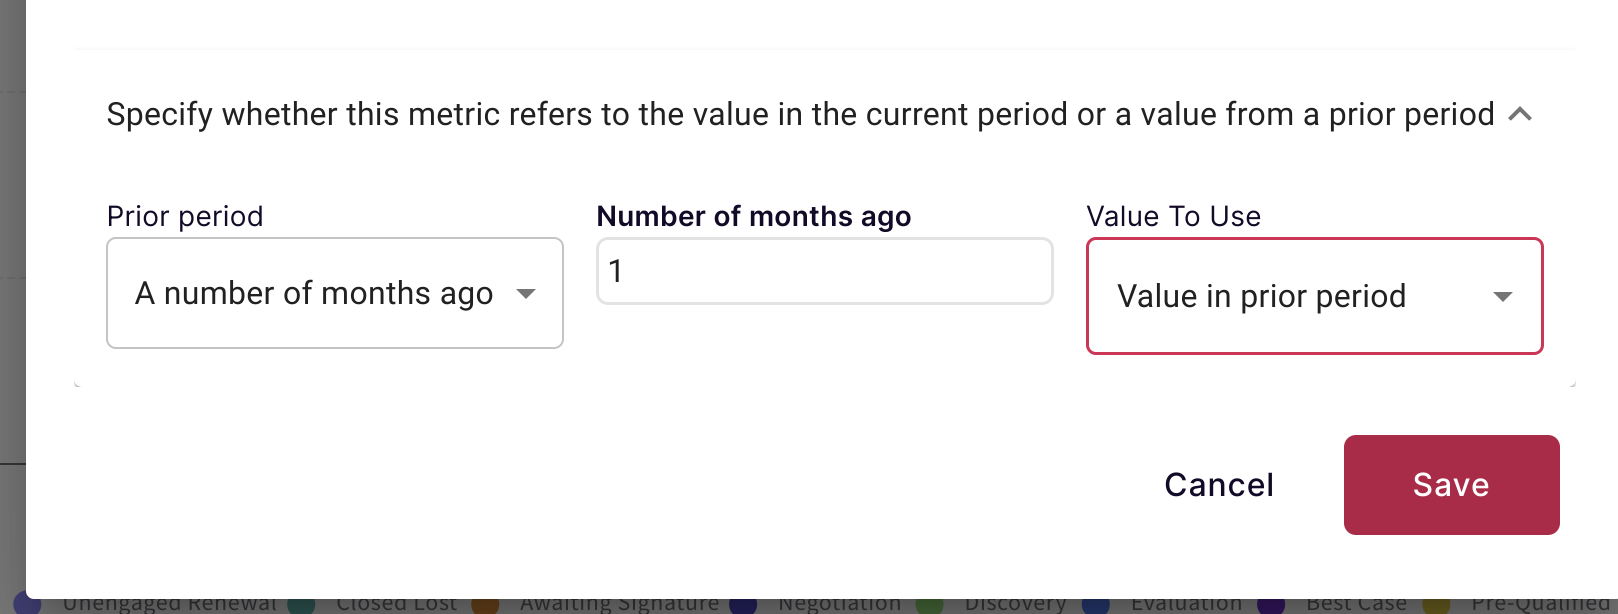
Compare values to prior periods:
| Shift | Use Case |
|---|
| 1 month ago | Month-over-month comparison |
| 1 quarter ago | Quarter-over-quarter |
| 1 year ago | Year-over-year |
| 1 period ahead | Next period forecast |
To create "% Change vs Last Month":
- Create KPI: "Revenue This Month" (current period)
- Create KPI: "Revenue Last Month" (shifted 1 month)
- Create Compound KPI:
('Revenue This Month' - 'Revenue Last Month') / 'Revenue Last Month'
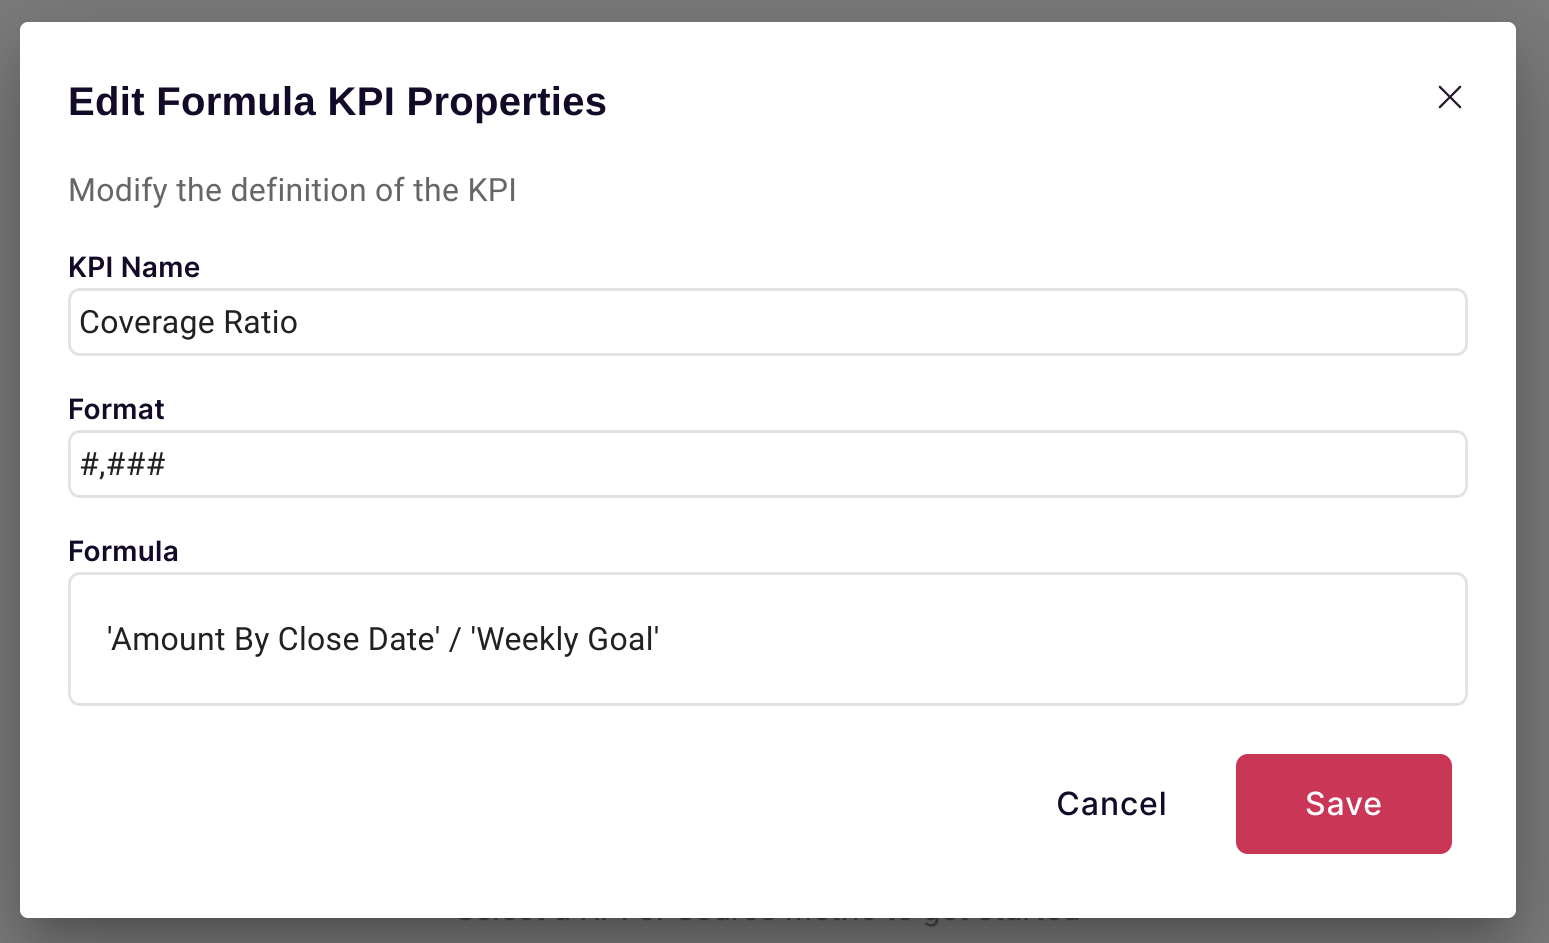
Compound KPIs are formulas that combine other KPIs. Use familiar Excel syntax.
| Element | Syntax | Example |
|---|
| Reference KPI | Single quotes | 'Total Revenue' |
| Operators | Standard math | + - * / |
| Functions | Excel functions | IF(), SUM(), ROUND() |
| KPI | Formula |
|---|
| Win Rate | 'Won Deals' / ('Won Deals' + 'Lost Deals') |
| Conversion Rate | 'Converted Leads' / 'Total Leads' |
| Average Deal Size | 'Total Revenue' / 'Deal Count' |
| KPI | Formula |
|---|
| MoM Growth | ('Revenue' - 'Revenue Last Month') / 'Revenue Last Month' |
| YoY Change | 'Revenue' - 'Revenue Last Year' |
| % of Target | 'Actual' / 'Target' |
| KPI | Formula | Datasets Used |
|---|
| Cost Per Lead | 'Marketing Spend' / 'Lead Count' | Finance + Marketing |
| Revenue Per Employee | 'Total Revenue' / 'Employee Count' | Sales + HR |
| CAC | 'Sales + Marketing Cost' / 'New Customers' | Finance + CRM |
Most Excel functions work in Scoop:
| Category | Functions |
|---|
| Math | SUM, AVERAGE, MIN, MAX, ABS, ROUND |
| Logic | IF, AND, OR, NOT |
| Text | CONCATENATE, LEFT, RIGHT, LEN |
| Date | YEAR, MONTH, DAY, TODAY |
IF('Win Rate' >= 0.5, "Healthy", "At Risk")
KPIs can be used as:
- Y-axis metrics
- Secondary axes
- Comparison lines
KPIs appear as:
- Summary columns
- Calculated values
- Conditional formatting sources
When you click a KPI value in a chart or table:
| Scenario | Drill Capability |
|---|
| Single dataset KPI | Drill on any dimension |
| Compound KPI | Drill on shared dimensions only |
For compound KPIs, you can drill on:
- Time dimensions (always available)
- Dimensions common to all component KPIs
| Practice | Example |
|---|
| Descriptive names | "Won Revenue" not "Rev1" |
| Include time context | "Monthly Active Users" |
| Indicate calculation | "Win Rate (%)" |
| Tip | Why |
|---|
| Group related KPIs | Easier to find and maintain |
| Document complex formulas | Others can understand |
| Use consistent units | Avoid confusion |
| Consideration | Recommendation |
|---|
| Many KPIs | Focus on most important |
| Complex formulas | Break into component KPIs |
| Large datasets | Pre-aggregate where possible |
| KPI | Formula/Setup |
|---|
| Pipeline Value | Sum of Amount where Stage = Open |
| Closed Won | Sum of Amount where Stage = Won |
| Average Sales Cycle | Average of Days in Pipeline |
| Pipeline Coverage | Pipeline Value / Quota |
| KPI | Formula/Setup |
|---|
| Lead Count | Count of Lead ID |
| MQL Rate | MQL Count / Total Leads |
| Cost Per Lead | Marketing Spend / Lead Count |
| Marketing ROI | Revenue from Marketing / Marketing Spend |
| KPI | Formula/Setup |
|---|
| Active Users | Count Distinct of User ID (last 30 days) |
| Churn Rate | Churned Customers / Total Customers |
| NPS Score | Average of NPS Response |
| Expansion Revenue | Sum of Upsell Amount |
| KPI | Formula/Setup |
|---|
| Ticket Volume | Count of Ticket ID |
| Resolution Time | Average of Time to Close |
| First Response Time | Average of Time to First Response |
| CSAT Score | Average of Satisfaction Rating |
- Verify filter conditions
- Check date column selection
- Confirm aggregation method
- Ensure referenced KPIs exist
- Check for division by zero
- Verify KPI names in quotes
- For compound KPIs, drill limited to shared dimensions
- Verify underlying KPIs have drill data