QuickBooks

You can create automated custom reports with QuickBooks and have them automatically sent to Scoop for ingestion. This will allow you to blend your QuickBooks financial data with any other data that you have been able to bring into Scoop.
Example of typical items you might pull from QuickBooks:
- Revenue data by customer, product, etc.
- Expense data by campaign, channel, etc.
- Income statement
- Balance sheet items (e.g. like cash on hand)
- Invoicing data
This data can be extraordinarily powerful when combined with other operational data from sales, marketing, product, service, etc. such that you can gain deep visibility into costs and returns on investments in various parts of your business.
AI-Assisted Setup
When connecting QuickBooks to Scoop, choose "Guide me with AI" for an intelligent, guided setup experience.
Available Analysis Templates
| Template | Object | Best For | What You'll Analyze |
|---|---|---|---|
| Profit & Loss | ProfitAndLoss | Financial performance | Revenue, expenses, net income by period |
| Cash Flow Analysis | CashFlow | Cash management | Operating, investing, financing cash flows |
| Balance Sheet | BalanceSheet | Financial position | Assets, liabilities, equity |
| Invoice & AR Aging | InvoiceSummary | Receivables management | Outstanding invoices, aging buckets |
| Invoice Line Items | InvoiceDetail | Revenue analysis | Products/services, customer breakdown |
| Purchase Orders & AP | PurchaseOrderSummary | Payables tracking | Vendor orders, payment status |
| Customer Database | Customer | Customer insights | Customer list, contact info, segmentation |
| Vendor Database | Vendor | Supplier analysis | Vendor list, terms, relationships |
Example Questions You Can Answer
Financial Performance:
- "What was our profit margin last quarter compared to the same quarter last year?"
- "Which expense categories have grown the most this year?"
- "What's our month-over-month revenue trend?"
- "How does gross margin vary by product line?"
- "What's our operating expense ratio trend?"
Cash Flow:
- "What's our cash position trend over the past 6 months?"
- "How much cash are we generating from operations?"
- "What's the impact of accounts receivable on our cash flow?"
- "How does cash flow from operations compare to net income?"
- "What's our cash conversion cycle?"
Receivables & Payables:
- "Which customers have the oldest unpaid invoices?"
- "What's our average collection period by customer segment?"
- "How much do we owe vendors in the next 30 days?"
- "What's our days sales outstanding (DSO) trend?"
- "Which vendors have the largest outstanding payables?"
Customer Analysis:
- "Who are our top 10 customers by invoice volume?"
- "Which products generate the most revenue?"
- "What's the average order value by customer type?"
- "How has customer revenue concentration changed over time?"
- "What's the average invoice value by product category?"
Need Something Different?
If the templates above don't match your needs, select "Something else" and describe what you want to analyze. For example:
- "I want to analyze departmental expenses"
- "I need to track specific account balances over time"
- "I want to focus on a custom date range"
Scoop's AI will recommend the right configuration for your specific use case.
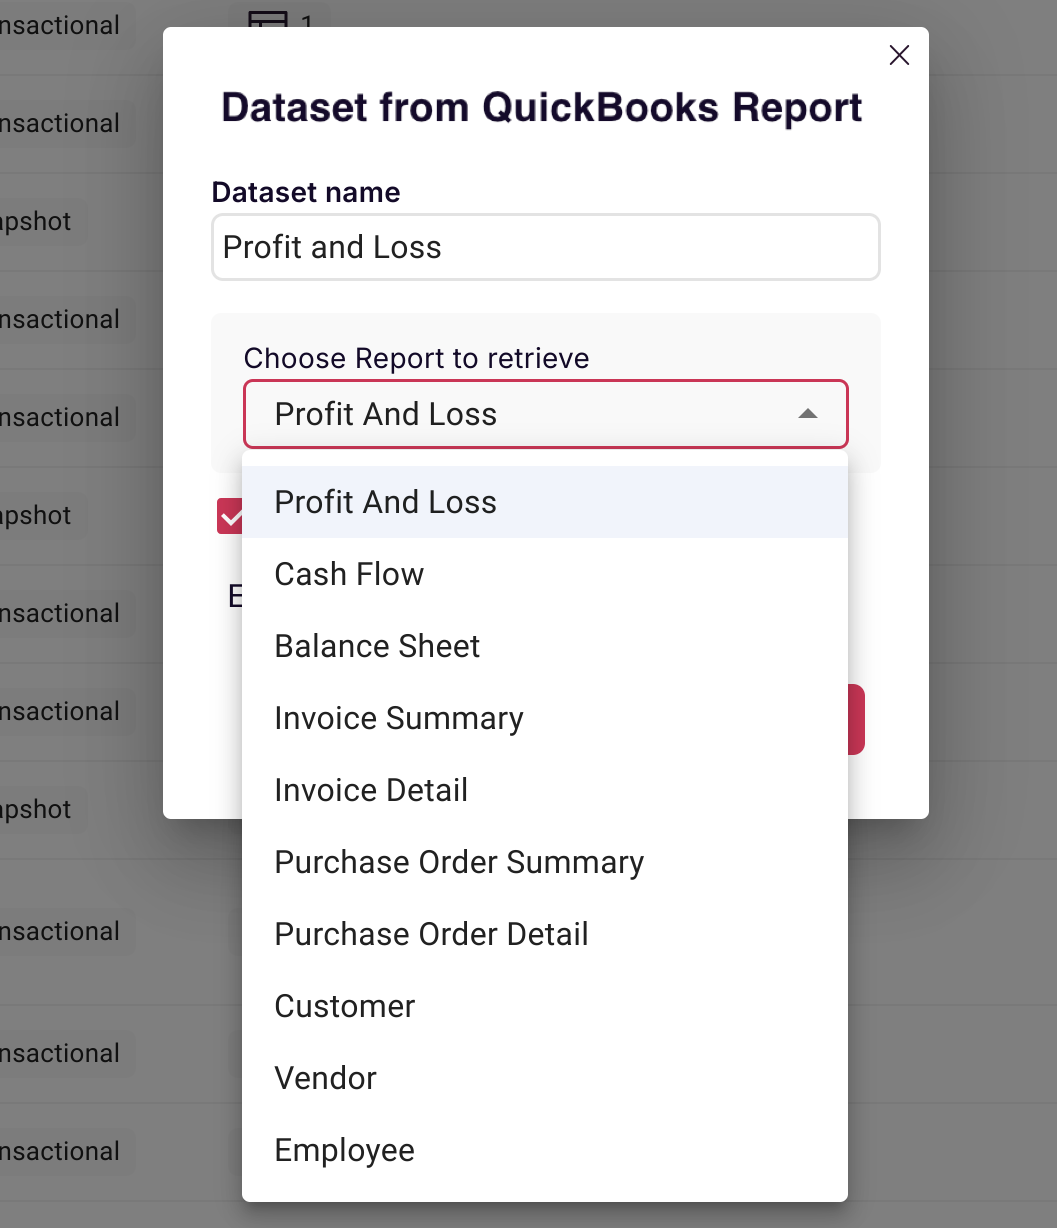
Using Financial Statements
Financial statements are the core of an accounting system. Scoop allows you to pull financial statements from QuickBooks and analyze them. Scoop supports the following:
- Profit and Loss Detail (Income Statement) - Scoop pulls all profit and loss data by date and allows you to aggregate this data over any date period
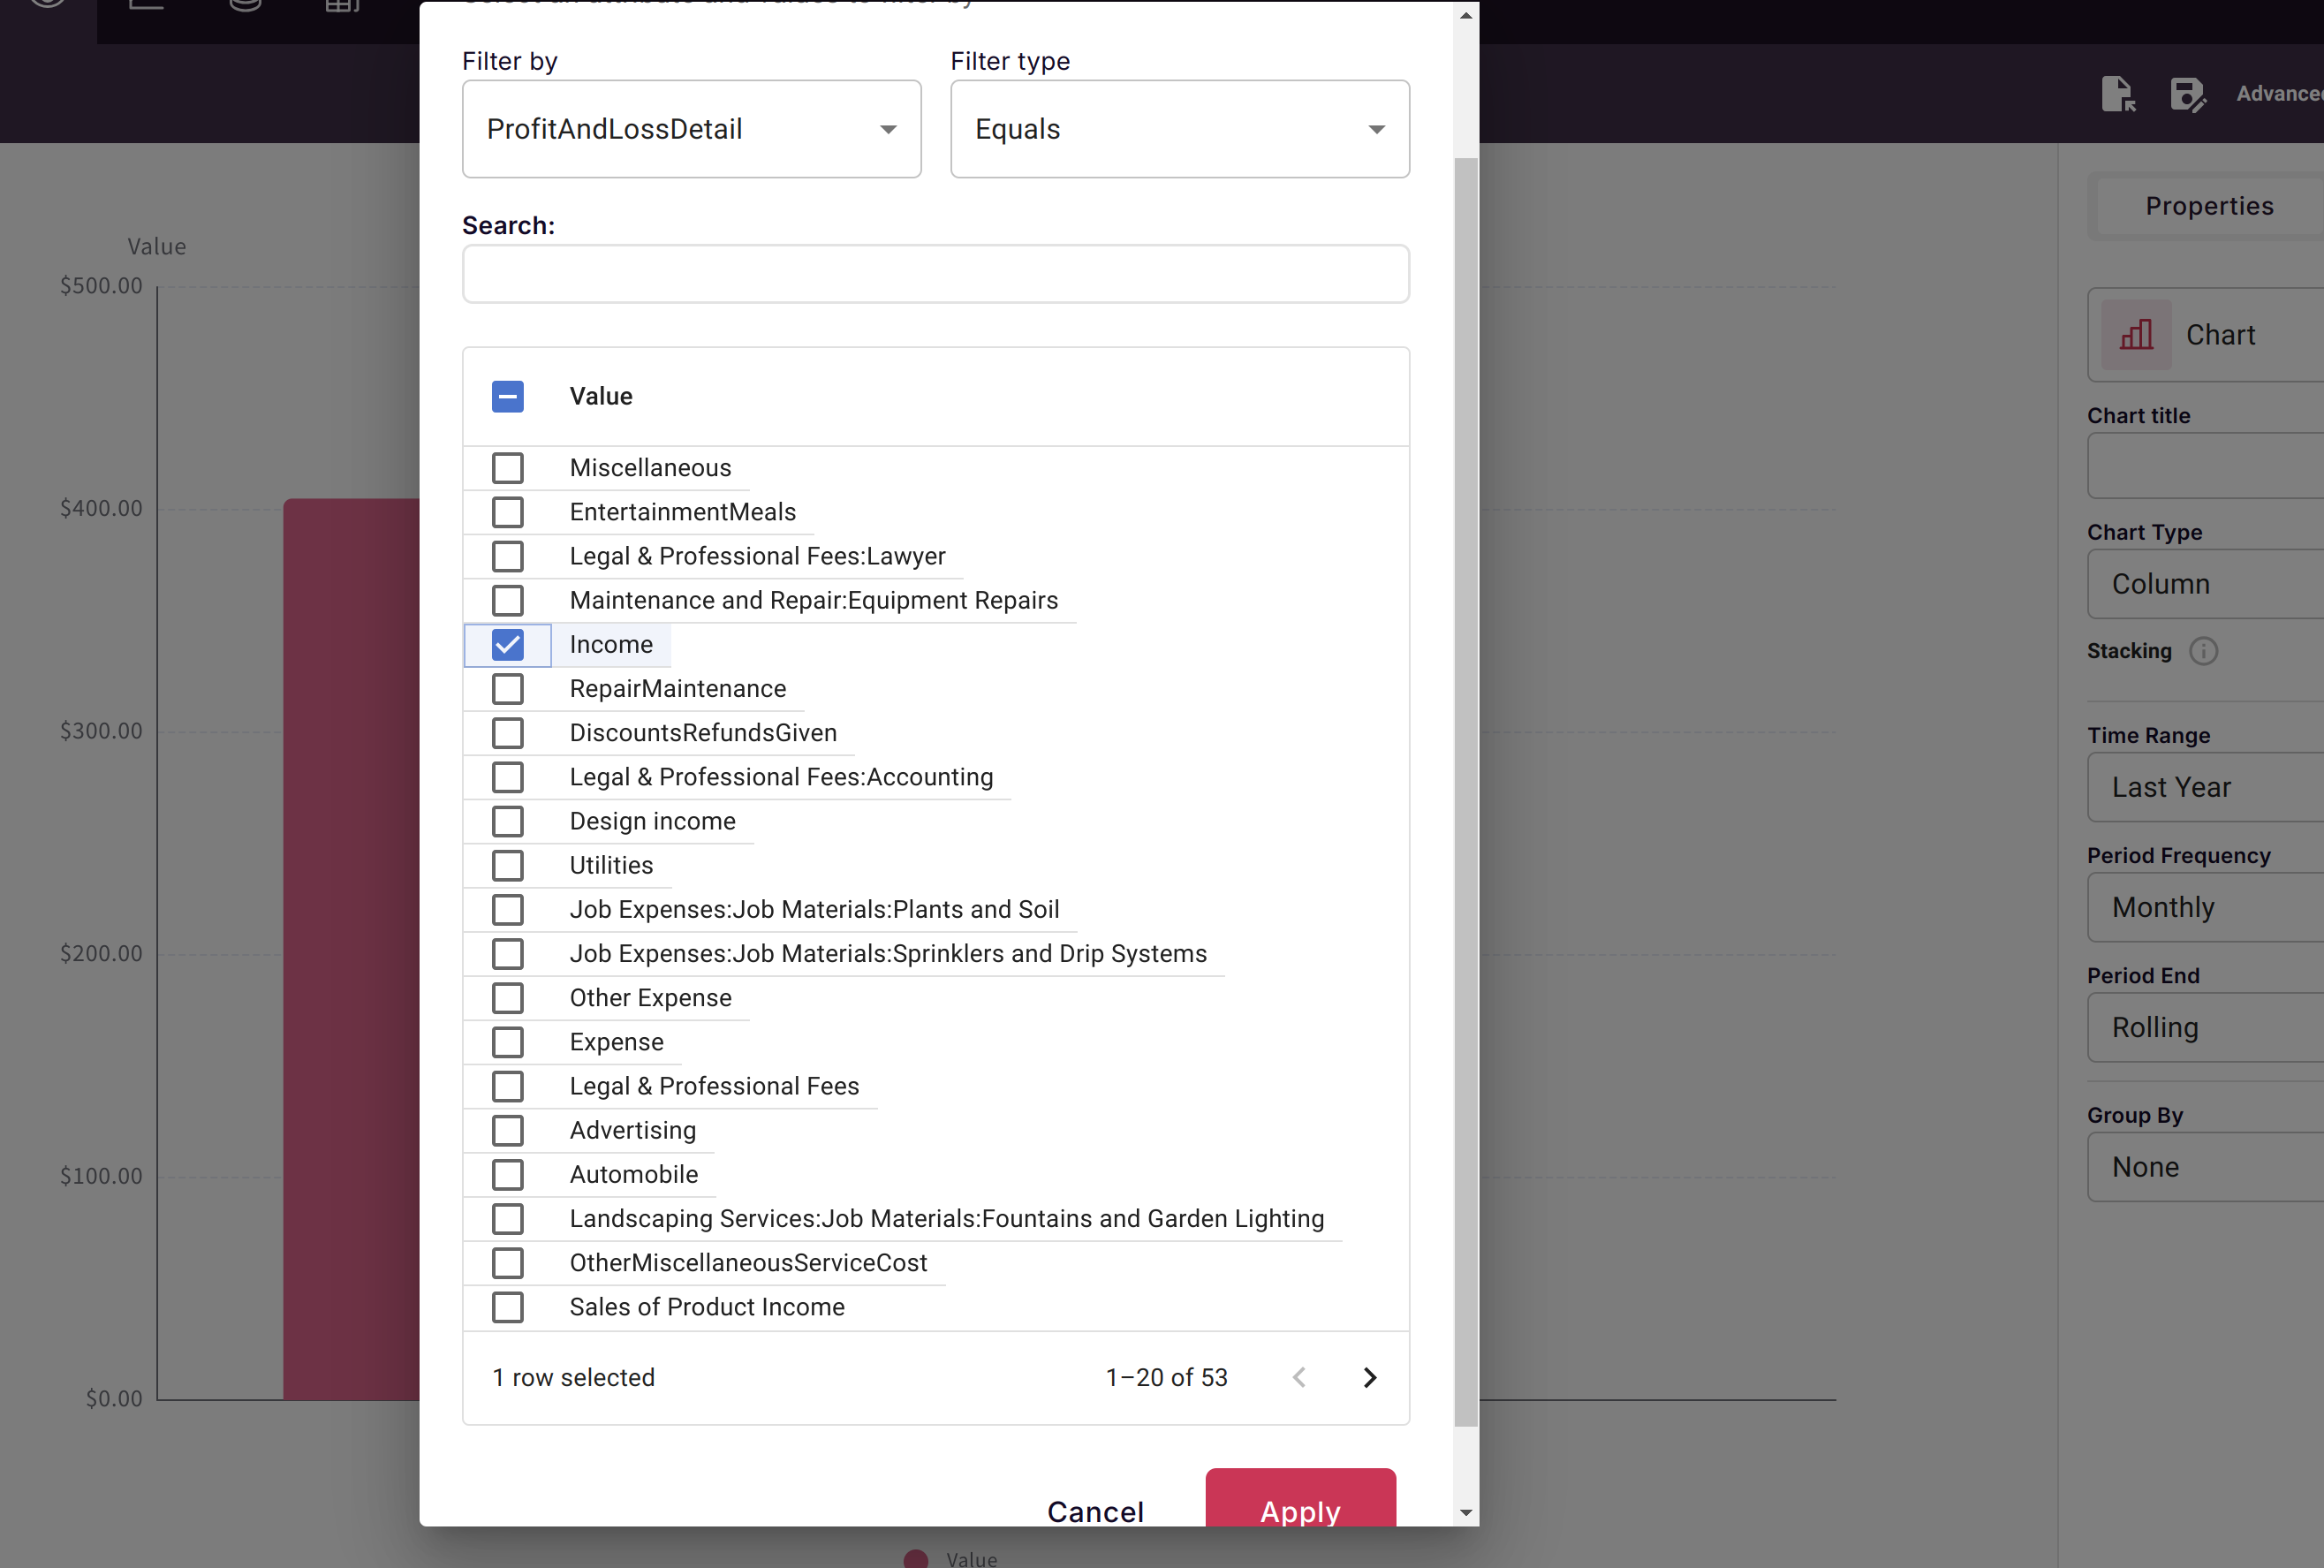
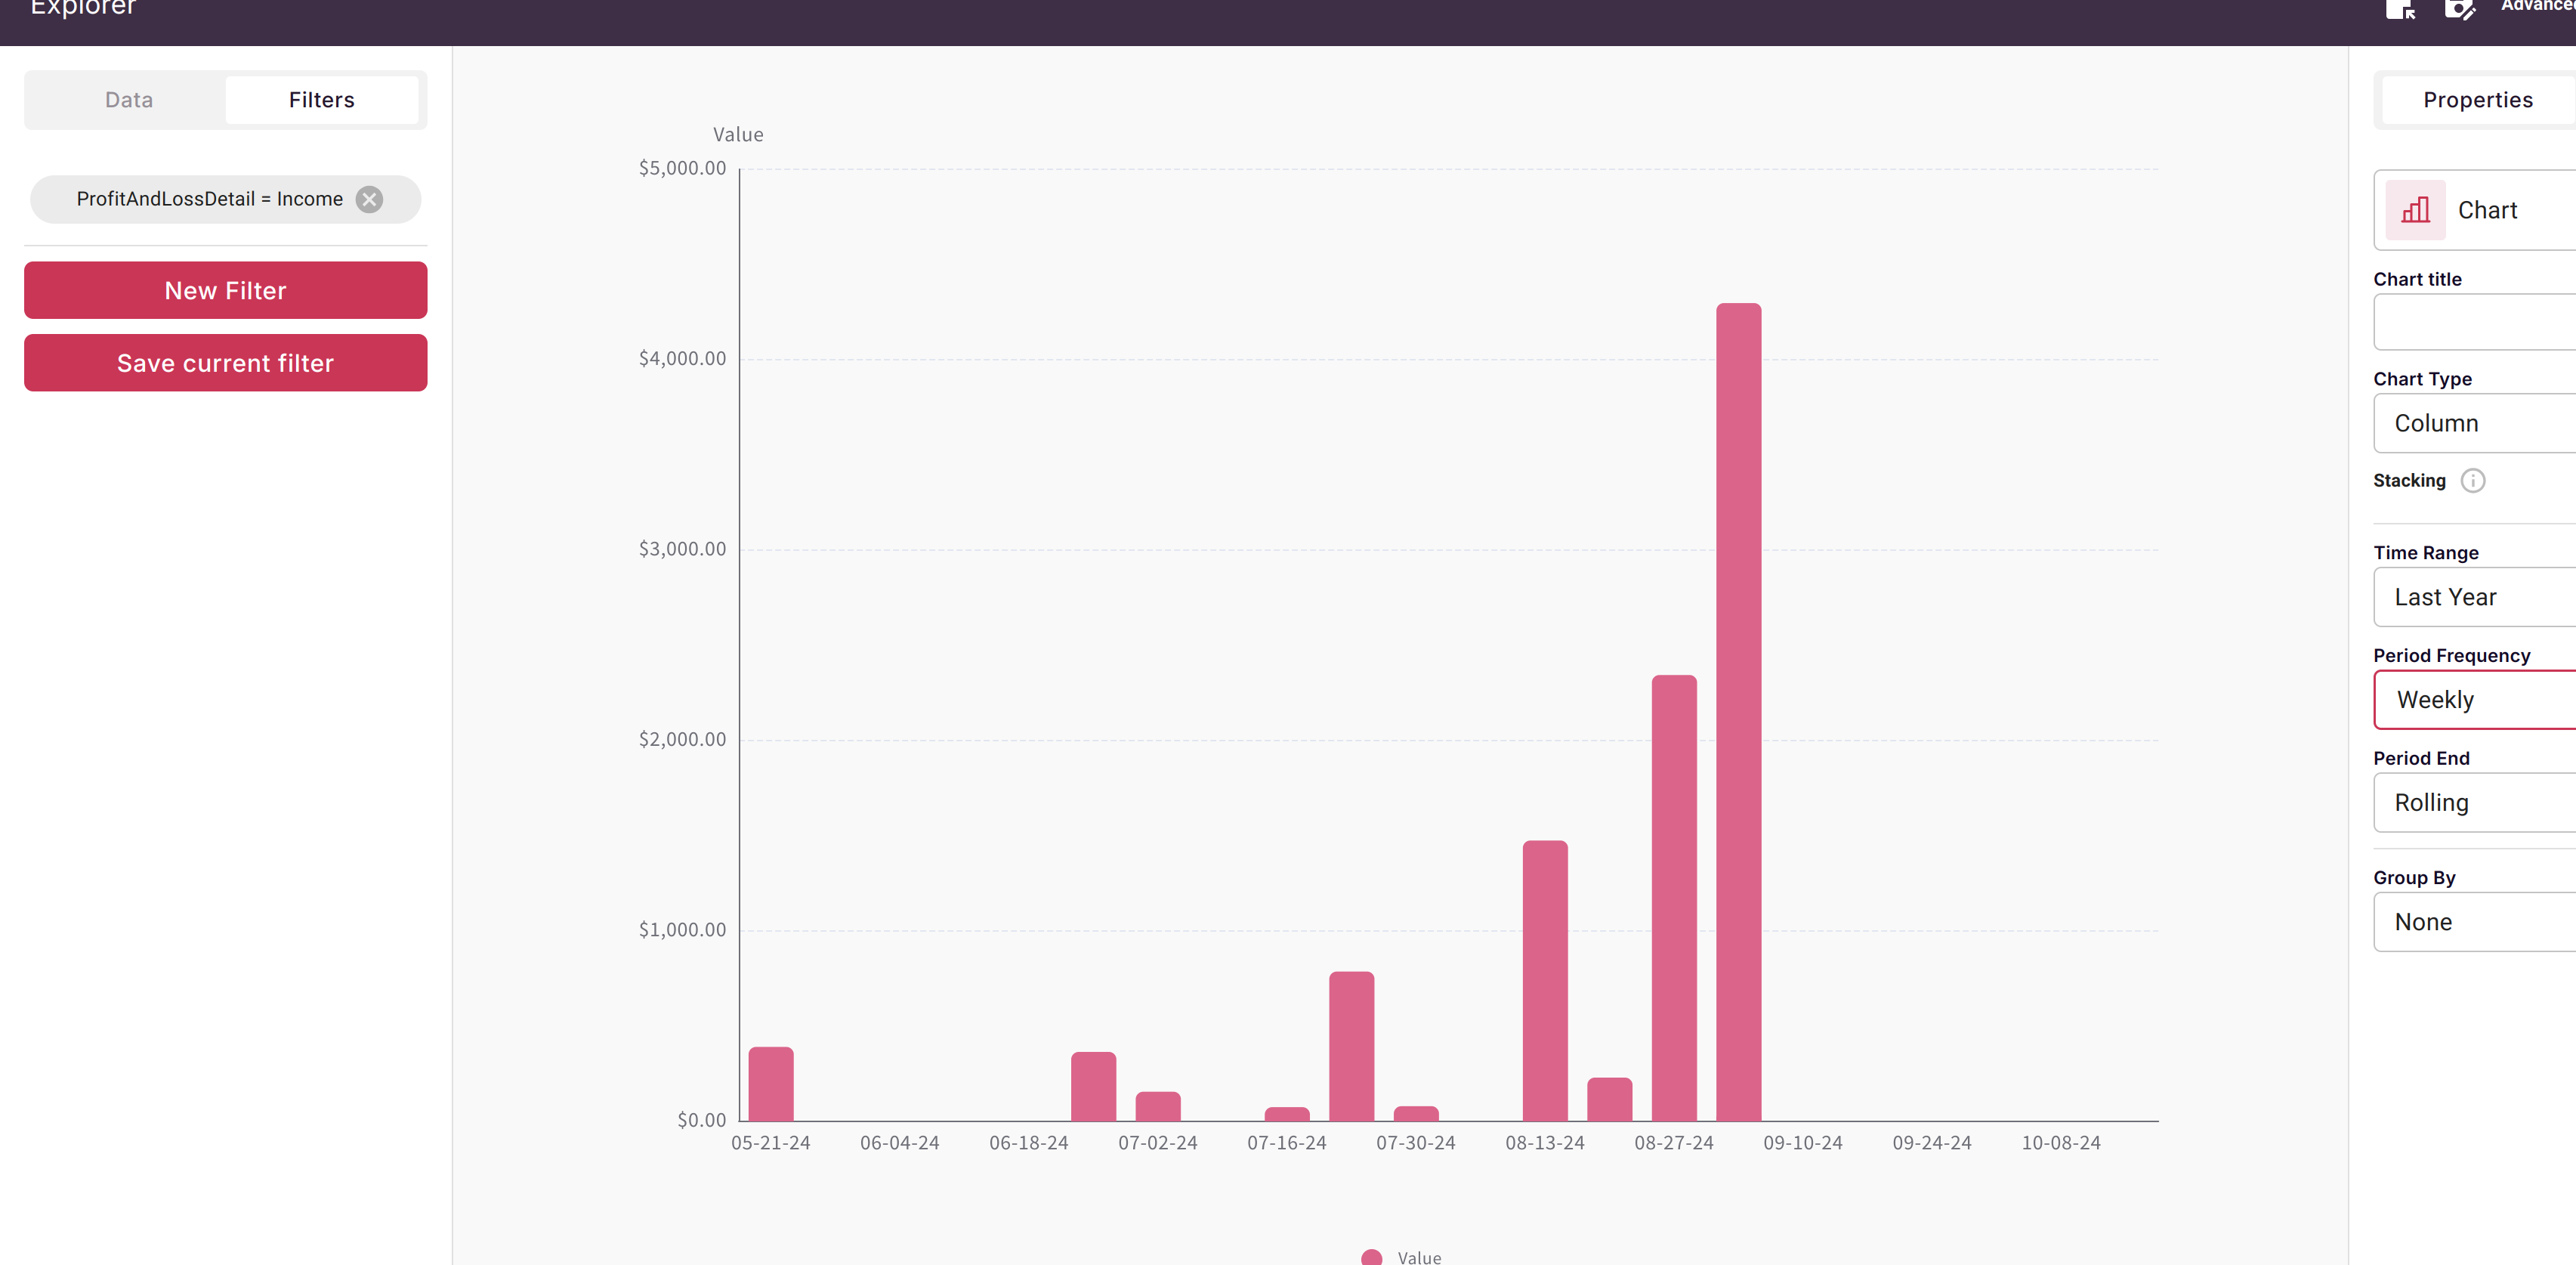
For example below, if under ProfitAndLoss the metric Value is selected and the Income account is what's chosen to filter for, you can then chart income by any time period of your choice:
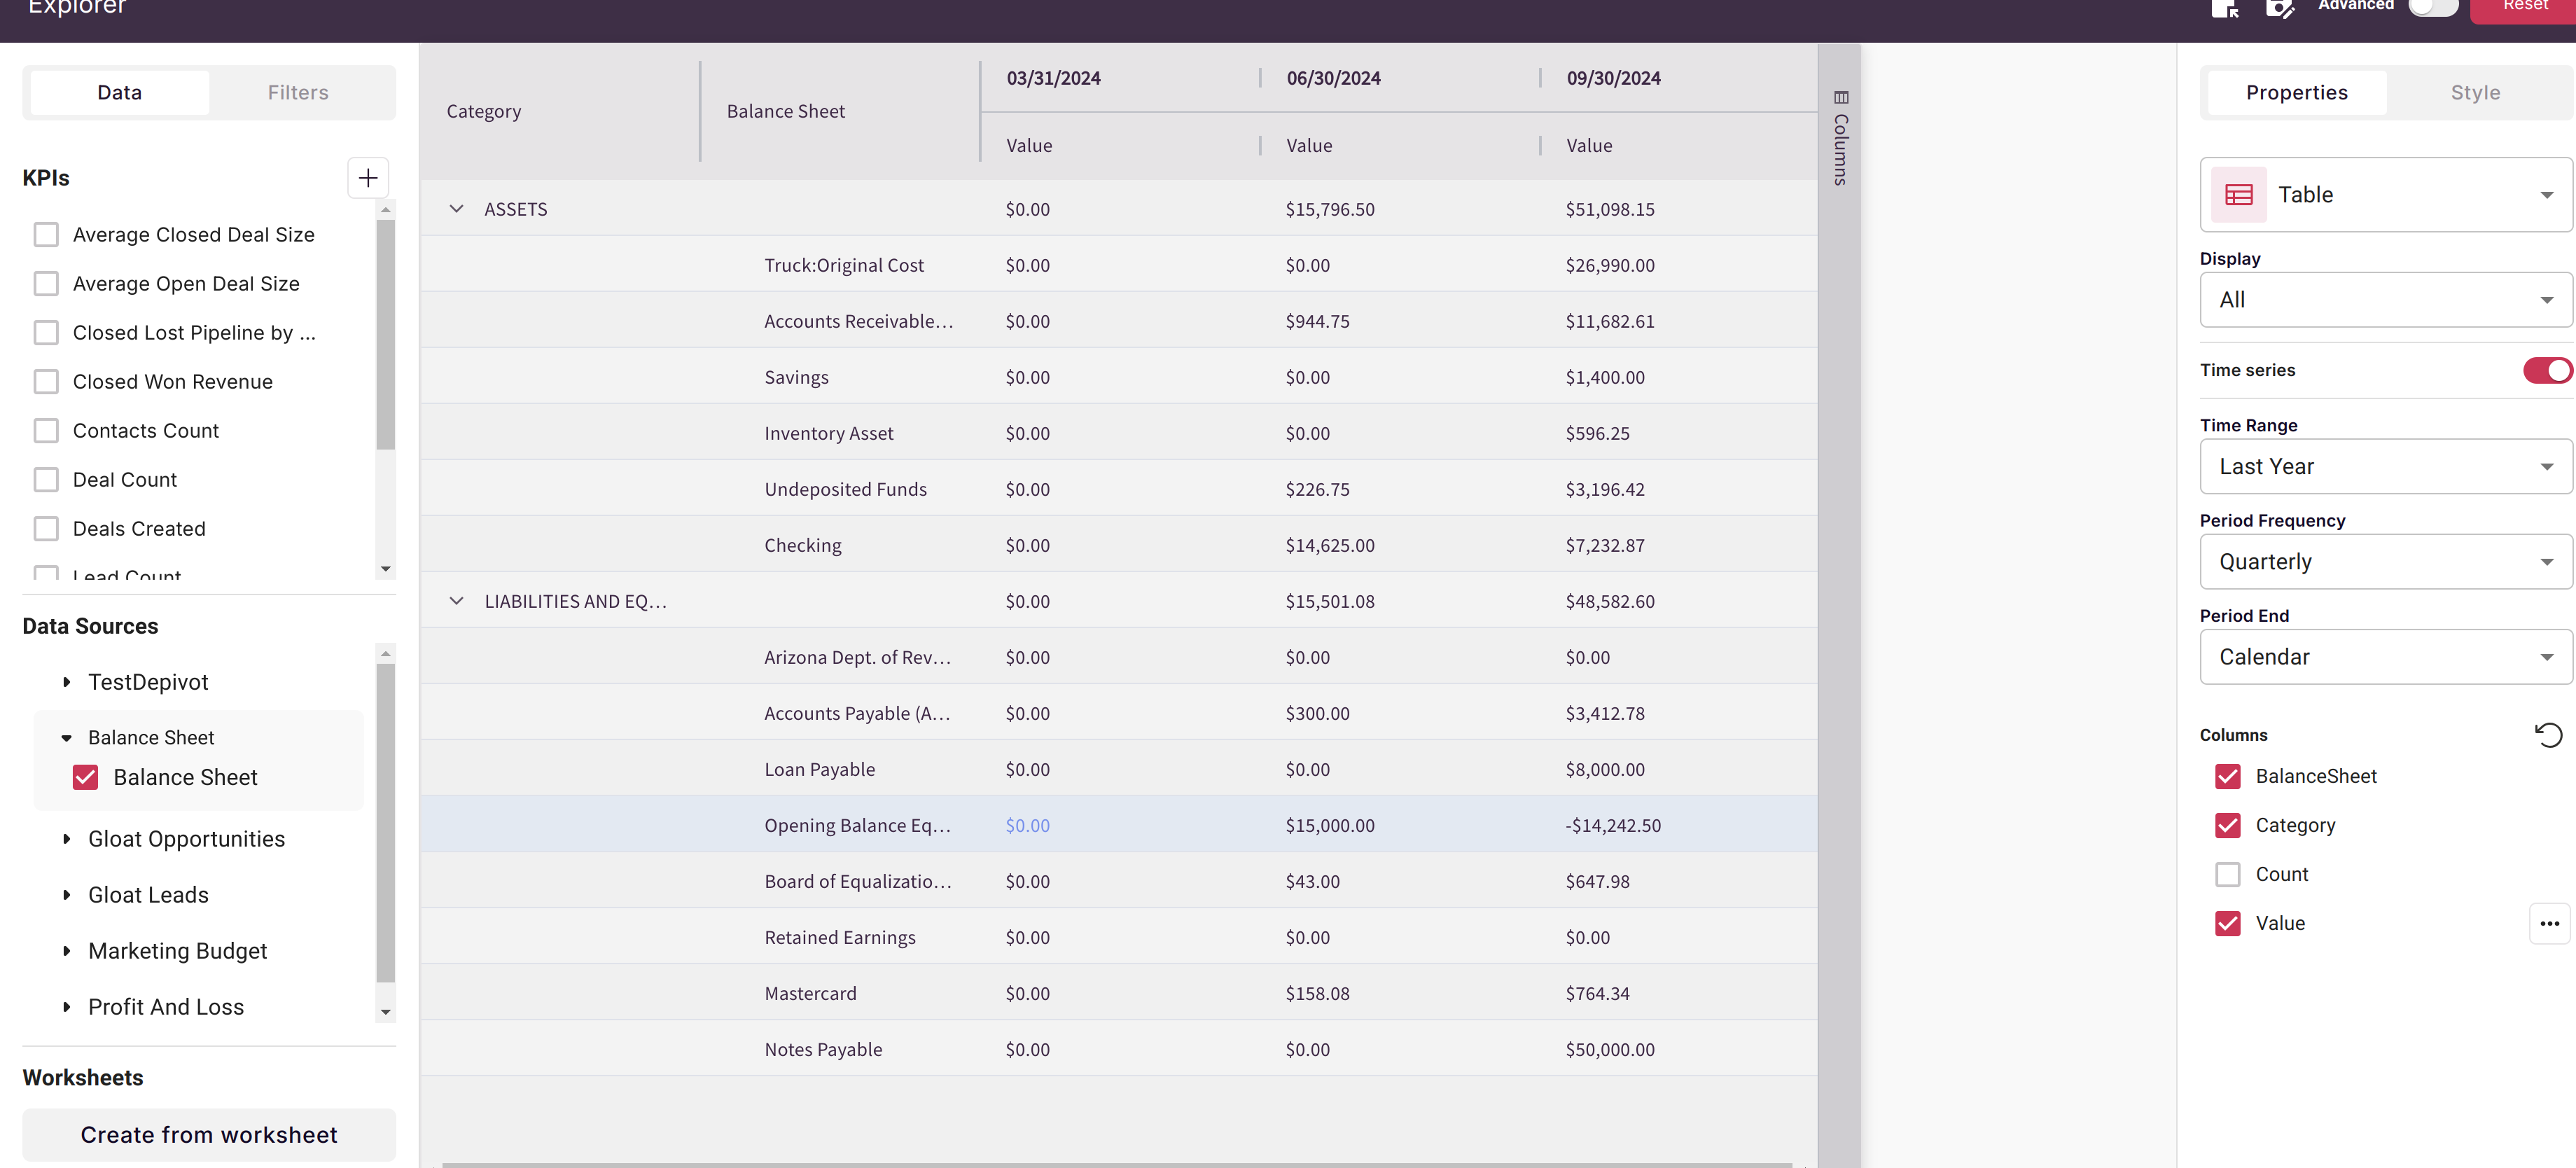
- Balance Sheet - Scoop pulls monthly balance sheet account balances. For the balance sheet, you can similarly filter for accounts, but you can also view balance sheet items by category:
- Cash Flow - Scoop pulls monthly cash flow reconciliations between Profit and Loss and Balance Sheet details to allow you to understand cash flows.
For financial statements you can analyze the statement value by the appropriate account. In addition, there are attributes that may be relevant for a particular statement. To analyze a particular account's value, select the value in the financial statement and then filter the account attribute for the account of interest.
- Profit and Loss: For this financial statement you can filter or group by the "ProfitAndLossDetail" account attribute to select an account that is relevant for the P&L. In addition, you can group and filter by the "Name" attribute which may be present on individual transactions.
- Cash Flow: For Cash Flow, you can filter or group by the "CashFlow" account attribute which will select and account on the cash flow statement. You can also filter or group by "Category" for operating activities, investing activities, and financing activites.
- Balance Sheet: For Balance Sheet, you can filter or group by the "BalanceSheet" account attribute. You can also filter or group by the "Category" attribute to filter for Assets or Liabilities and Equity.
Transaction Items
Scoop supports the following transaction items:
- Invoice Summary - one row per invoice
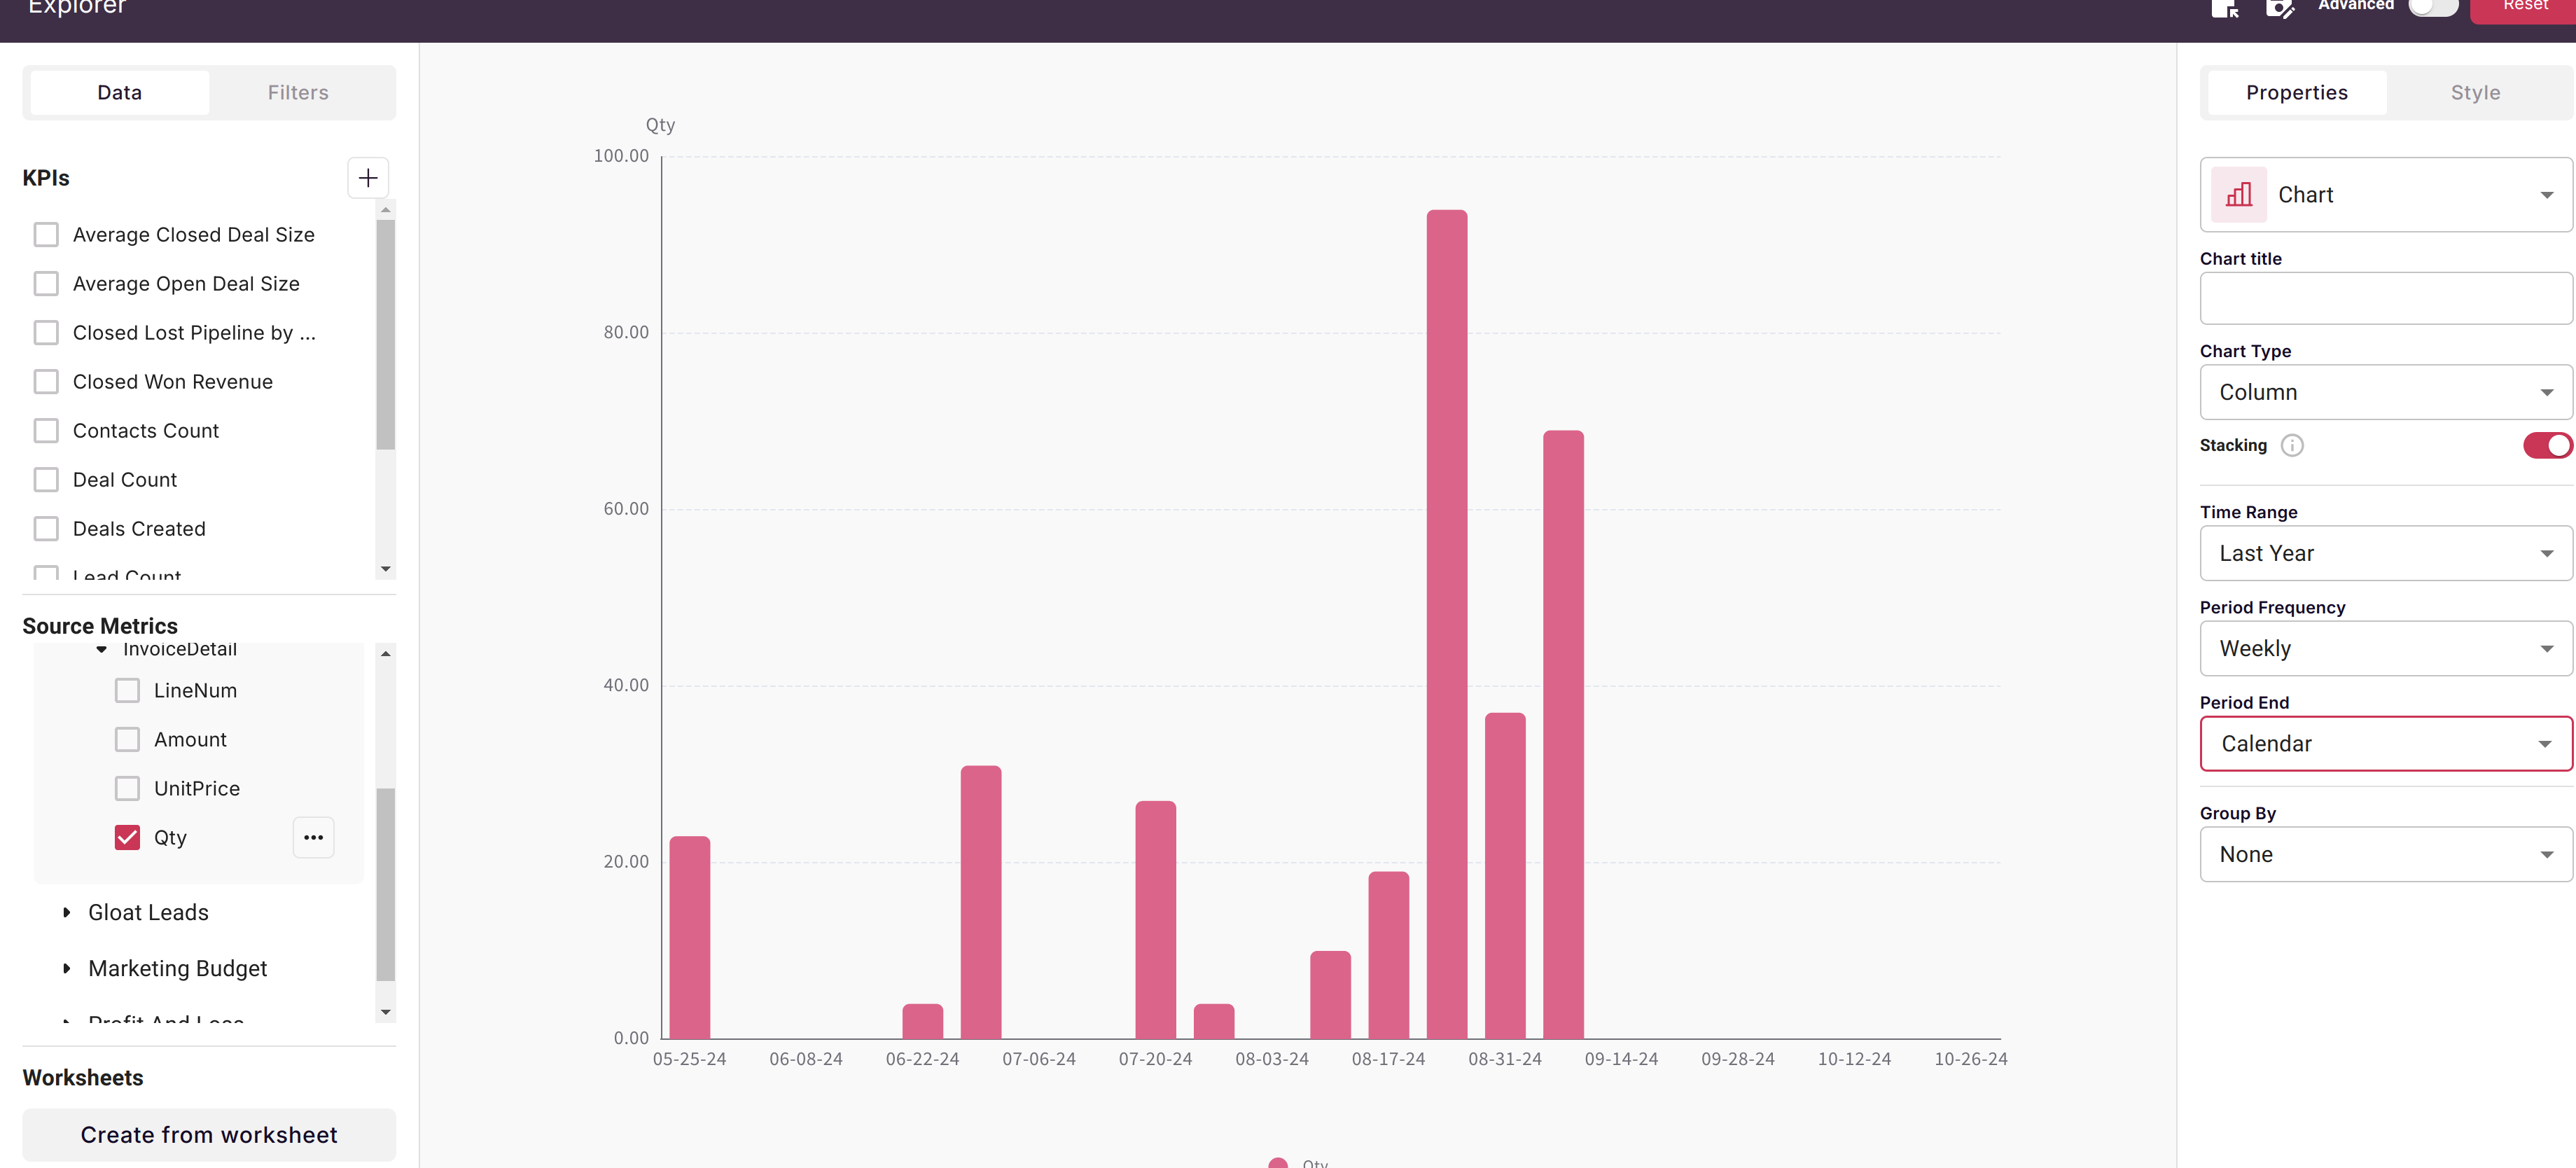
- Invoice Detail - one row per invoice line item. Below is an example charting invoicing volume by transaction date.
- Purchase Order Summary - one row per purchase order
- Purchase Order Detail - one row per purchase order line item
List Items
Scoop supports the following list items:
- Customer
- Vendor
- Employee
Use cases for QuickBooks by blending with other data sources
- Marketing cost per campaign, lead, and customer acquisition costs by combining with marketing lead and/or sales opportunity data
- Customer value segmentation by combining Netsuite financial data with CRM customer attributes
- Product value segmentation by combining product usage data with customer financial data
- Customer success risk analysis by comparing customer activity with their financial value
Updated 6 months ago