Prompts
Add dynamic filter controls to your canvas
Prompts add filter controls to your canvas, letting users dynamically change what data they see. Instead of creating separate dashboards for each region, product, or time period, create one canvas with prompts that adapt to each user's needs.
Types of Prompts
| Prompt Type | Description | Use Case |
|---|---|---|
| Single Select | Choose one value from a list | Region, Product Line, Manager |
| Multi-Select | Choose multiple values | Select multiple regions or products |
| Date Picker | Select a date or date range | Time period filtering |
| Text Input | Enter a search value | Customer name, ID lookup |
Adding a Prompt
- Open your canvas in edit mode
- Click + Add from the left toolbar
- Select Prompt
- Click where you want to place the prompt
- Configure the prompt settings
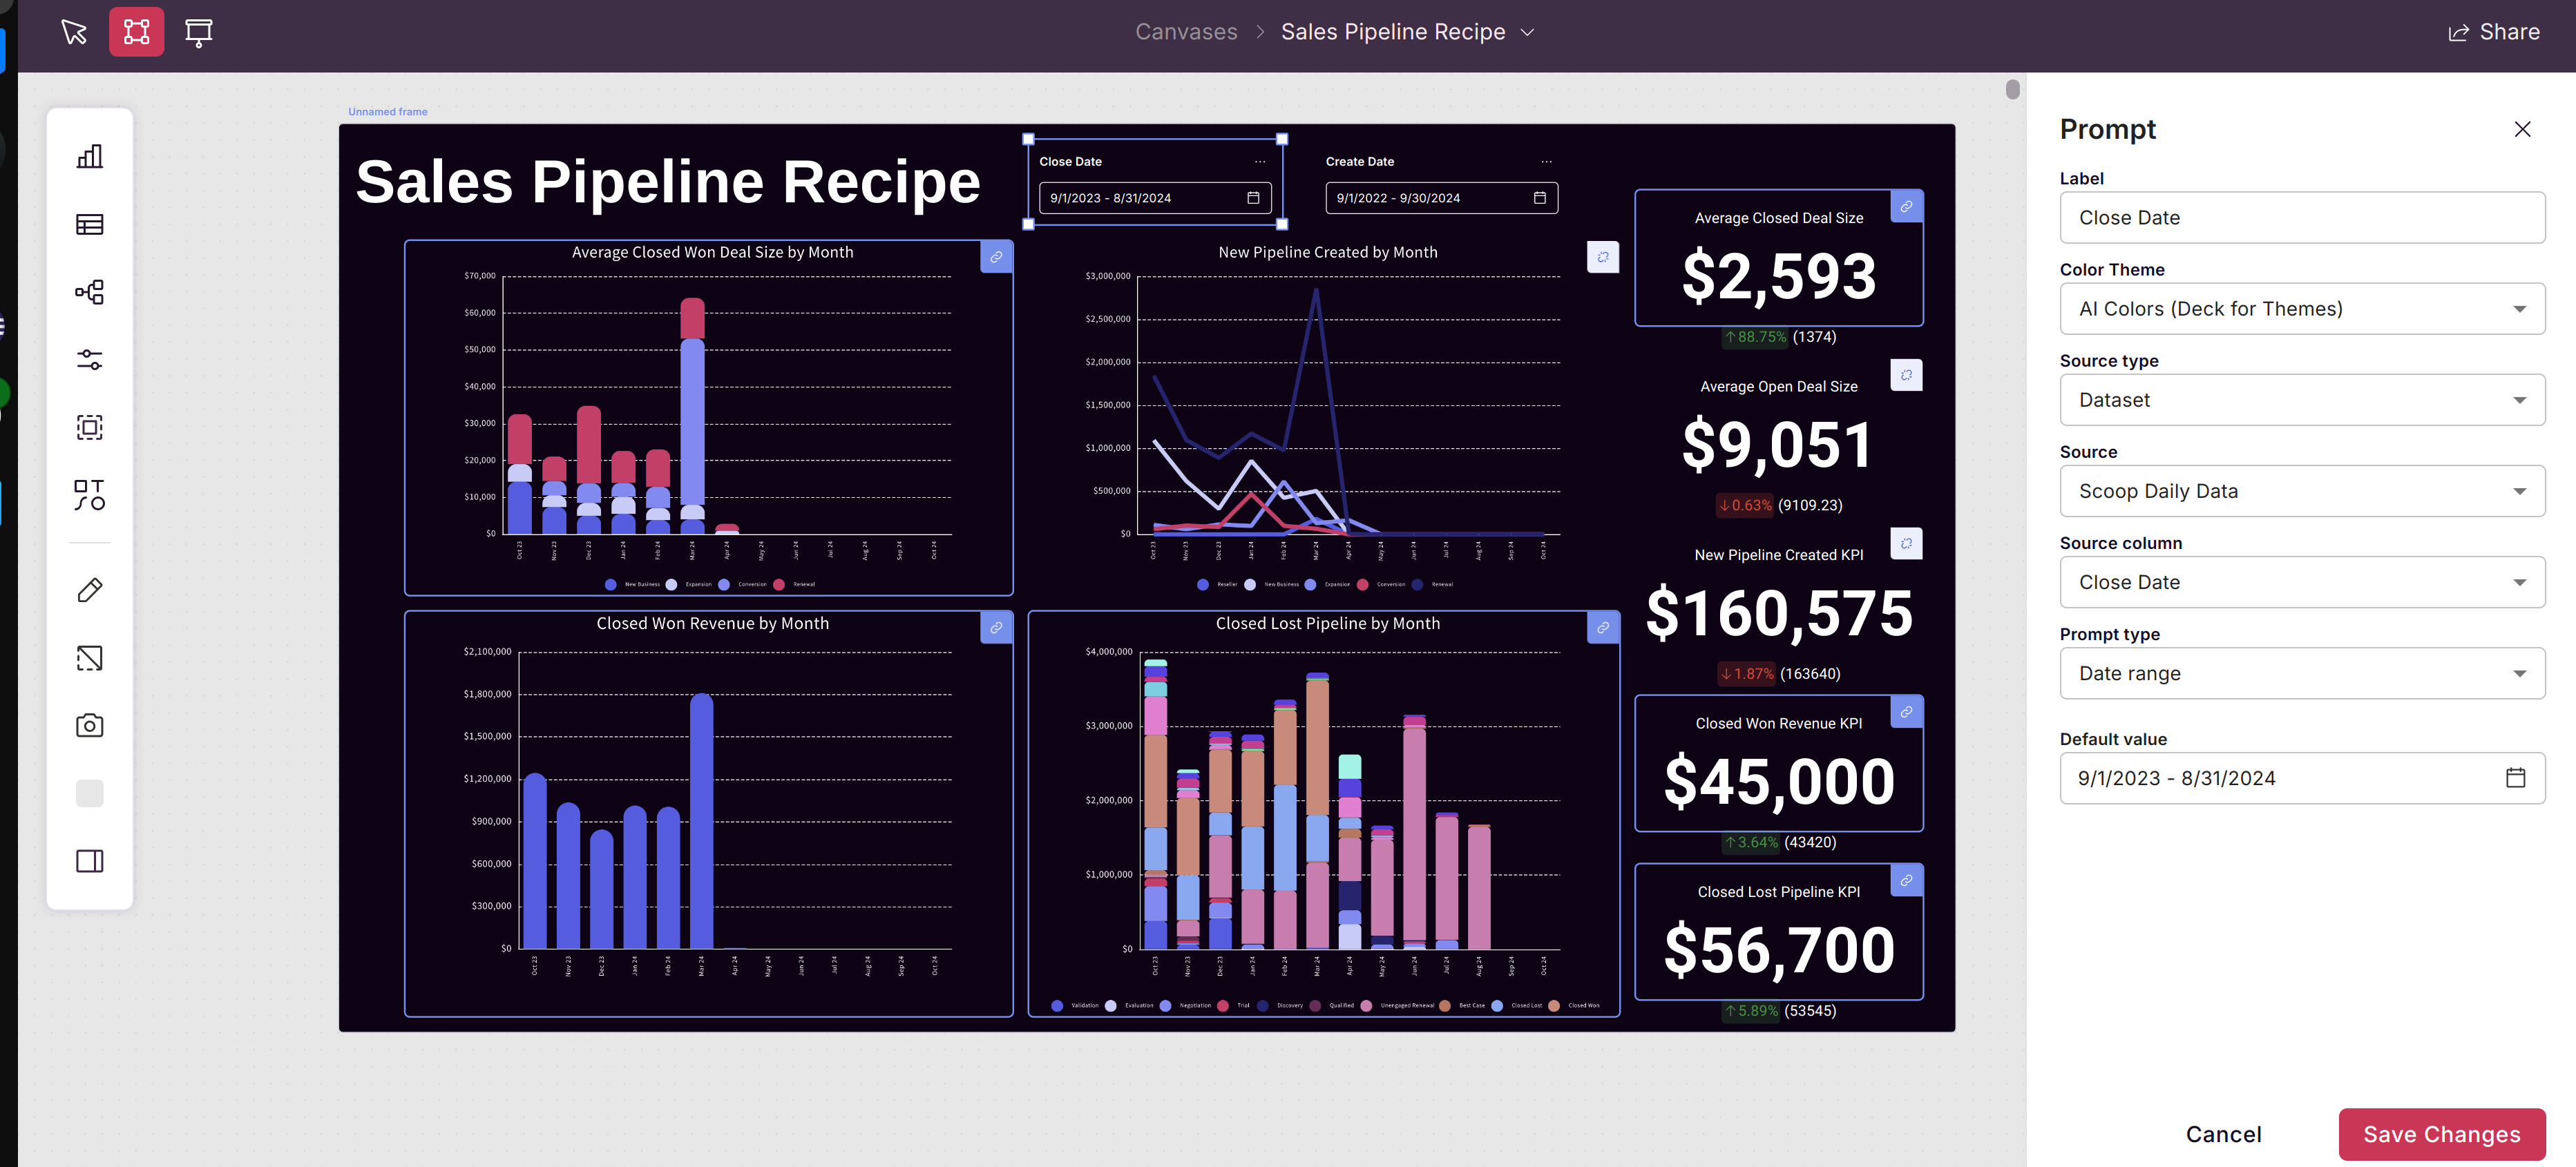
Configuring Prompts
Setting the Data Source
Prompts can pull their values from:
| Source | Description | Best For |
|---|---|---|
| Scoop Dataset | Values from a column in your data | Dynamic, auto-updating lists |
| Named Range | Values from a spreadsheet range | Static lists, custom ordering |
From a Dataset:
- Select the dataset containing your filter values
- Choose the column to use for prompt options
- Values automatically update as your data changes
From a Named Range:
- Select a Live Worksheet
- Choose the named range with your values
- Edit the spreadsheet to add/remove options
Linking Elements to Prompts
After configuring the prompt, link it to canvas elements:
- Select an element (chart, table, KPI) on your canvas
- Click the Link icon (chain) in the element's toolbar
- Connect the element to the prompt
- Specify which column the prompt should filter
Example:
- Prompt: Region selector
- Chart: Revenue by Product
- Link: Filter chart's "Region" column by prompt selection
Multiple Linked Elements
A single prompt can control multiple elements:
┌─────────────────────────────────────────┐
│  [Region Prompt: ▼ West              ]  │
├───────────────────┬─────────────────────┤
│ Revenue by Month  │  Pipeline by Stage  │
│   (filtered)      │    (filtered)       │
├───────────────────┼─────────────────────┤
│ Rep Performance   │   Deal List         │
│   (filtered)      │    (filtered)       │
└───────────────────┴─────────────────────┘
All four elements update when the user changes the region.
Prompt Interactions
User Experience
When viewing a canvas with prompts:
- Click the prompt dropdown or selector
- Choose one or more values
- All linked elements instantly update
- Selection persists while viewing the canvas
Default Values
Set a default selection for prompts:
- No default: User must make a selection
- Specific value: Pre-select a common choice
- All values: Start with complete data
Prompt Dependencies
Create cascading prompts where one affects another:
Example:
- First prompt: Region
- Second prompt: Shows only reps in selected region
This prevents invalid combinations and improves UX.
Common Prompt Patterns
Executive Dashboard
Prompts: [Quarter ▼] [Region ▼] [Product Line ▼]

KPIs:     Revenue    Pipeline    Win Rate    Deals
Charts:   Trend      Funnel      Comparison
Tables:   Top Deals  Rep Leaderboard
Sales Manager View
Prompts: [My Team ▼] [Date Range ▼]

KPIs:     Team Revenue  Quota Attainment
Charts:   Rep Performance  Pipeline Coverage
Tables:   Deals to Close This Month
Customer Success
Prompts: [Customer Segment ▼] [Health Score ▼]

KPIs:     Active Customers  Churn Risk  Expansion
Charts:   Engagement Trend  Feature Usage
Tables:   At-Risk Accounts
Sharing with Preset Prompts
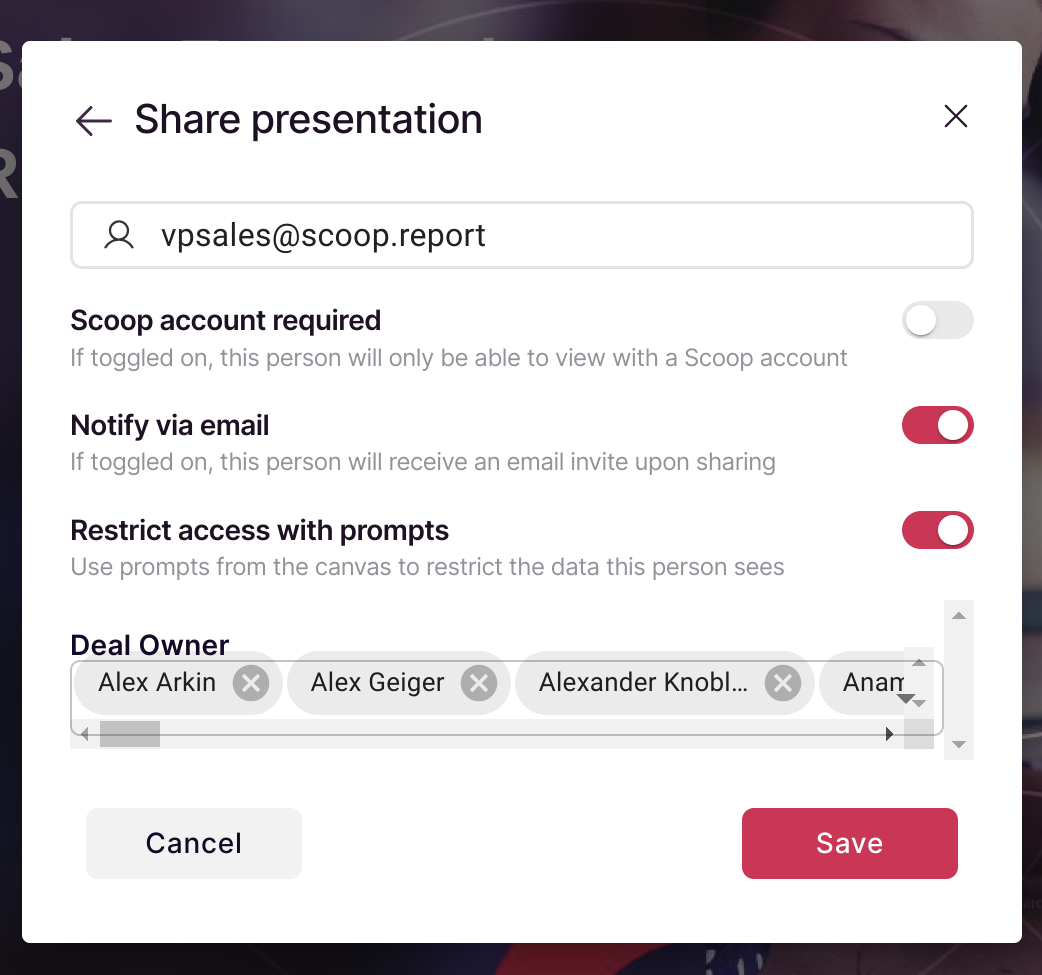
When sharing a canvas with specific users, you can preset their prompt values:
Personalized Access
- Share the canvas with "Invitation Only"
- Enable "Restrict Access with Prompts"
- For each invitee, set their prompt values
- They see only their filtered data
Example:
- Share with West region manager → Region prompt locked to "West"
- Share with East region manager → Region prompt locked to "East"
- Both see the same canvas, different data
Security Implications
Preset prompts provide:
- Data isolation between users
- No ability to see other regions/segments
- Single canvas serves multiple audiences
See Sharing a Presentation for complete sharing options.
Best Practices
Prompt Placement
- Position prompts at the top of your canvas
- Group related prompts together
- Make prompts visible without scrolling
Naming
- Use clear, descriptive labels
- Match terminology to your organization
- Add helper text if needed
Performance
- Limit the number of linked elements
- Use indexed columns for filtering
- Consider default filters to reduce initial load
Mobile Considerations
- Prompts work on mobile devices
- Use single-select for touch interfaces
- Test prompt interactions on smaller screens
Troubleshooting
Prompt Shows No Values
- Verify the source dataset has synced
- Check that the source column contains data
- Confirm the named range reference is correct
Element Doesn't Filter
- Verify the element is linked to the prompt
- Check that the link specifies the correct column
- Ensure column names match between prompt and element
Wrong Values Displayed
- Check if other prompts are also filtering
- Verify the filter logic (AND vs OR)
- Look for case sensitivity issues
Prompt Resets Unexpectedly
- Check for canvas reload/refresh
- Verify sharing settings
- Look for conflicting prompt defaults
Related Topics
- Interactive Charts and Tables - Elements that prompts control
- Sheetlets - Spreadsheet data on canvas
- Sharing a Presentation - Preset prompts for users
- Presenting a Canvas - Live presentations with prompts
Updated 8 months ago