Automatically Filling Data into a Presentation
One of Scoop's core strength's is it's connection to live data. Scoop attempts to allow a user to make as much of their data story live as possible - ensuring that users of that story have the latest information possible at all times and eliminating the need for creating countless copies of standard presentations and manually updating each of them, with the inevitable challenge of keeping it all in order.
In addition to allowing you to layer native Scoop visualizations and tables into your presentation, Scoop also lets you make the data in your text fields live as well and enables you to back highly formatted presentation tables with live data as well.
Filling Tables
Many presentations include tabular summaries of data. Sometimes this can be financial data, sometimes other data. However it falls on the shoulders of the presentation creator to manually enter data into those tables and keep it up to date. While it is possible to embed a spreadsheet image into a presentation, those embedded spreadsheets have limited formatting and tend to look undesigned. As a result, most presentations that require a degree of polish end up with manually created tables.
Scoop solves this by allowing you to dynamically fill a presentation table with data from a Scoop live sheet. That data can be calculated with live Scoop data or any other data contained in your live sheet. Below is an example of a table that gives a simple revenue growth projection.
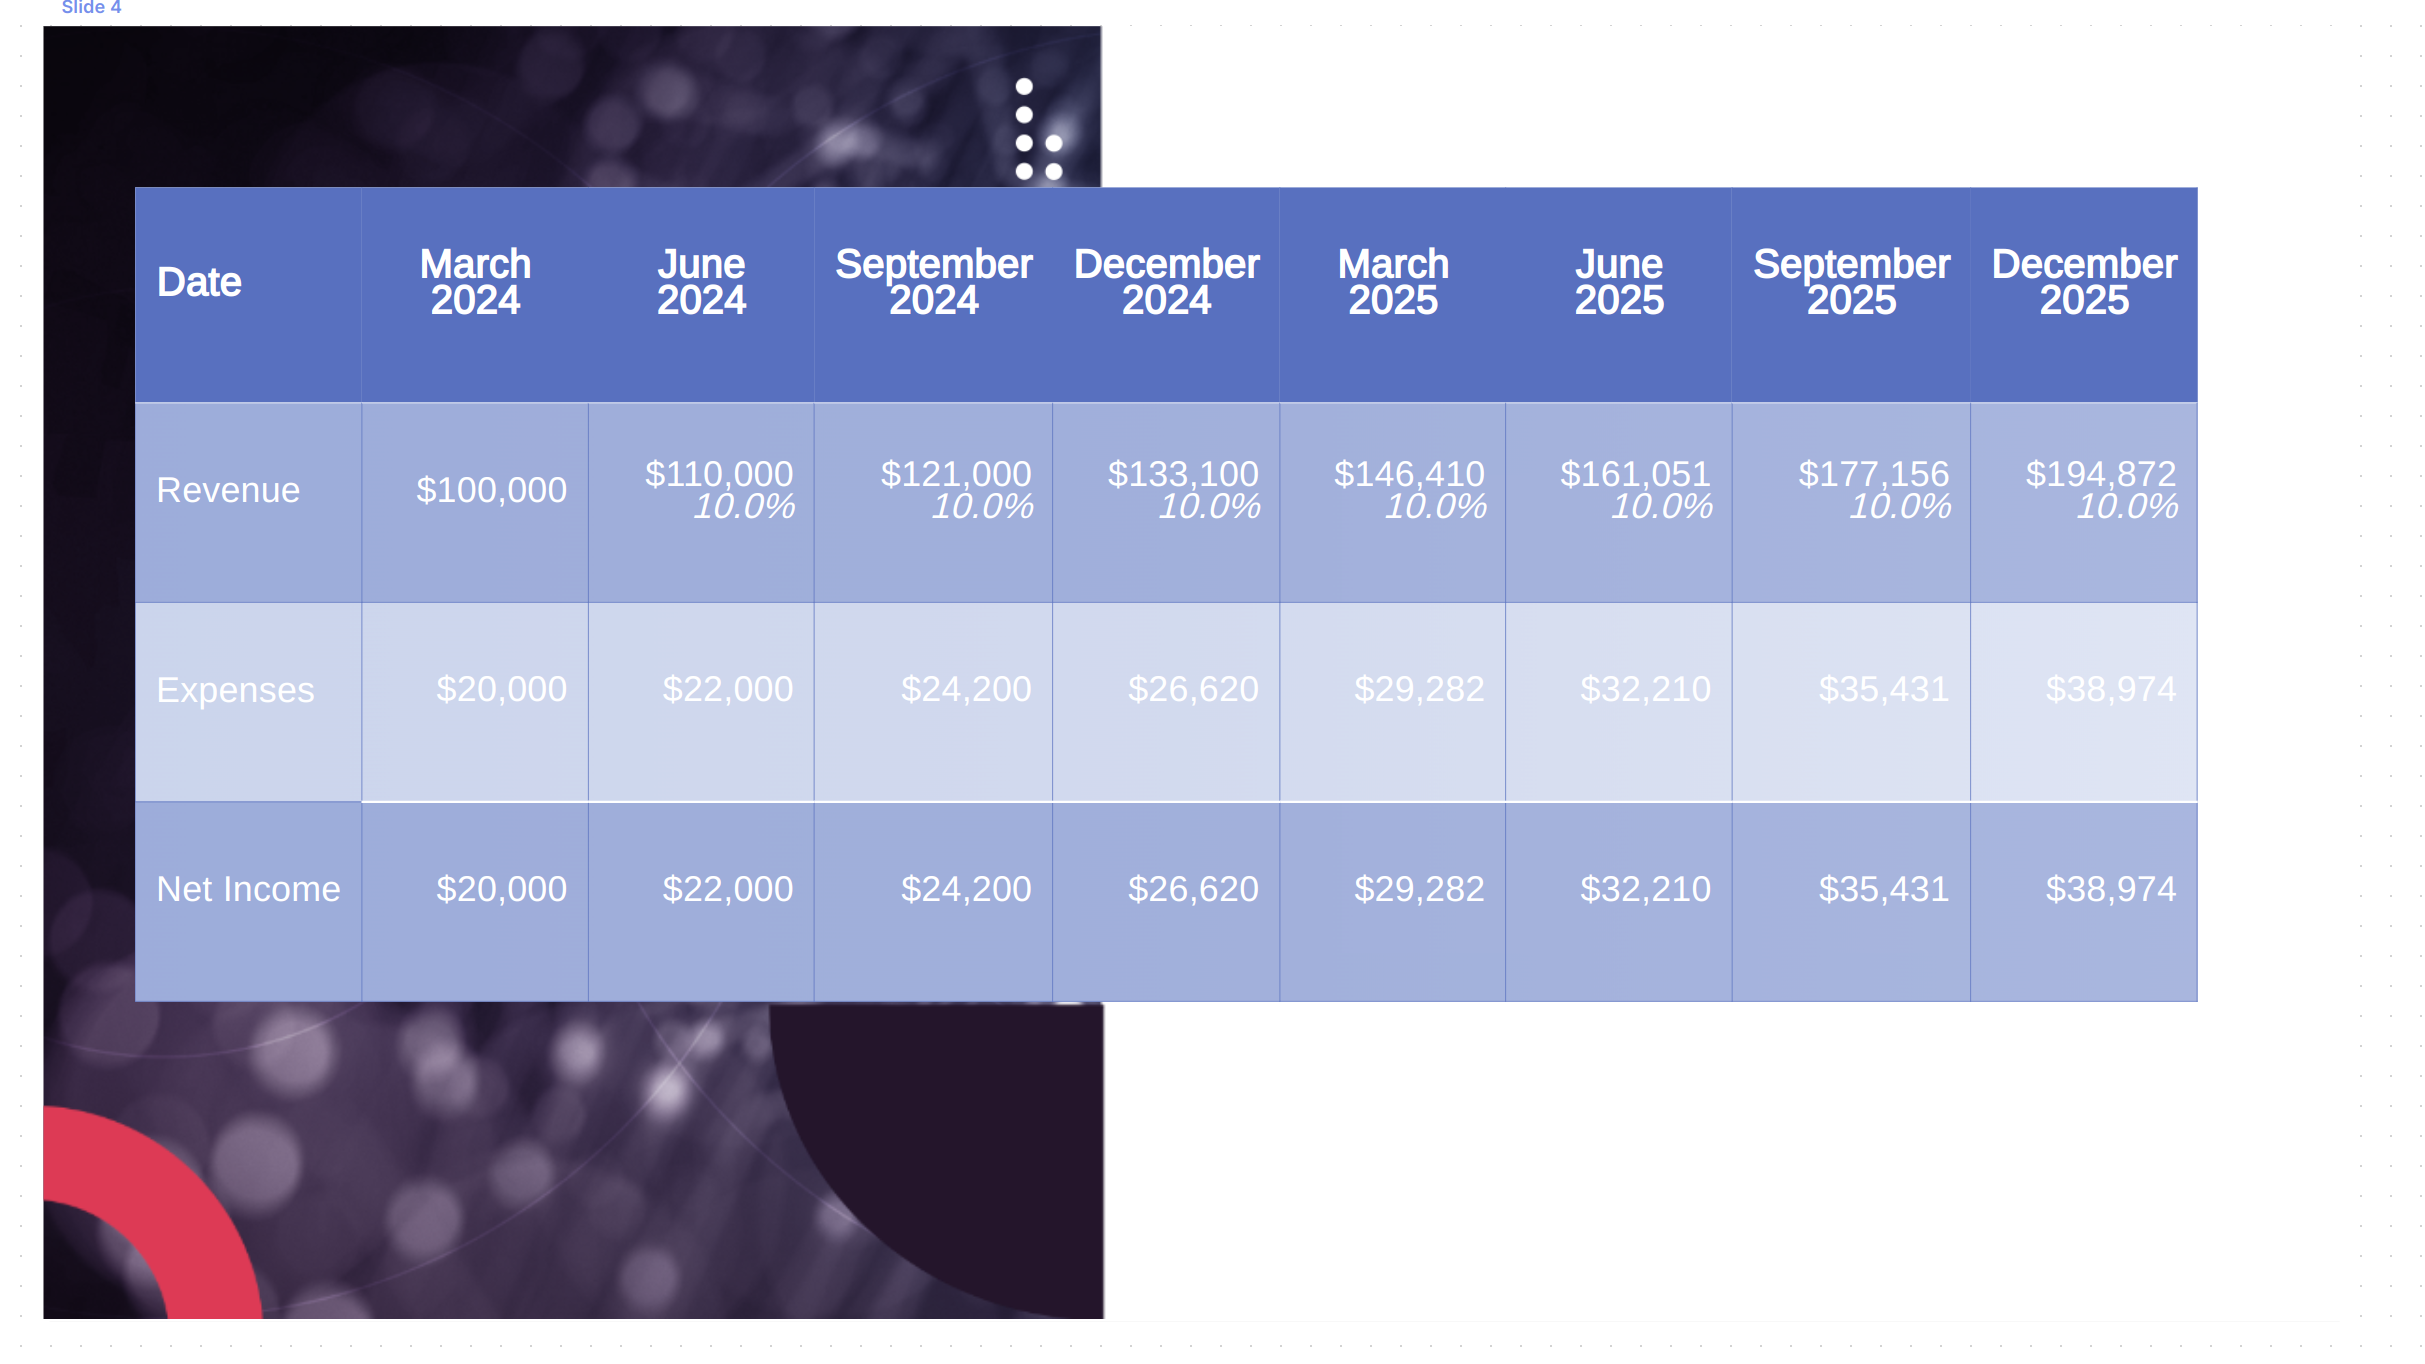
While that table looks like it was manually entered, it was actually filled with data from a Scoop live sheet. In reality, the source presentation is a table with cells that are formatted as the user would like to see them as seen below originally in Google Sheets.
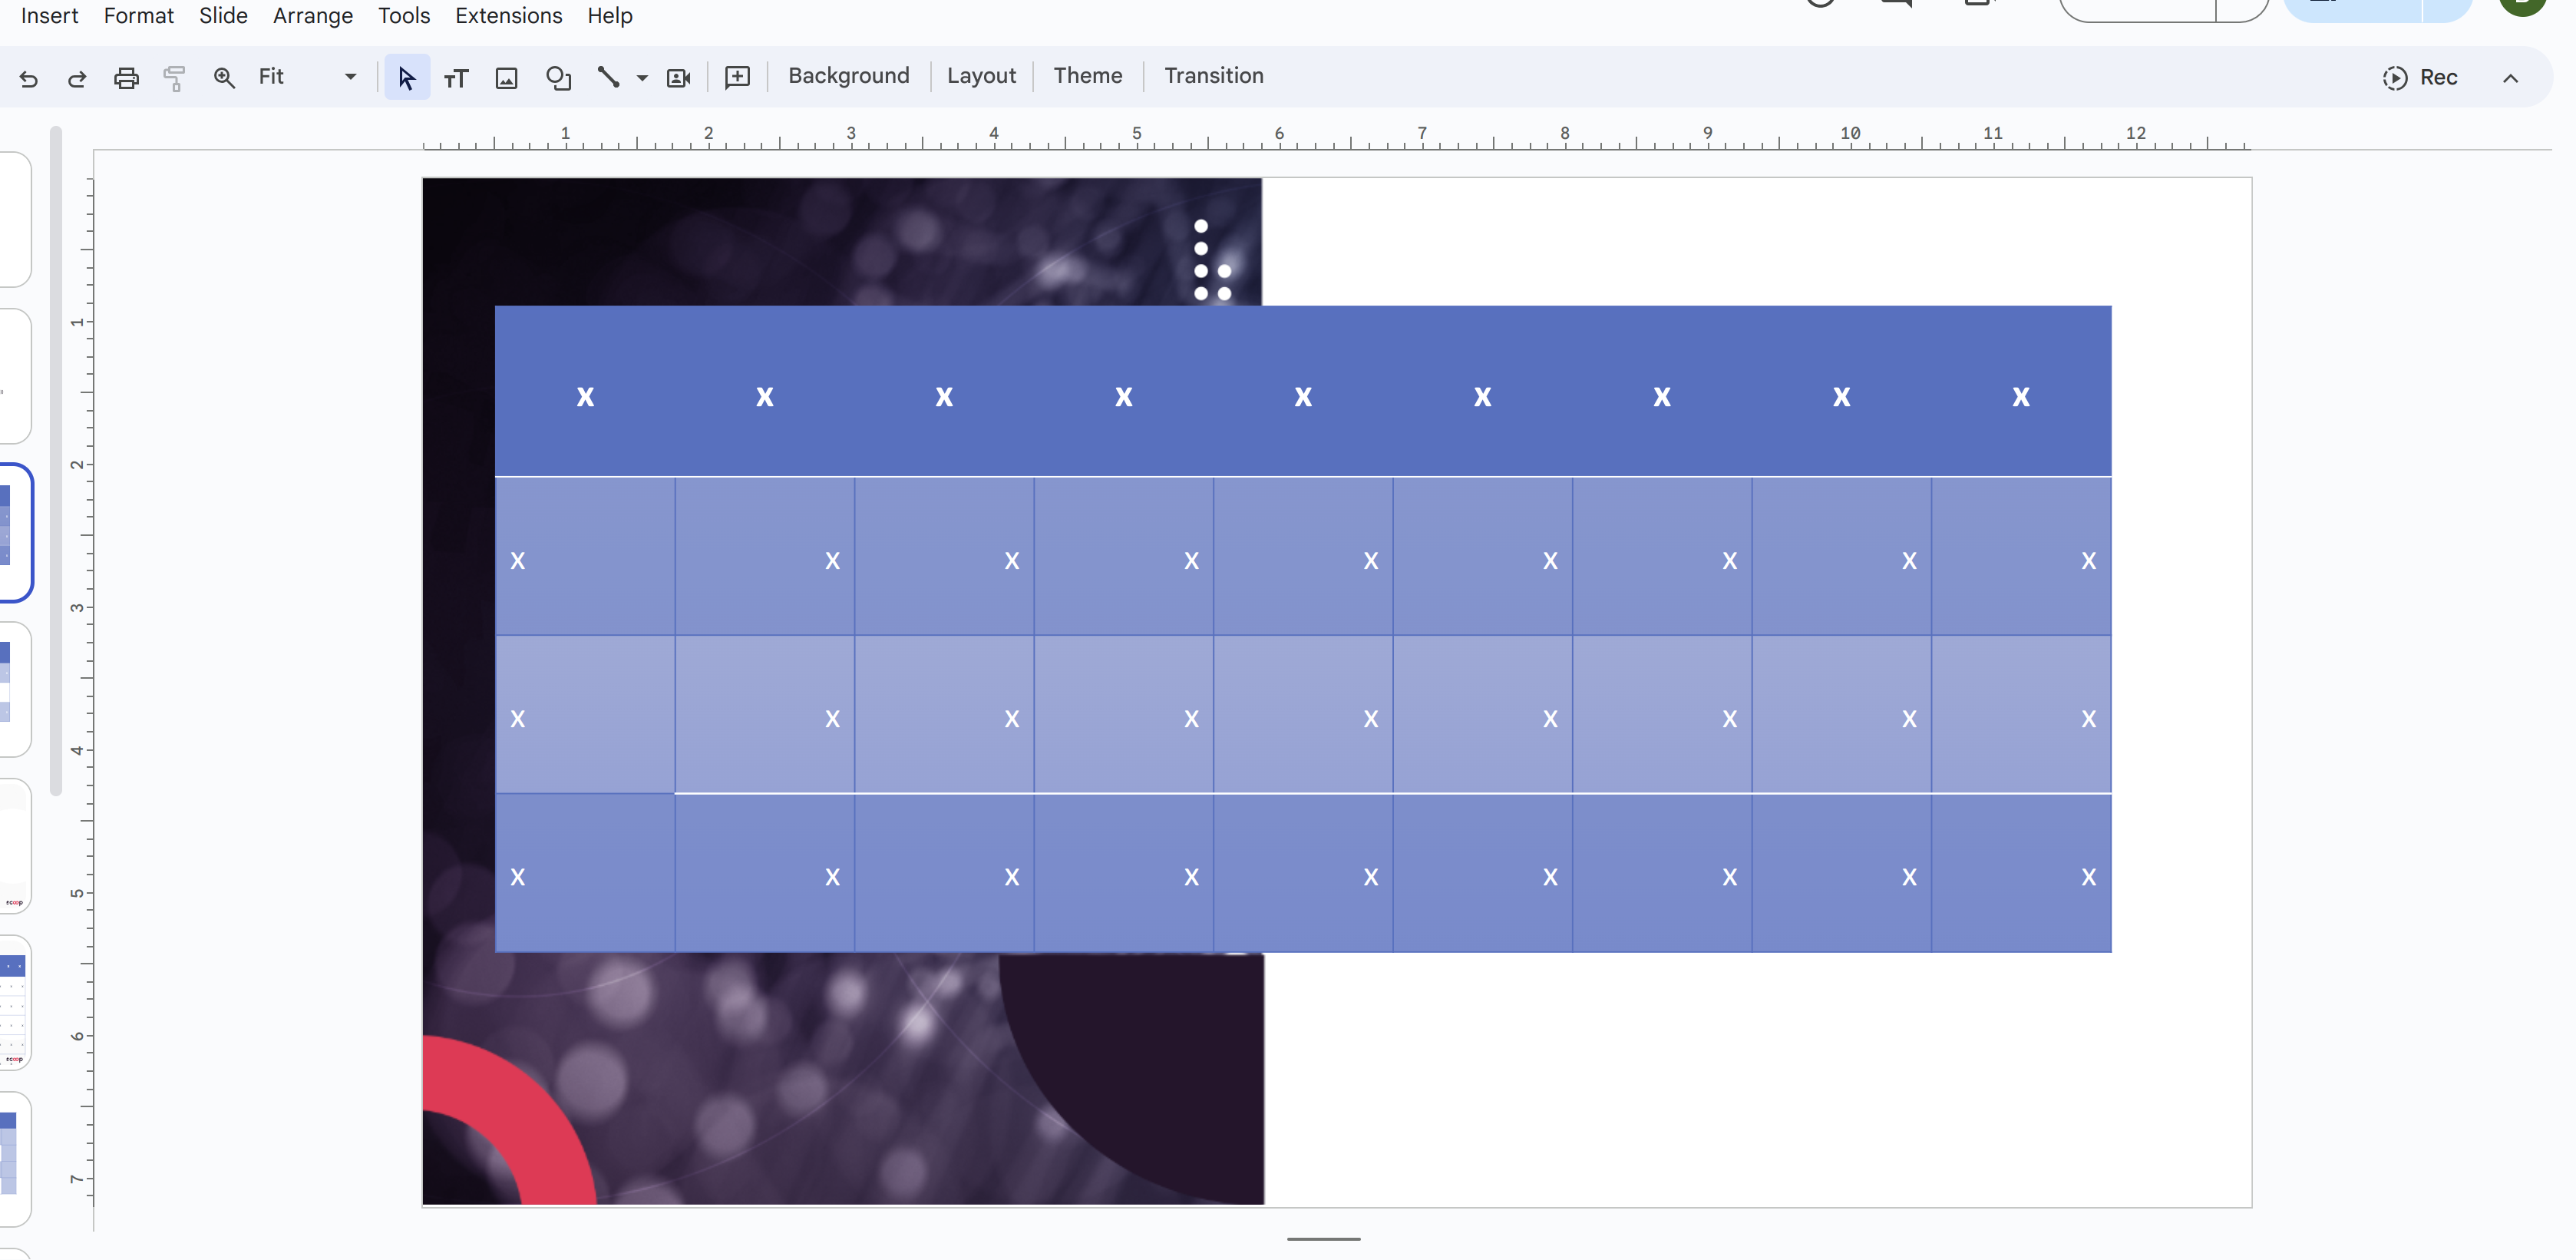
And below after it's been imported into Scoop as a canvas.
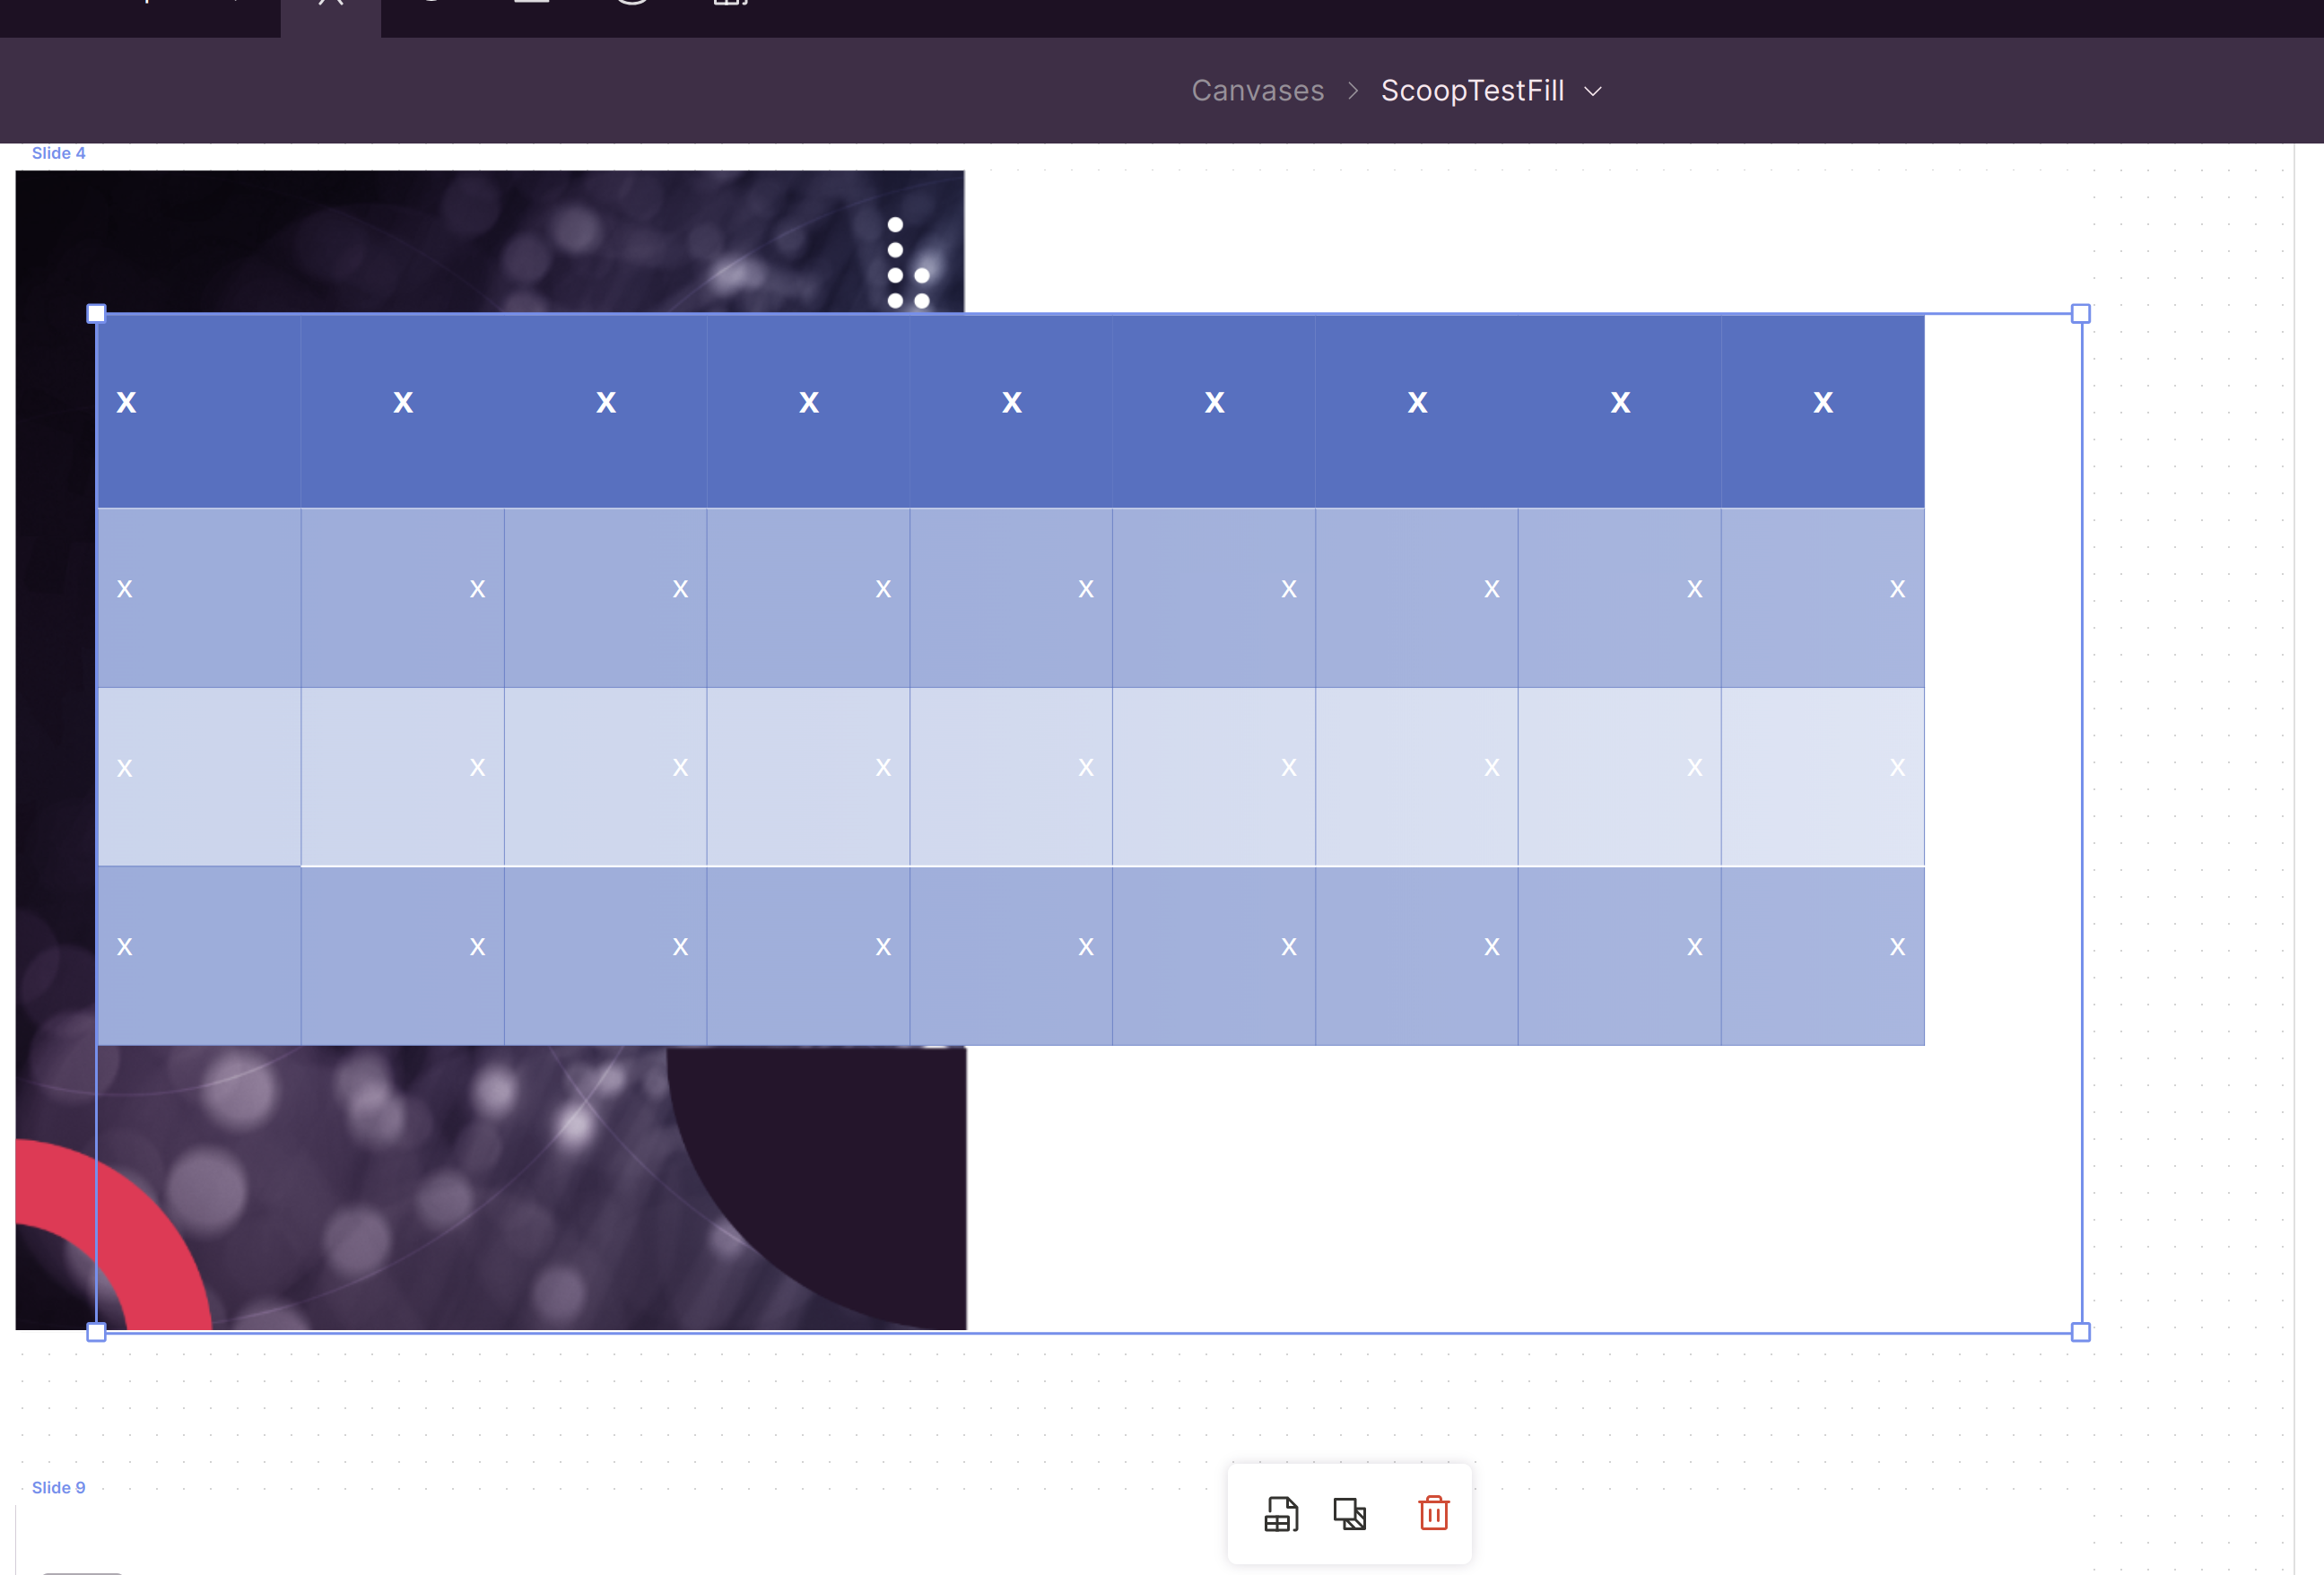
If there is a native presentation table in your imported slides (using the insert table feature), Scoop will detect that and there will be menu option on the lower left when you click on it in Scoop that will ask if you would like to fill that table with a range of data from a Scoop Live Sheet. Clicking on that icon brings up the following dialog.
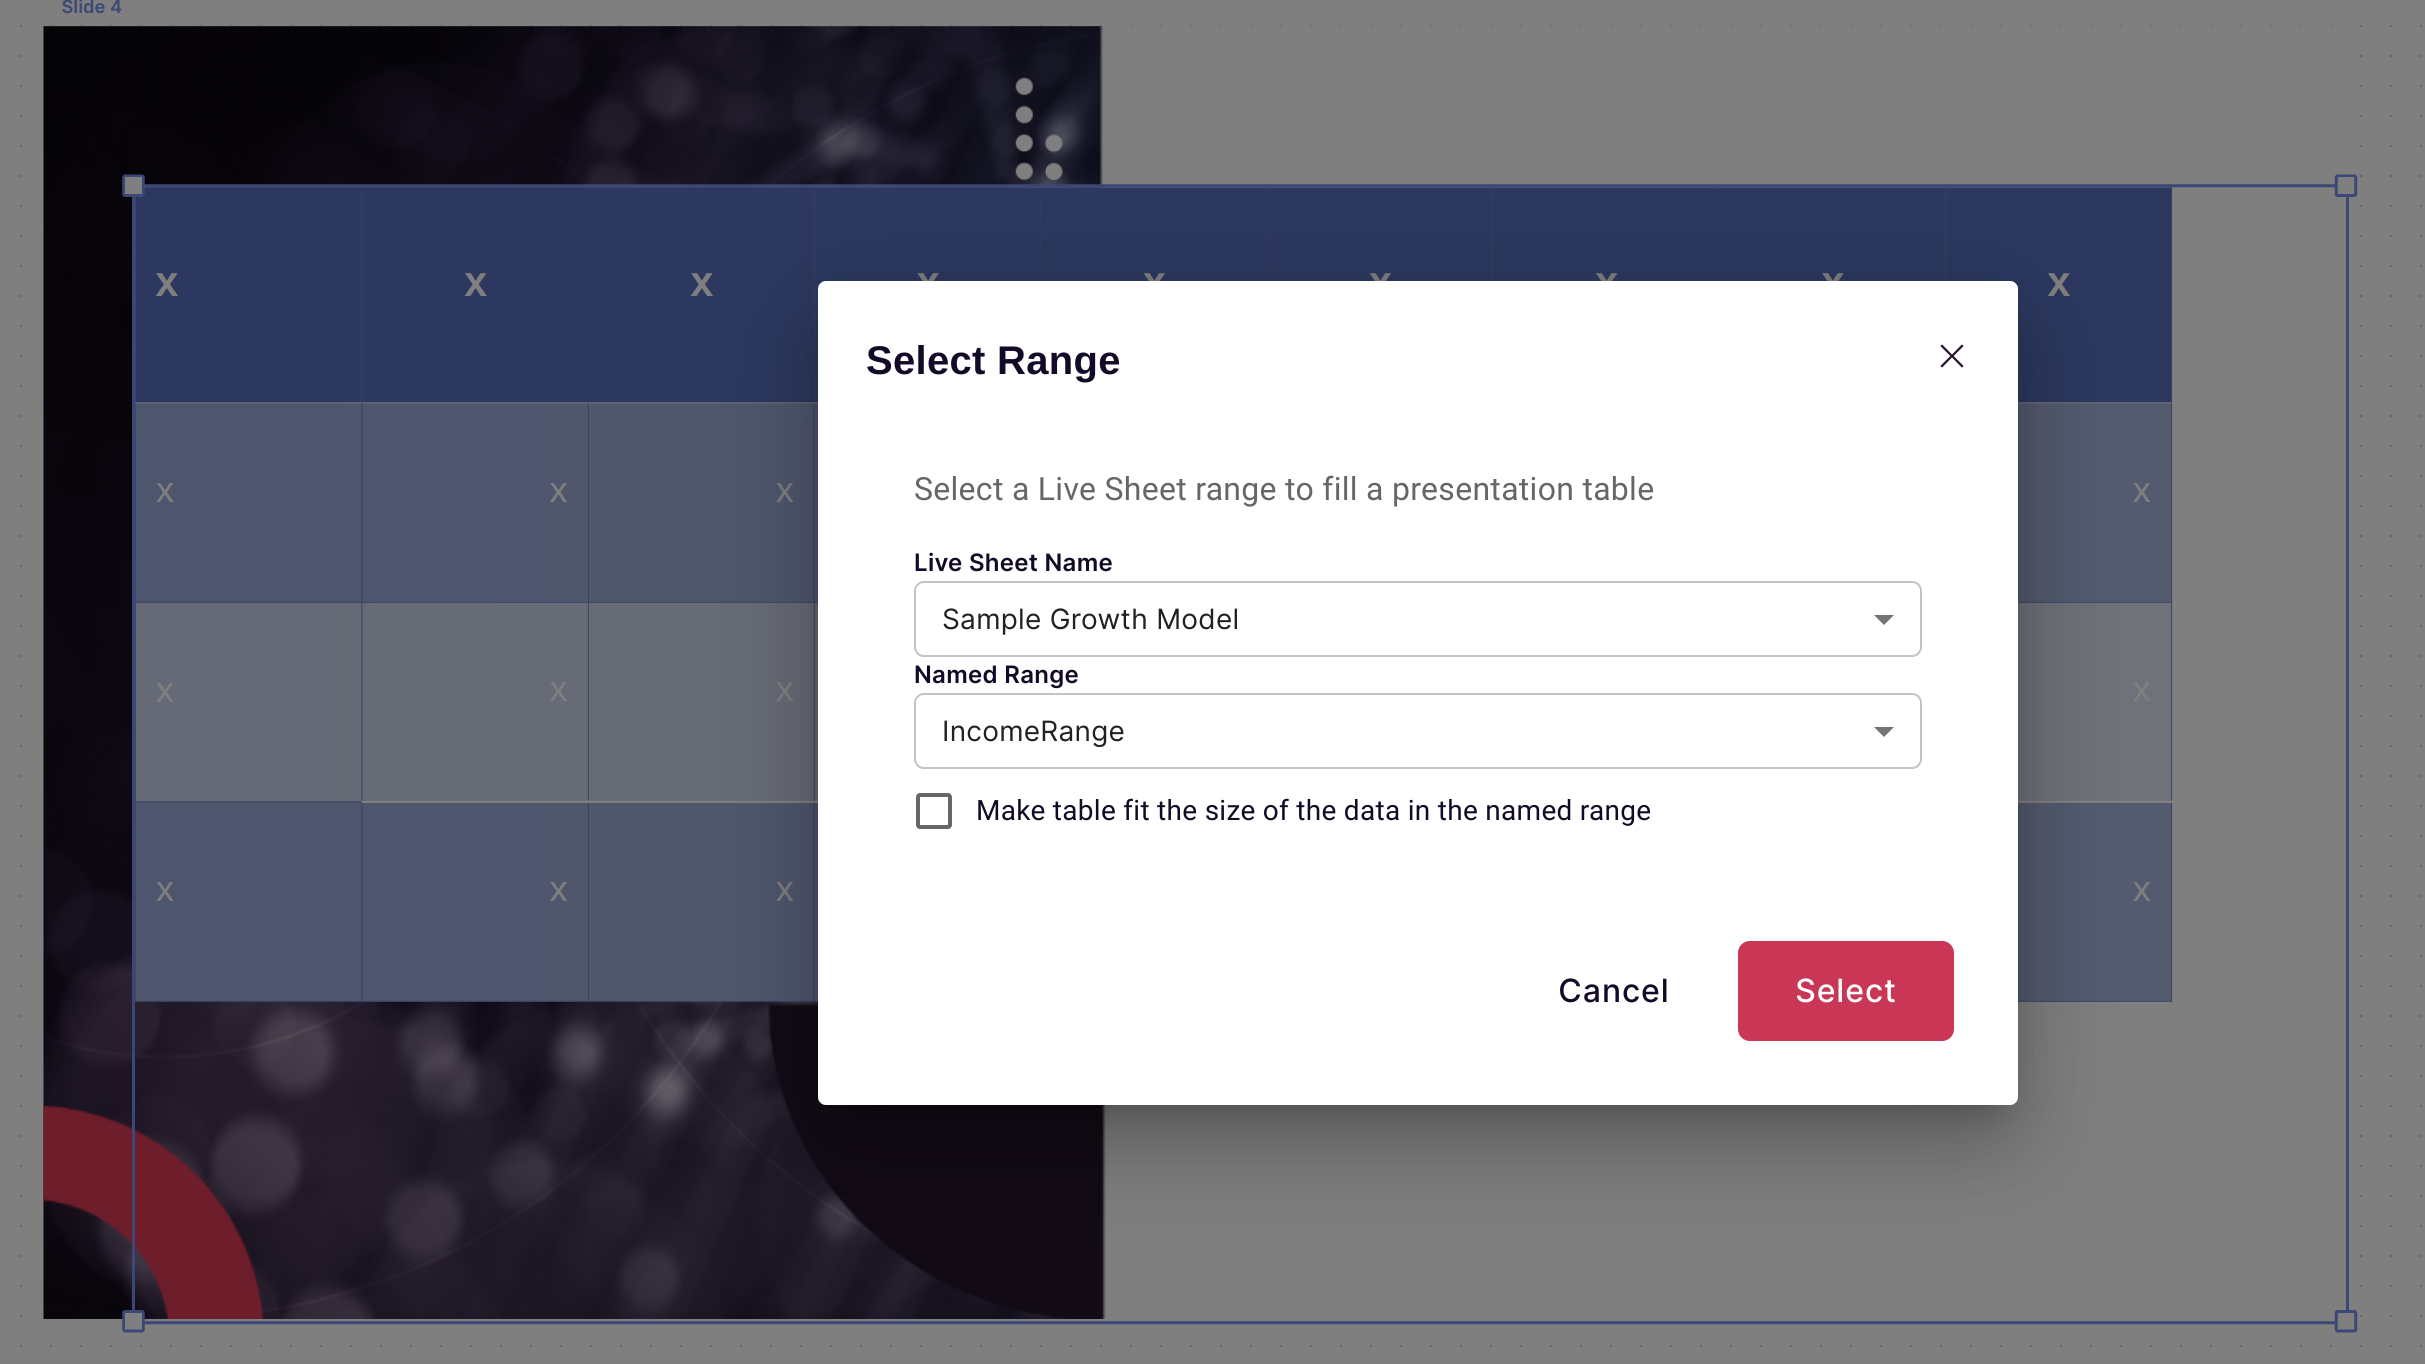
Here you can select a range from a Scoop Live Sheet. Below is an example of a range of data in Google Sheets from a Scoop Live Sheet. As you can see there is a named range called "Income Range". By selecting that range in the dialog above, when you display the table in Scoop, it will fill the table out with the data in the cell.
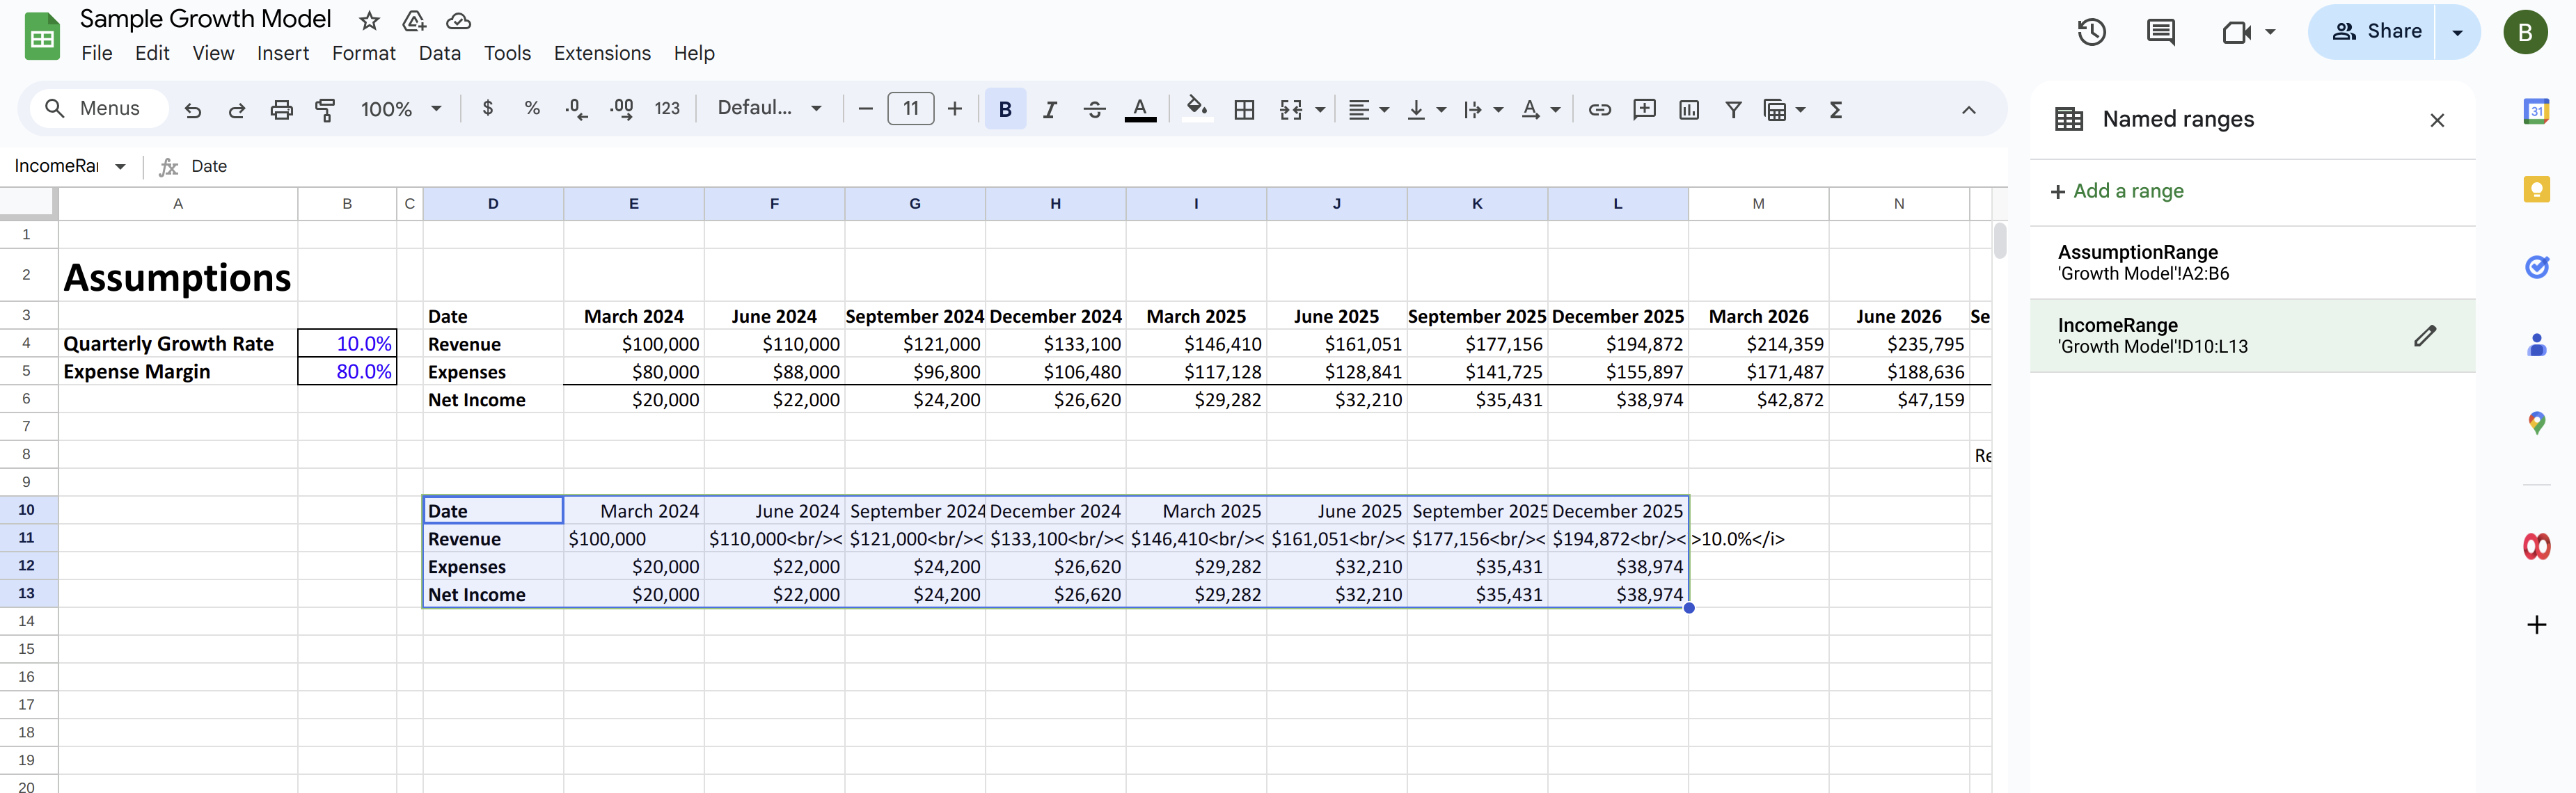
Note that Scoop will apply any numerical formatting that it has from your Live Sheet, but it will use any font or color formatting from your presentation. This gives you much more control over the visual look and feel of your data, while also providing the full range of numerical formatting options from your Live Sheet.
Automatically Expanding/Clipping the Size of Tables to Fit Your Data
You can see in the dialog an option to make the table fit the size of your data. If you select this, Scoop will dynamically size your table. If more columns are required it will add them. Likewise, if the data requires fewer columns, it will clip the unused columns. It will do the same with rows. This ensures that if your data size changes, you don't have to spend time re-sizing the table in the presentation backing it. You can simply use it as is.
Using HTML in Your Data for Highly Formatted Results
Notice below that within some of the cells, there is actually a spreadsheet calculation that returns some basic HTML, which is calculated.
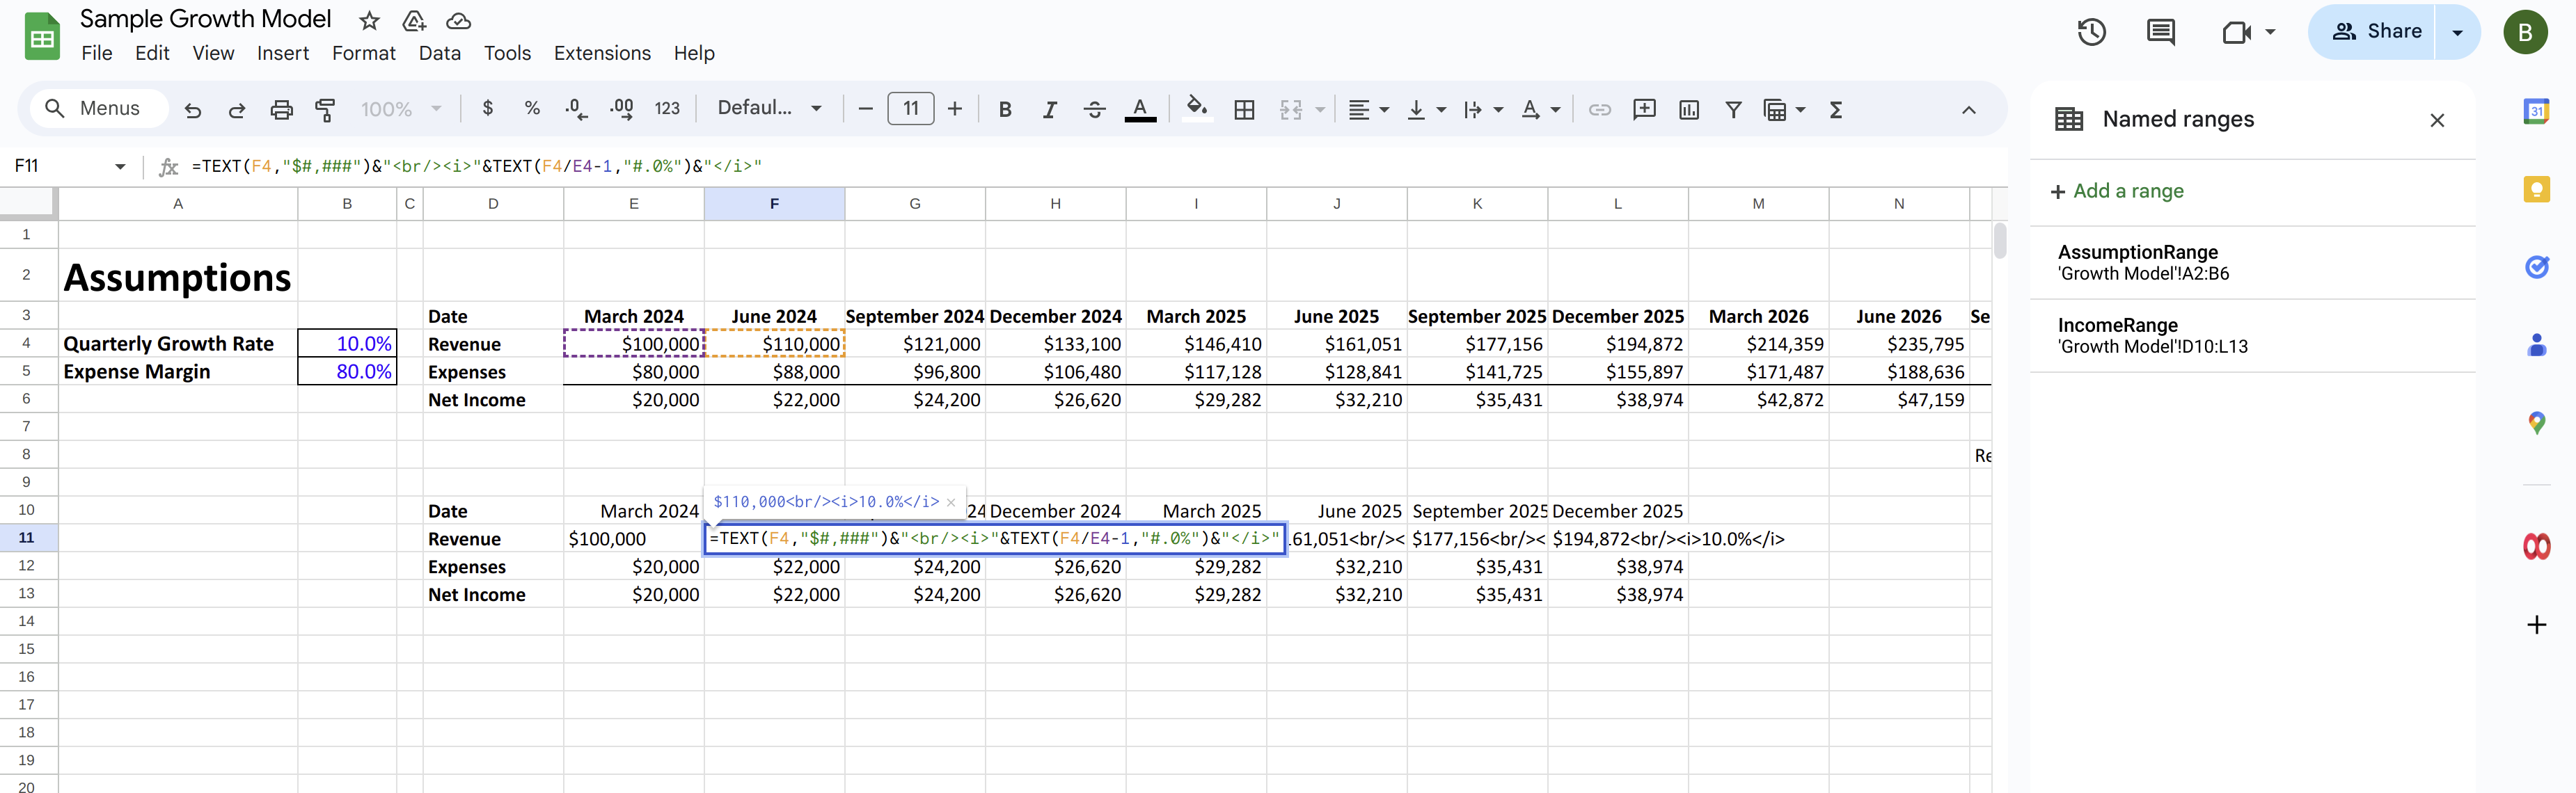
This allows a user to precisely control the content that goes into a cell, even beyond what one might do with a presentation tool alone. One can embed images for example, or dynamically change colors and styles based on data - well beyond what conditional formatting can do.
Filling Individual Values
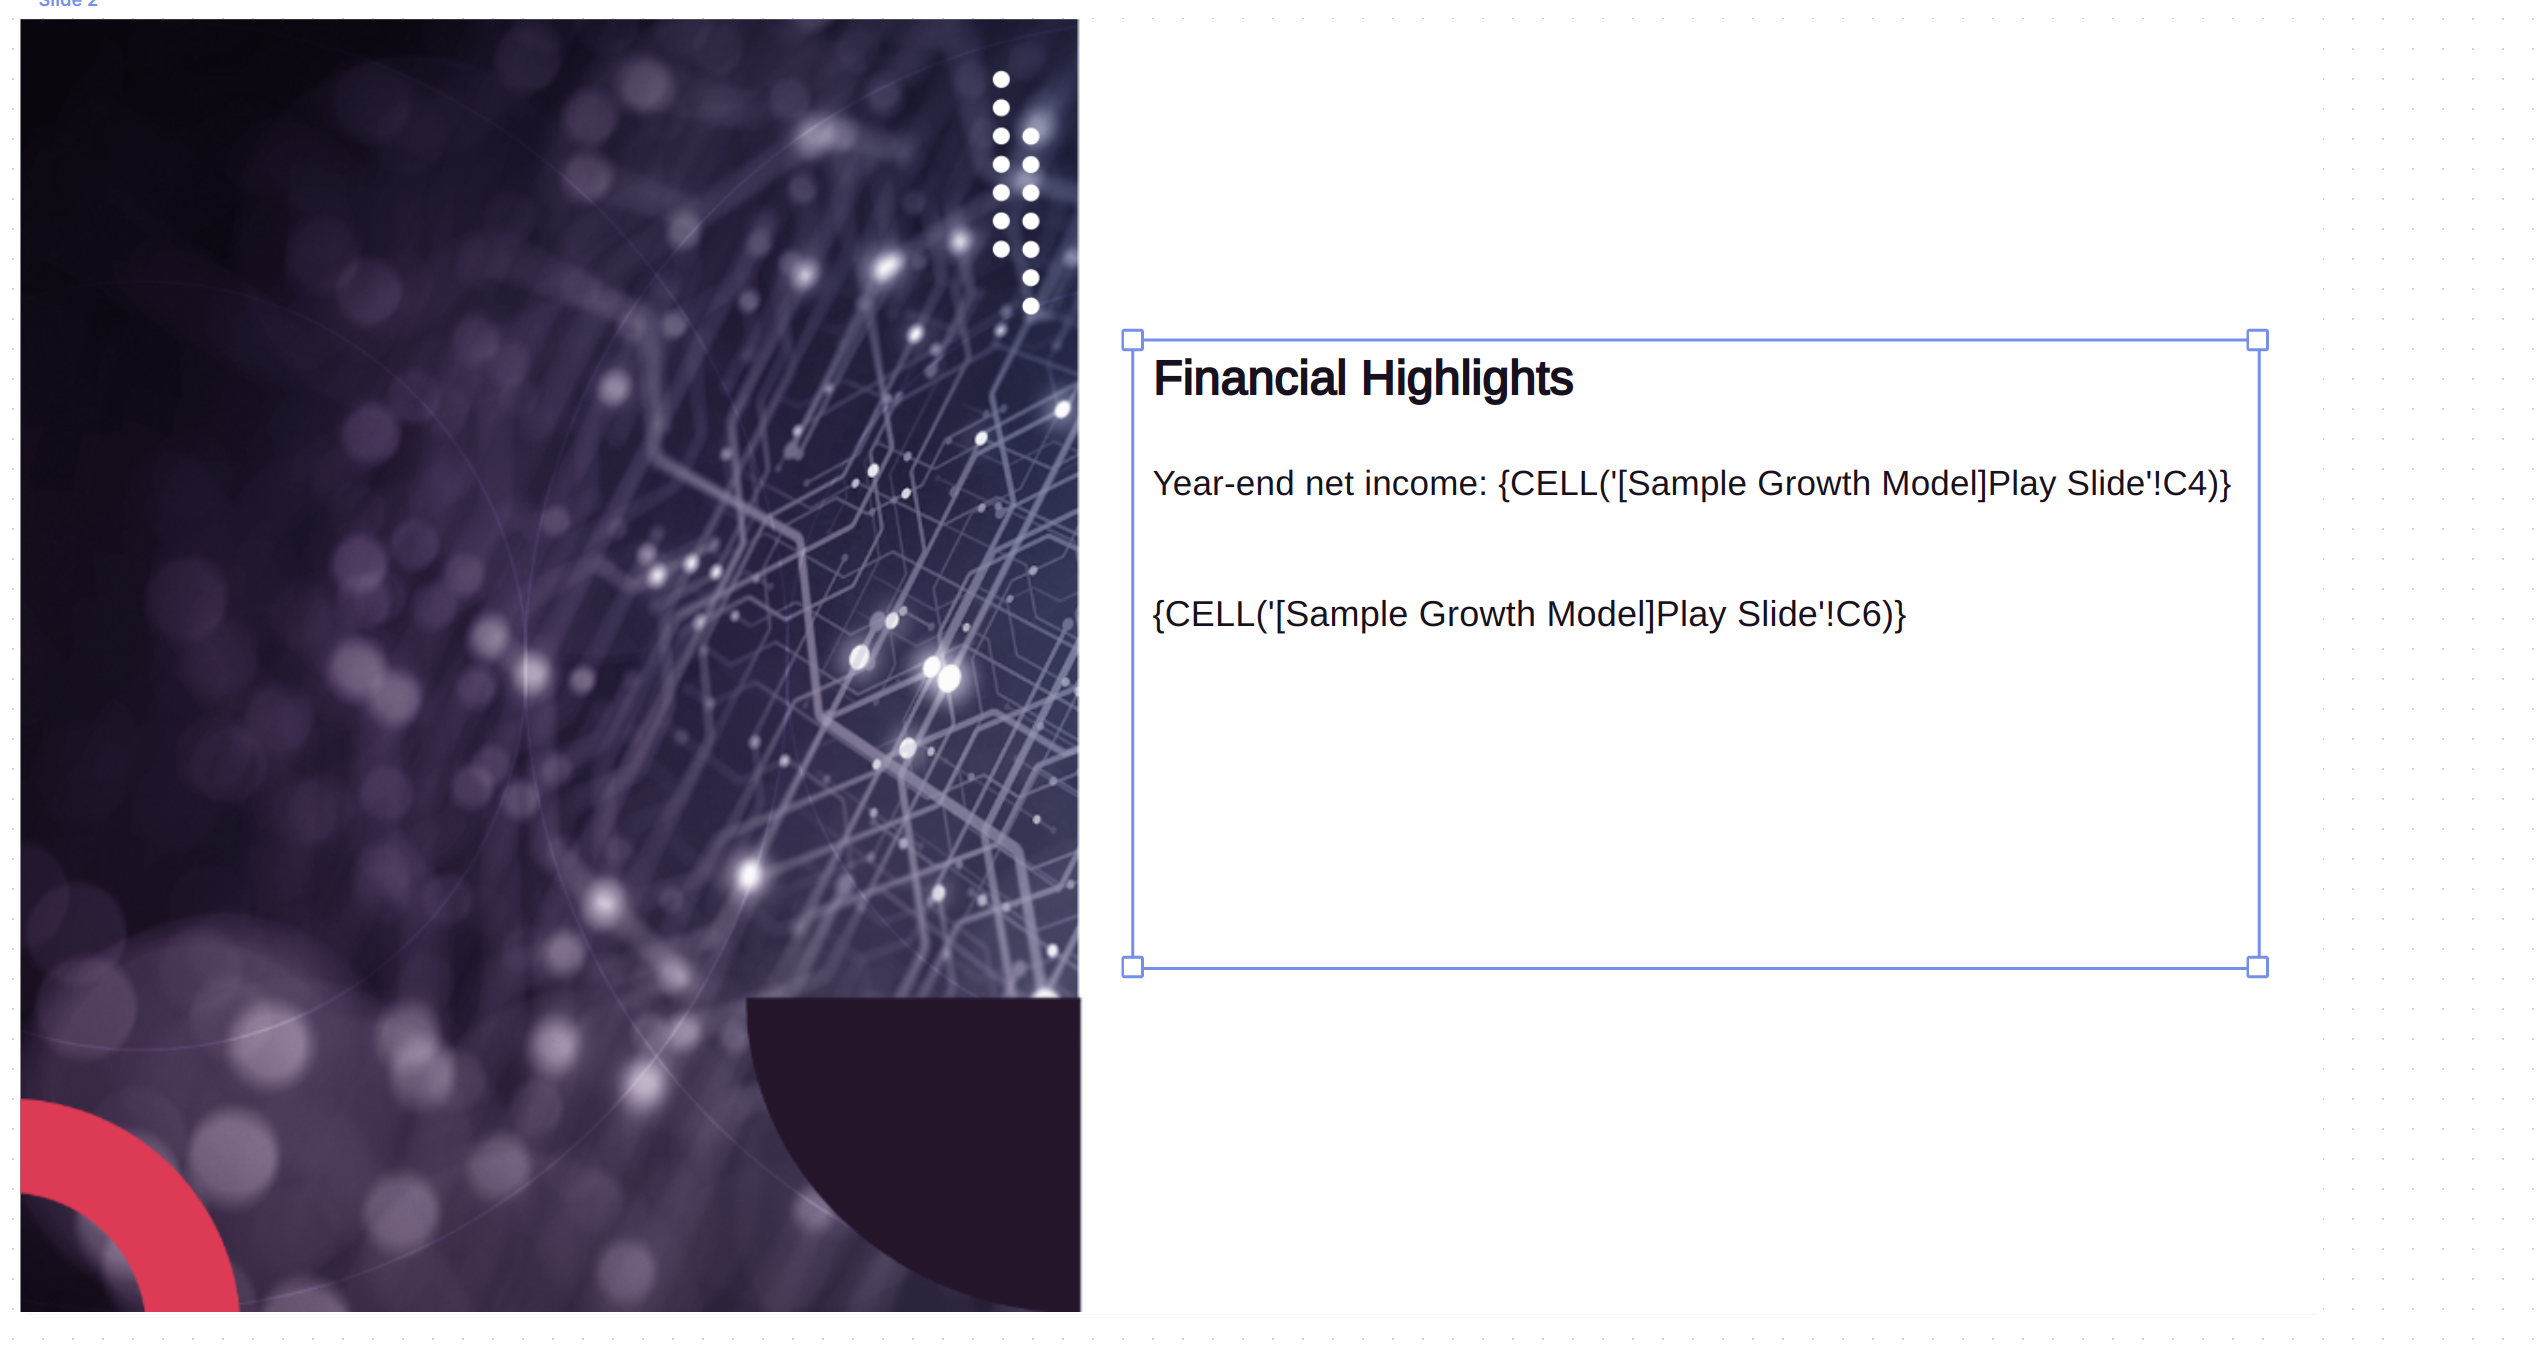
In addition to filling tables, Scoop can replace values anywhere in a text object with a cell reference to a live sheet. This means one can make text and other elements live with up-to-date KPIs and other calculations. For example the slide below contains three references to cells in the Scoop Live Sheet.

As one can see below, when not editing the cell, those values are filled with the values from the Scoop Live Sheet. Note as well, that Scoop retains the number formatting from the Live Sheet with the data.

As in tables, Scoop can also bring in HTML in a calculated value that can allow one to do things like bring in conditional links to images.
If the second cell is calculated HTML as below,
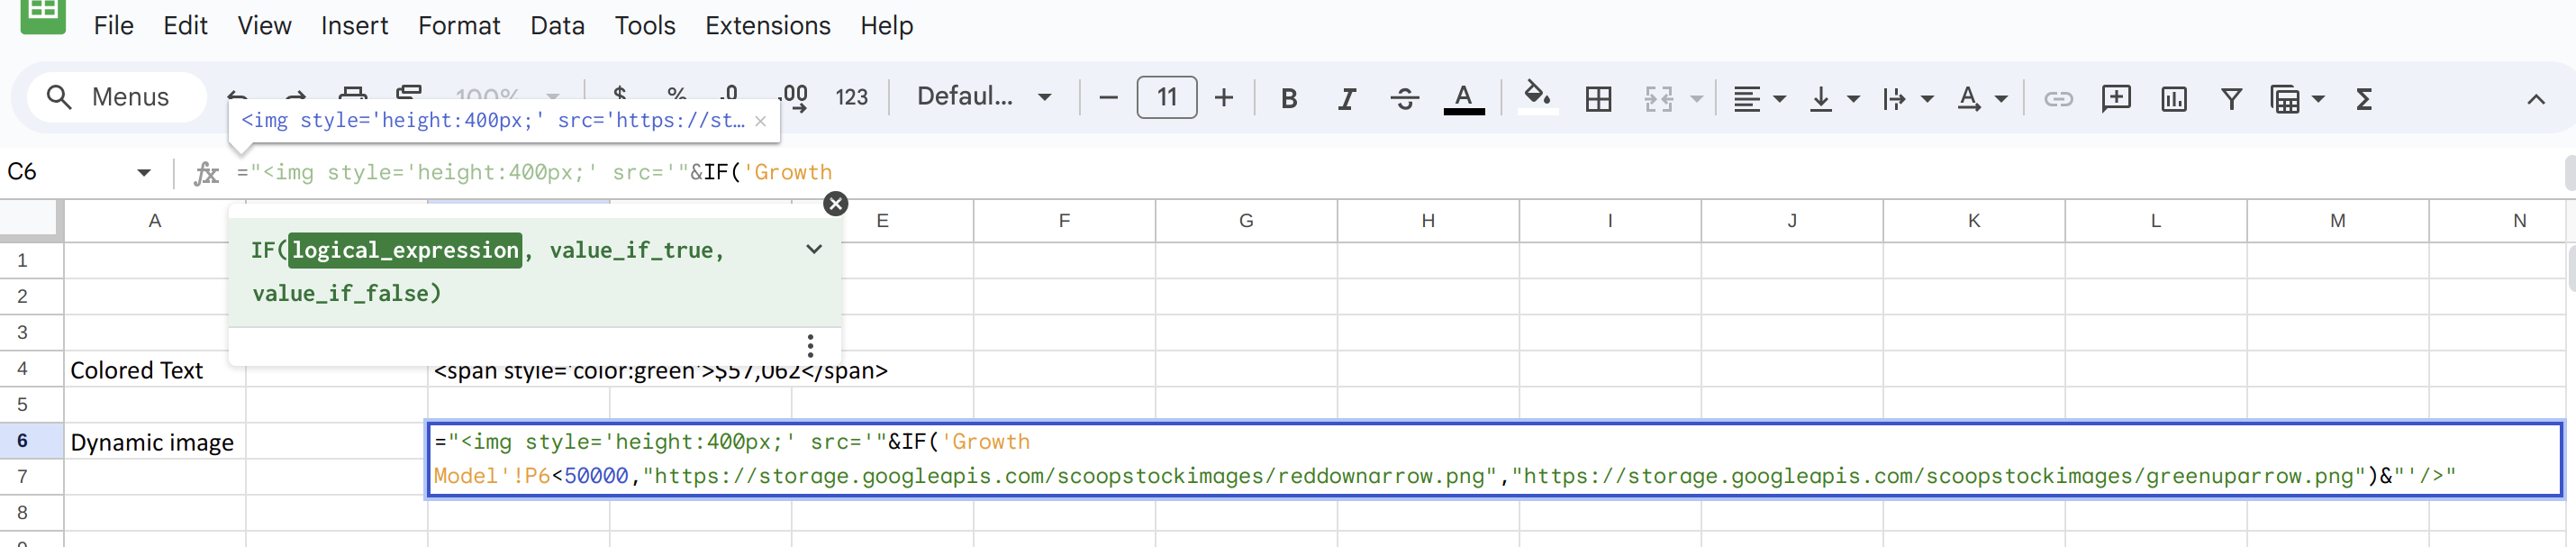
You can create very dynamic visual presentations.

Updated 8 months ago