Canvas Objects
Build interactive presentations with data visualizations, spreadsheets, and rich media
Canvas objects are the building blocks of Scoop presentations. Combine data visualizations, interactive spreadsheets, process diagrams, and rich media to create compelling, data-driven stories.
Object Types Overview
| Object Type | Purpose | Interactive? |
|---|---|---|
| Scoop Summary | Charts and tables from your data | Yes - filters, drills |
| Sheetlets | Live spreadsheet windows | Yes - edit cells |
| Process Diagrams | Sankey flows and funnels | Yes - click stages |
| Frames | Slide backgrounds and layouts | No |
| Rich Text | Formatted text and narratives | Edit mode only |
| Arrows | Visual callouts and connections | No |
| Images | Logos, diagrams, photos | No |
| Videos | Embedded video content | Yes - playback |
Accessing the Toolbar
In canvas edit mode, the object toolbar appears on the left side:
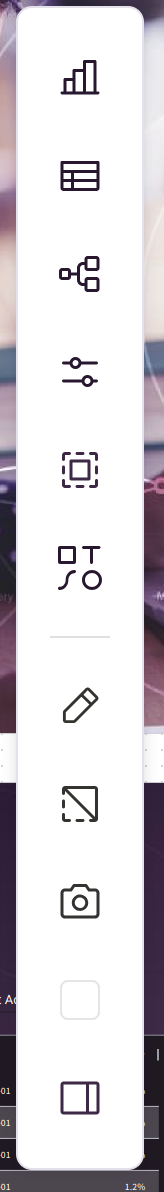
Click any icon to add that object type to your canvas.
Data Objects
Scoop Summary (Charts & Tables)
Data visualizations created in Scoop Explorer:
| Feature | Description |
|---|---|
| Chart types | Bar, line, pie, scatter, KPI cards, and more |
| Tables | Formatted data tables with conditional formatting |
| Interactivity | Click to filter, drill down into details |
| Live data | Updates when underlying dataset refreshes |
To add a Scoop Summary:
- Click the Summary icon in toolbar
- Select an existing visualization or create new
- Position and resize on canvas
Interactivity options:
- Filter other objects when clicked
- Drill into dimensional hierarchies
- Export underlying data
See Chart Types for visualization options.
Sheetlets
Live windows into Scoop LiveSheets with bi-directional editing:
| Feature | Description |
|---|---|
| Named ranges | Display specific cells from a worksheet |
| Live editing | Changes update the underlying LiveSheet |
| Recalculation | All dependent formulas recalculate instantly |
| Formatting | Full control over appearance |
Use cases:
- Interactive assumptions panels
- Data entry forms
- What-if scenario controls
- Calculation results displays
How it works:
- Define a named range in your LiveSheet
- Add sheetlet to canvas, select the range
- Edit cells directly on canvas
- All connected objects update automatically
See Sheetlets for complete documentation.
Process Diagrams
Visualize flows and conversions with Sankey diagrams:
| Feature | Description |
|---|---|
| Stage flows | Show progression through stages |
| Conversion rates | Width indicates volume at each stage |
| Drill-down | Click stages to see underlying records |
| Snapshots | Based on snapshotted entity data |
Common uses:
- Sales pipeline flow
- Customer journey mapping
- Support ticket progression
- Lead conversion funnels
See Process Analysis for details.
Visual Objects
Rich Text Box
Powerful text editing for narratives and annotations:
| Capability | Options |
|---|---|
| Font styling | Bold, italic, underline, size, color |
| Paragraph | Alignment, spacing, indentation |
| Lists | Bulleted and numbered |
| Links | Hyperlinks to URLs |
| Embedded | Images and tables within text |
Best for:
- Insight narratives
- Section headers
- Explanatory text
- Key takeaways
Arrows
Draw attention to specific elements:
| Style | Use Case |
|---|---|
| Straight | Direct callouts |
| Curved | Flowing connections |
| Colored | Emphasis with brand colors |
Tips:
- Point to key data points
- Connect related elements
- Highlight trends or anomalies
Images
Embed visual assets:
| Use Case | Example |
|---|---|
| Branding | Company logo |
| Context | Product photos |
| Diagrams | Architecture or process images |
| Icons | Visual indicators |
Supported formats: PNG, JPG, GIF, SVG
Videos
Embed video content:
| Source | Support |
|---|---|
| YouTube | Embed URL |
| Vimeo | Embed URL |
| Uploaded | Direct file upload |
Use cases:
- Training content
- Product demos
- Executive messages
- Context and background
Frames
Frames are the slide backgrounds of your canvas:
| Feature | Description |
|---|---|
| Background | Color, image, or imported slide |
| Layout | Define presentation structure |
| Order | Sequence for presentation mode |
| Google Slides sync | Update from source slides |
Frame Management
| Action | How |
|---|---|
| Add frame | Click Frame icon in toolbar |
| Reorder | Drag in frame manager |
| Edit background | Select frame, modify properties |
| Delete | Remove from frame manager |
Google Slides Integration
If frames were imported from Google Slides:
- Edit the slide in Google Slides
- Return to Scoop canvas
- Click "Update from slides"
- Changes sync automatically
This allows you to use Google Slides for design while Scoop handles data.
Toolbar Actions
Beyond adding objects, the toolbar provides:
| Action | Description |
|---|---|
| Edit wrapper | Apply backgrounds and borders to objects |
| Snap to grid | Toggle alignment assistance |
| Capture thumbnail | Set canvas preview image |
| Background color | Change canvas background |
| Frame manager | Organize and reorder frames |
Object Wrappers
Customize object appearance:
| Setting | Options |
|---|---|
| Background | Solid color, transparent, gradient |
| Border | Color, thickness, style |
| Shadow | Drop shadow effects |
| Padding | Space around content |
| Corner radius | Rounded corners |
Apply to individual objects or all objects at once.
Working with Objects
Positioning
| Method | Description |
|---|---|
| Drag | Move objects freely |
| Snap to grid | Align to grid points |
| Alignment tools | Align multiple objects |
| Distribute | Space objects evenly |
Sizing
| Method | Description |
|---|---|
| Drag handles | Resize from corners/edges |
| Aspect lock | Maintain proportions |
| Precise size | Enter exact dimensions |
Layering
| Action | Result |
|---|---|
| Bring to front | Object appears on top |
| Send to back | Object appears behind others |
| Layer order | Control stacking sequence |
Best Practices
Layout Design
| Practice | Why |
|---|---|
| Visual hierarchy | Most important elements prominent |
| White space | Don't overcrowd |
| Alignment | Use grid for clean layouts |
| Consistency | Same styles across frames |
Data Objects
| Practice | Why |
|---|---|
| Limit per frame | 3-5 visualizations maximum |
| Clear labels | Ensure readability |
| Appropriate size | Data should be legible |
| Logical grouping | Related items together |
Performance
| Consideration | Recommendation |
|---|---|
| Image size | Optimize before upload |
| Video length | Keep embedded videos short |
| Object count | Balance richness with load time |
Related Topics
- Sheetlets - Interactive spreadsheet windows
- Charts - Data visualization types
- Process Analysis - Sankey diagrams
- Visual Themes - Consistent styling
Updated 8 months ago