Chat with Your Data
Chat with Scoop to visualize, analyze and discover with your data
Ever wish you could just ask your data questions—like chatting with a smart analyst, instead of wrestling with complex BI tools? With Scoop Analytics, you can. Our chat-powered analytics interface turns plain English (or any business language) into actionable insight, visualizations, and even full slide decks. All without writing a single SQL query or worrying about technical setup.
Why Use Chat?
Most analytics tools make you hunt for columns, build filters, or learn technical formulas. With Scoop, you just type what you want to know, and our AI does the rest:
- Understands your dataset's structure and business context.
- Builds the right charts, KPIs, or advanced analytics automatically.
- Answers follow-up questions, digs deeper, and adapts to your workflow.
Imagine having an analyst on call, ready to turn your questions into clear answers, complete with live visualizations and commentary.
Tip: Chat empowers business users, analysts, and spreadsheet power-users alike—no need to be a data scientist or coder. If you can use a spreadsheet and write an email, you can use Scoop chat.
How It Works
-
Access the Chat:
- Open the Insights tab in Scoop.
- Click on "Ask Scoop".
-
Start Typing Questions:
- Type a natural-language question or instruction, like:
- "Show me sales by region this quarter, broken down by product."
- "What changed since last month in our ticket pipeline?"
- "Which customers are most likely to churn?"
- You can also ask follow-up questions, refine your query, or explore different metrics—all in the same chat.
- Type a natural-language question or instruction, like:
-
Review Instantly Generated Results:
- Scoop's AI interprets your prompt, builds an appropriate query, and responds within seconds.
- You'll see:
- The answer table, chart, or KPI
- Short, business-focused summaries
- The logic behind the answer (filters, attributes used, etc.)
- You can drill deeper, add segmentation, or ask for a visual breakdown—all via chat.
Tip: You don't have to know exact column names or formulas. Scoop figures it out from your dataset—and if the columns aren't self-explanatory, you can teach Scoop by editing dataset column descriptions for even smarter results.
Chat Prompt Examples
Here are some real-world examples to get started:
| What You Type | What Scoop Does |
|---|---|
| "Show sales by month this year" | Creates a time series column chart showing monthly sales |
| "Break down pipeline by stage and owner" | Builds a bar chart or table of opportunities, grouped by stage and owner |
| "Which products had above-average revenue last quarter?" | Highlights top products, calculates averages, and visualizes winners |
| "How did tickets resolved this month compare to last?" | Runs a machine-learning period comparison, returns key changes and drivers |
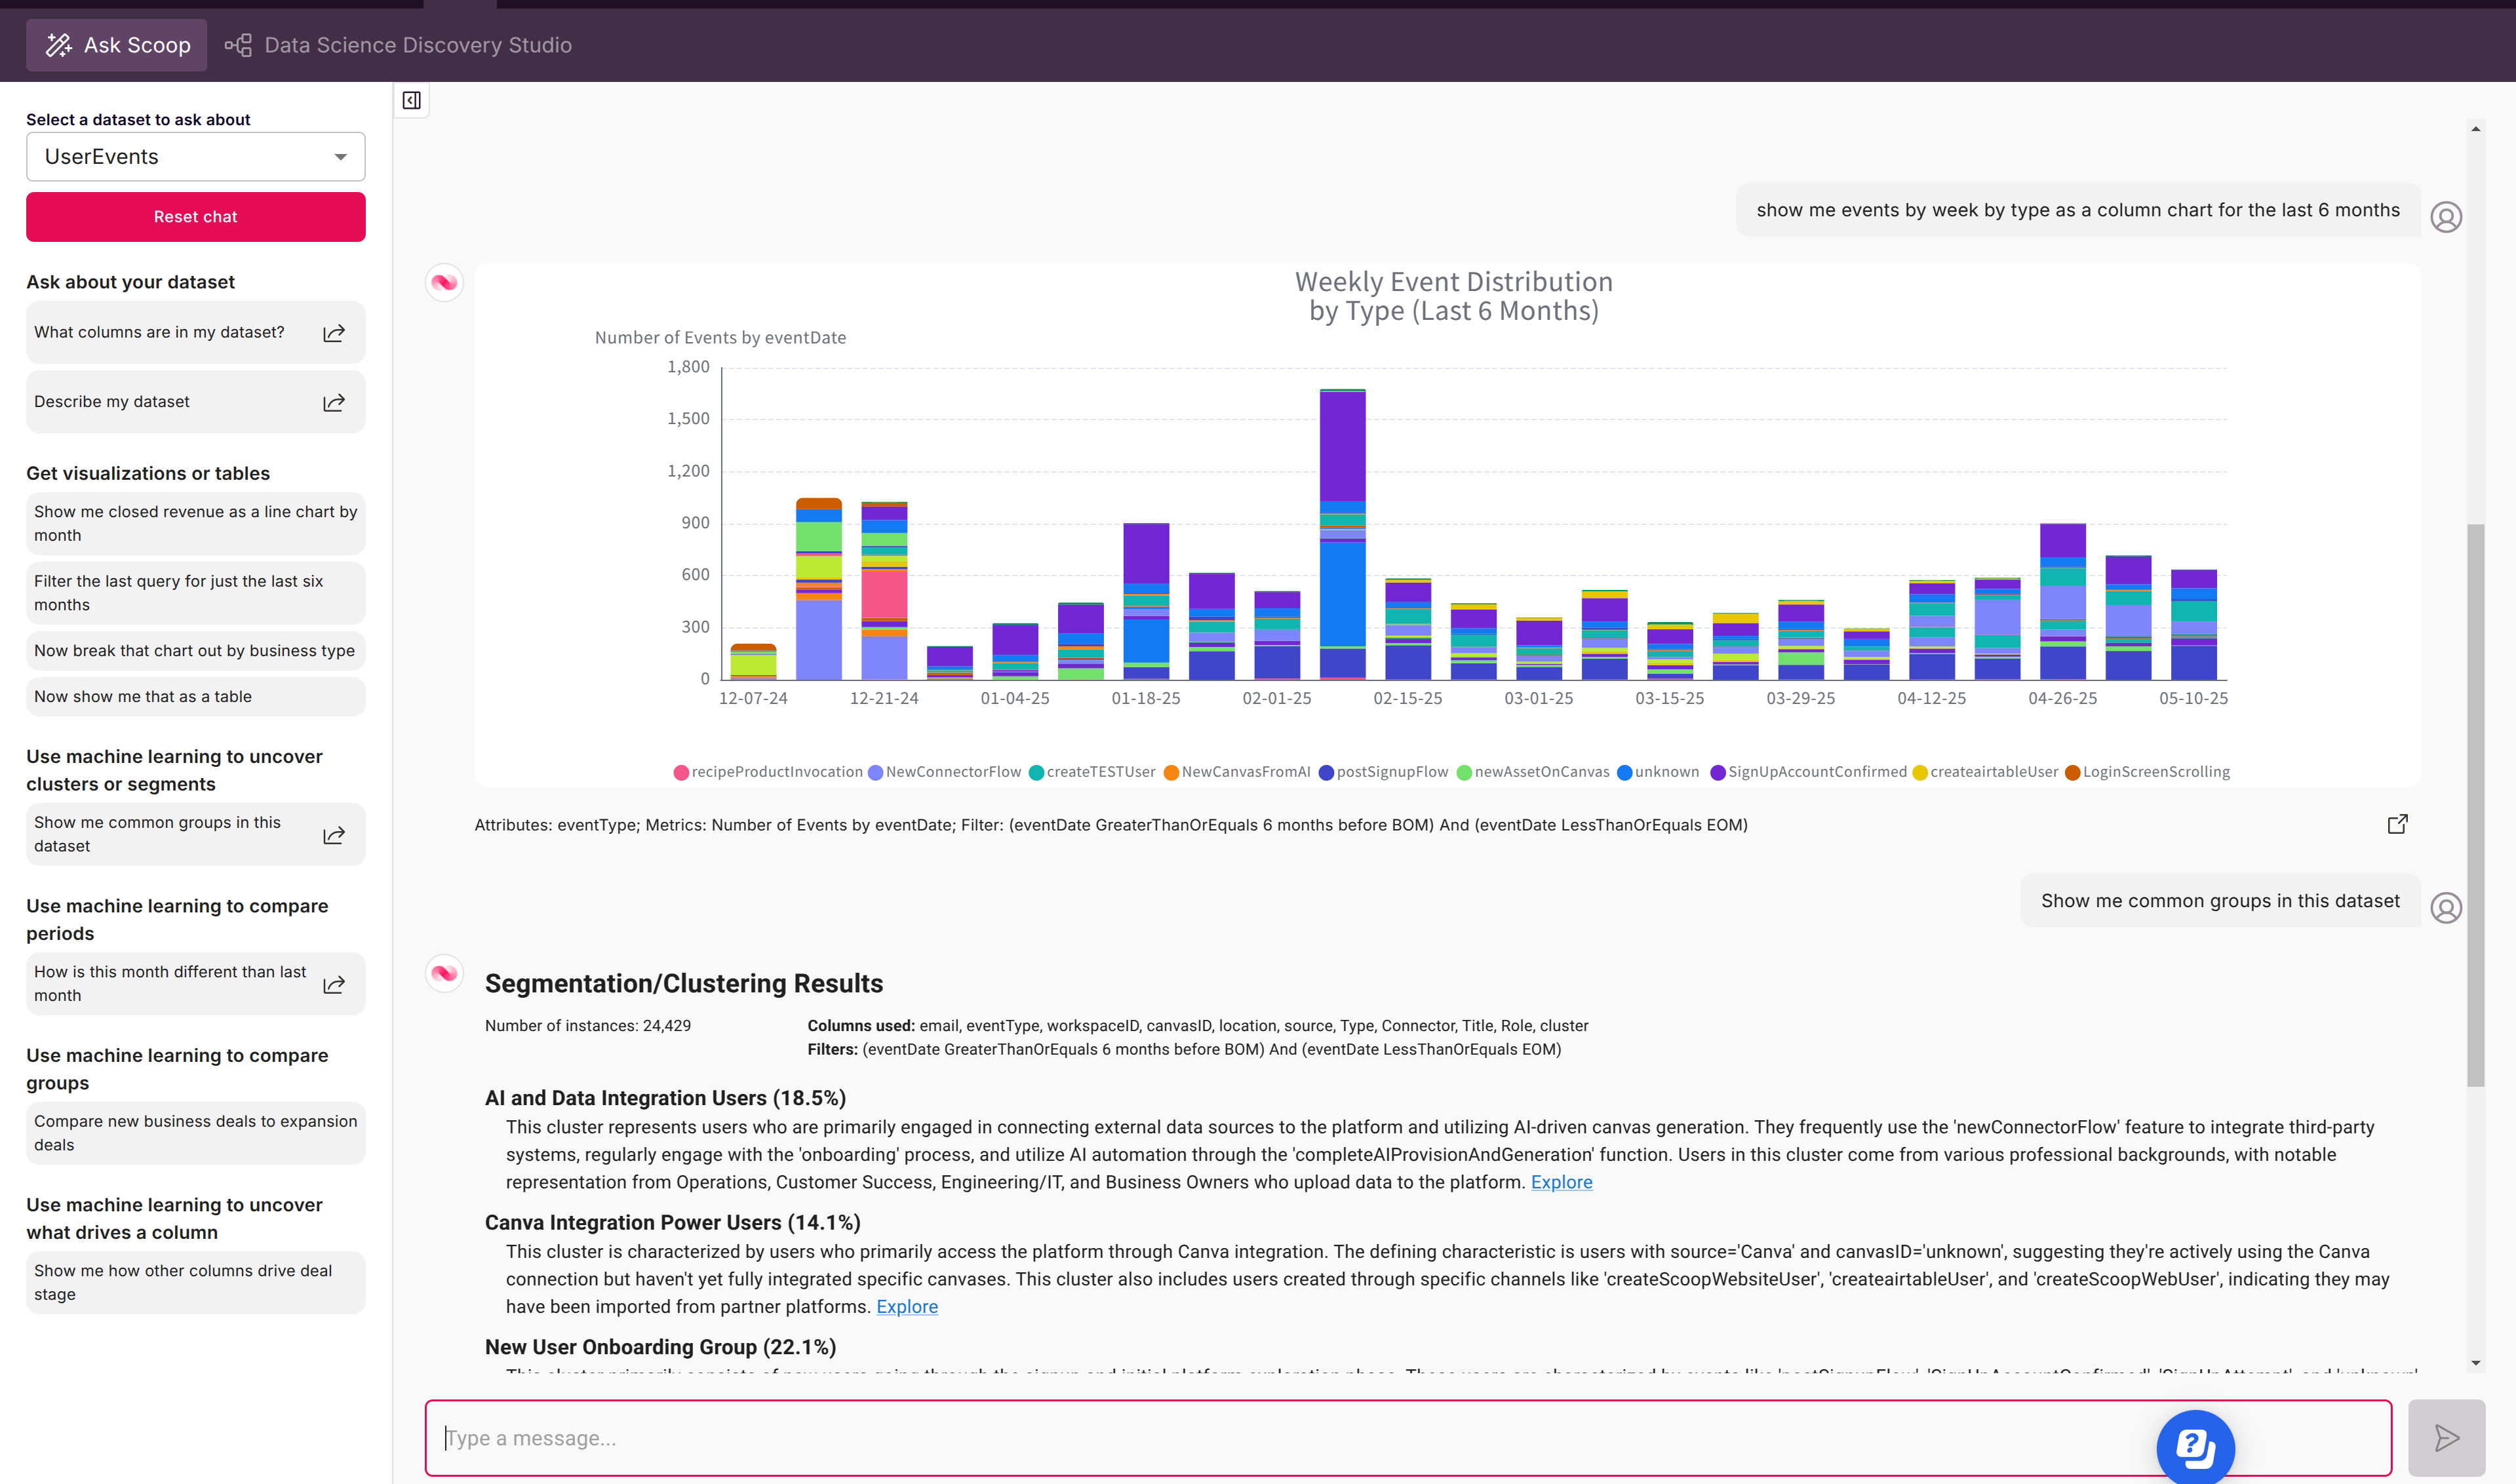
| "What are the main segments in our customer base?" | Performs ML clustering, describes groups in plain language |
| "Why did our close rate drop this quarter?" | Launches a root-cause analysis using rules-based AI |
| "Create a 6-slide summary of Q2 performance" | Auto-generates a full presentation with KPIs, visuals, and narrative |
Tip: Don’t worry about formatting your question perfectly. Ask follow-ups like “Show me just the top 5,” “Add channel as a breakdown,” or “Visualize as a pie chart.” Scoop tracks context as you chat.
Beyond Simple Charts: Advanced AI-Driven Insights
Scoop chat isn’t just for dashboards—it’s a full analytics assistant! Here’s what you can do with natural-language requests:
- Data Exploration: “List the top 10 deals this month.”
- Trends & Time Analysis: “Plot user signups weekly for the past year.”
- Segmentation: “Find customer segments with the highest churn risk.”
- Root Cause & Change Detection: “What’s different about this quarter’s lost deals, compared to last?”
- Machine Learning: “Predict who is likely to upgrade next month.”
- Storytelling & Presentations: “Generate a slide deck summarizing our sales pipeline.”
Making the Most of Chat
- Keep It Conversational: Just ask for what you want to know—Scoop handles ambiguity, finds the columns, applies filters, and suggests calculated fields if helpful.
- Iterate & Refine: If the first result isn’t perfect, refine your prompt: “Now show it by channel,” or “Exclude test accounts.”
- Leverage AI Wisdom: Scoop’s agentic AI suggests deeper analyses, surfaces unexpected patterns, or even points out anomalies you didn’t request.
- Export & Present: Turn any chat result into a live dashboard, save the visualization, or export the whole flow as a PowerPoint or Google Slides deck.
Tip: For really custom views, use the Properties and Style panels after generating a chat result—adjust colors, axes, chart types, or data ranges instantly.
Start Chatting—No Training Required!
Scoop is designed to help you unlock insights and communicate stories from your data—fast, visually, and without complexity. If you can describe the business question, you’re already ready to chat with your data in Scoop.
- Try asking about trends, comparisons, drivers, or KPIs.
- Let the AI assemble presentations for you, even if you’re not sure what to look for.
- Share, present, or revisit every answer and narrative with your team.
In Scoop, it’s never been easier to turn questions into insight. Start Chatting With Your Data—today!
Updated 6 months ago