Scoop Quick-Start Guide
[DEPRECATED - See "Meet Your AI Data Analyst" Instead]
This page contains outdated positioning. Please see:
Scoop is the world's first agentic analytics platform, designed from the ground up to empower business users, analysts, and teams to dig deep into their data—without needing a data team, coding skills, or any experience with infrastructure or BI tools. Imagine a powerful, AI-powered data engine seamlessly integrated with the familiarity and flexibility of spreadsheets, the interactive power of live dashboards, and the storytelling canvas of modern presentations—all in one platform, and all driven by groundbreaking agentic AI.
With Scoop, you don't just analyze data—you uncover truths, trends, and opportunities you didn't know existed. You do this faster, at greater scale, and with more confidence than you ever thought possible. And Scoop doesn't only help you analyze; it also helps you communicate, turning complex data into clear, professionally styled presentations in minutes.
Proven Results That Matter
Join companies already experiencing:
- 40% increase in marketing ROI through ML-powered targeting
- 25% reduction in customer churn with predictive alerts
- 87% of insights discovered that teams "never would have found manually"
- 10x faster analytics velocity vs. traditional BI tools
- 5 minutes to connect your data, 30 seconds to first insight
Experience the Magic of Scoop
🎯 Find Hidden Gold in Your Data
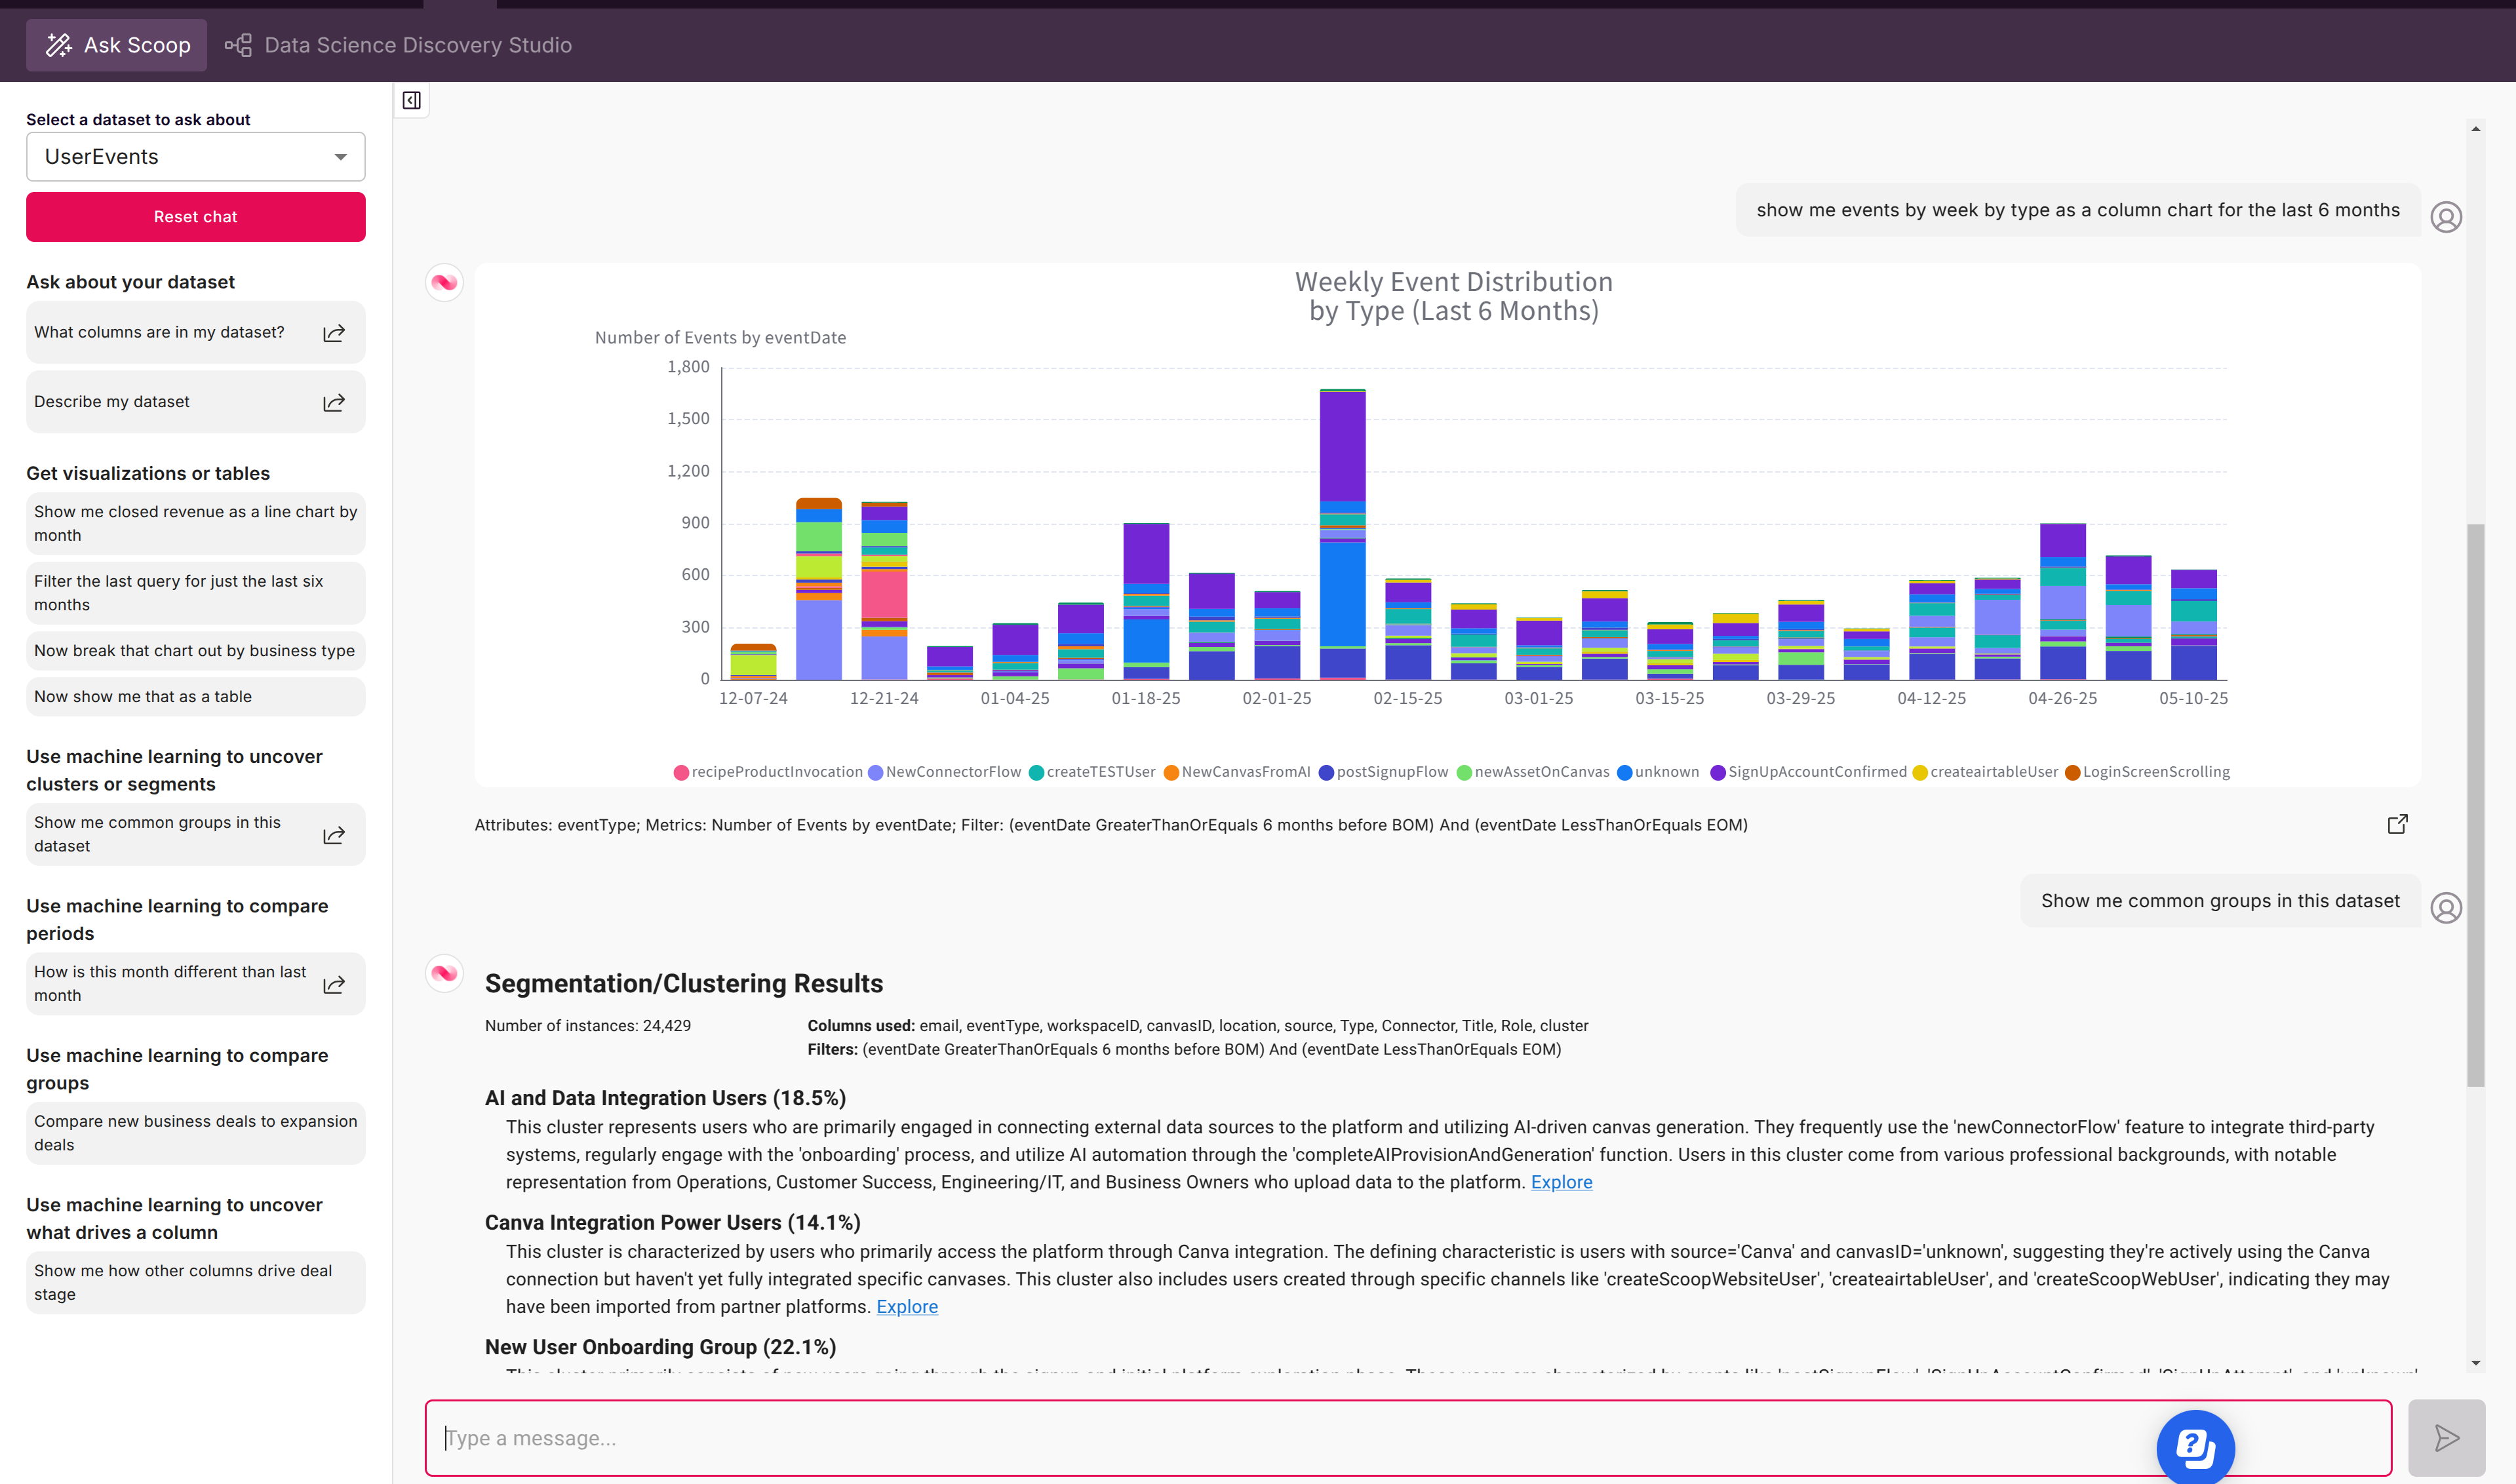
Upload your customer list and watch Scoop automatically discover 5-7 distinct segments you never knew existed—complete with business rules like "High-value customers are those with 3+ purchases, from urban areas, who engaged in Q4."
💬 Just Ask Your Data
Type "What's driving customer churn?" and get not just an answer, but interactive visualizations, statistical validation, and actionable recommendations—all explained in plain English.
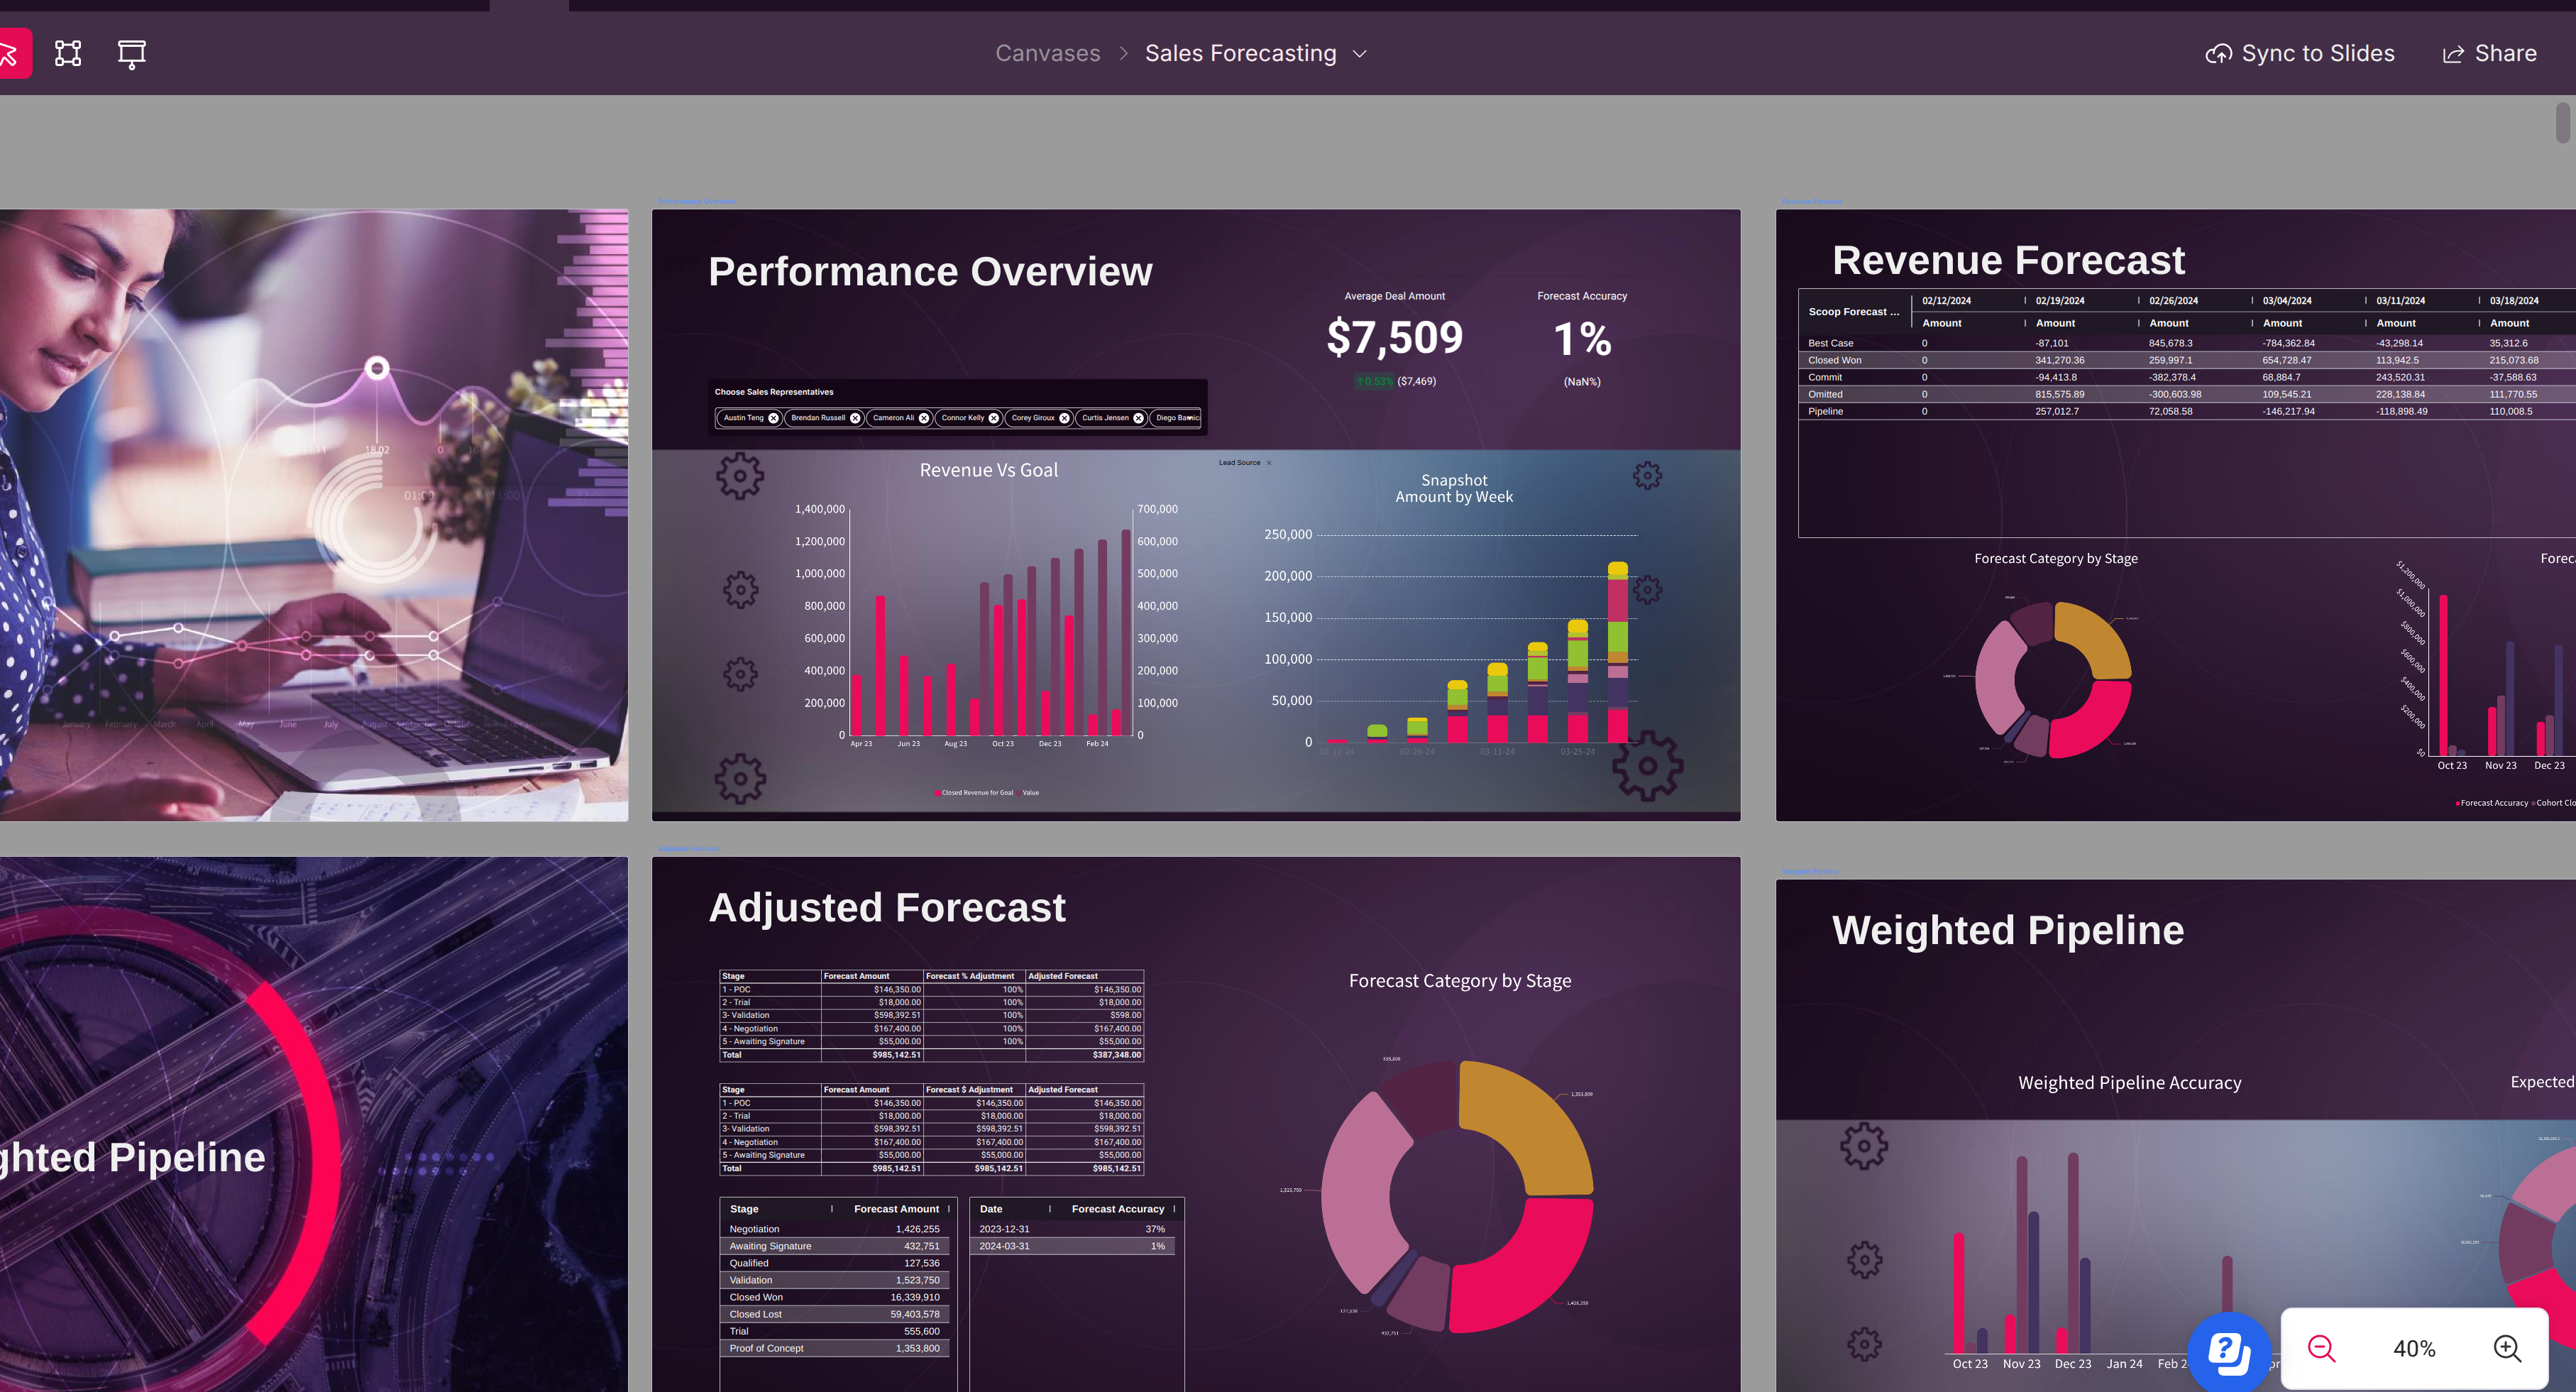
📊 From Data to Boardroom in Minutes
Import your existing PowerPoint template, and Scoop automatically matches your brand colors and creates live, data-driven slides that update with your latest numbers.
🔮 Predict the Future
Deploy ML models with one click: predict which deals will close, which customers might churn, or which leads to prioritize—then push these scores directly back to your CRM.
Why Scoop Exists
The Modern Analytics Dilemma
Business leaders today face a paradox: data is more plentiful and valuable than ever, yet extracting meaning from it is often slow, fragmented, and dependent on experts.
- Traditional BI tools are powerful but often demand time-consuming configuration, database knowledge, and technical skills, leaving business users waiting on data teams for reports, visualizations, or analyses.
- Spreadsheets are everywhere—familiar, flexible, but limited in scale, lacking robust data lineage, security, automation, and the ability to process large or changing datasets at speed.
- No-code/low-code visual tools promise ease, but hit brick walls when complexity, automation, or true data intelligence are required.
- AI "co-pilots" in other tools can suggest a chart—but cannot architect data pipelines, automate business datasets, uncover hidden patterns, or tell the "why."
Scoop was created to break these boundaries. It fuses the expressiveness and interactivity of spreadsheets with a robust data science engine, automates every stage from source to insight, and—crucially—makes advanced analytics and AI accessible to every business user.
What Makes Scoop Different: Real AI, Real Results
🤖 Beyond "AI Co-pilots"—Meet Your AI Data Science Team
While others help you make charts, Scoop's AI actually does data science:
- Runs clustering algorithms to find natural customer segments
- Builds decision trees to explain what drives outcomes
- Compares time periods to spot emerging trends
- Identifies predictors of churn, conversion, or success
- All explained in plain English with no "black box" mystery
📈 Spreadsheets on Steroids
Process millions of rows with formulas you already know:
- Use VLOOKUP, SUMIF, and pivot tables at massive scale
- Create calculated fields with familiar Excel syntax
- Blend multiple data sources without SQL
- All with automatic refresh and version control
🎭 From Analysis to Presentation in One Click
Stop copying charts into slides:
- Import existing PowerPoint decks
- AI matches your brand colors and styling
- Live data overlays on your slides
- Export to PowerPoint, Google Slides, or present live
- Updates automatically when data changes
💬 Analytics Where You Work—Including Slack
Bring Scoop to your team:
- @mention Scoop in any Slack channel
- Upload CSV/Excel files directly in chat
- Get private results you can refine before sharing
- Full ML capabilities right in Slack
- Every user gets their own analytics workspace
🔄 Automated Snapshots and Process Analysis
Traditional BI captures "now"—Scoop tracks change:
- Ingest daily or periodic snapshots automatically
- Reveal how your data evolves over time
- Drill into process flows and conversion rates
- Find bottlenecks and root causes with a click
- No technical setup required
🔬 Data Science for Everyone
Enterprise-grade ML made simple:
- Predictive modeling and clustering
- Root-cause comparison and anomaly detection
- Time-trended analysis
- Ask "What's different this month?" and get actionable insights
- All explained in business terms, not statistics
⚡ From Data Source to Executive Insight—All-in-One
Complete analytics pipeline:
- Connect to 100+ SaaS, cloud, and API sources
- Upload files instantly
- Ingest, clean, transform, analyze, visualize, narrate, and publish
- No roundtrips between apps
- No waiting for engineering
🏢 No-Code, Self-Service, Yet Enterprise-Grade
Business user friendly with IT peace of mind:
- Build, transform, automate, and share without code
- Every change is versioned and auditable
- Secure collaboration with workspace isolation
- RBAC, SSO, and compliance built-in
- Reusable and repeatable logic
Feature Comparison: Scoop vs. The Rest
| Capability | Scoop | Traditional BI | Notebook-based DS | LLM Chatbot |
|---|---|---|---|---|
| No-code ingestion & spreadsheet-style prep | ✔ | Limited | ✖ | Limited |
| Multi-dimensional pattern discovery | ✔ (Automatic ML) | ✖ | ✖ | ✖ |
| Built-in column-store & snapshot engine | ✔ | Add-on | ✖ | ✖ |
| Agentic-AI that plans but DB/BI/ML executes | ✔ (no hallucinated math) | N/A | N/A | Hallucinations and trivial summaries |
| One-click interpretable ML / Data Science | ✔ | ✖ | Requires coding | ✖ |
| Direct CRM integration & ML scoring | ✔ | Limited | ✖ | ✖ |
| Works in Slack | ✔ | ✖ | ✖ | ✖ |
| Branded deck & executive / customer-ready output | ✔ | Limited | ✖ | ✖ |
| Conversational front-end spanning BI + ML | ✔ | BI only | DS only | Narrow |
See Scoop in Action: From Question to Insight to Action
Step 1: Ask Your Question
Simply type what you want to know: "Which customer segments have the highest lifetime value?"
Step 2: AI Discovers Hidden Patterns
Scoop automatically:
- Analyzes your data across multiple dimensions
- Finds 5-7 distinct segments with clear characteristics
- Generates business rules you can understand
- Shows you patterns impossible to spot manually
Step 3: Take Action
With one click:
- Push segment scores back to your CRM
- Export findings as a polished presentation
- Share insights with your team in Slack
- Set up automated monitoring
Why Business Analysts, Data Analysts, and Business Users Love Scoop
- Business People: Finally get answers without waiting days or weeks for IT. Explore, question, and adapt analysis rapidly—as easily as manipulating a spreadsheet, but with enterprise muscle.
- Business & Data Analysts: Automate the grunt work—let AI build the foundation, freeing you to focus on deeper strategy or innovation. Sharpen presentations, answer ad-hoc questions, and pivot quickly.
- Traditional BI Users: Keep the dashboards you love—but finally break through limitations. Scoop helps where BI tools stall: process change analysis, AI-driven exploration, automated presentations, rapid blending and reshaping.
- Spreadsheet Power Users: Instantly level up. Analyze data at scale, automate refreshes, augment with calculation and ML, and push results seamlessly to presentations and sheets—all with the logic you're already a master of.
- Collaborative Teams: Organize work logically with workspaces, share outcomes instantly, and control who sees what.
Data Leaders Love Scoop
"We discovered customer segments that increased our campaign ROI by 40%. These patterns were impossible to find with traditional analysis—Scoop revealed them in minutes."
— VP of Marketing, SaaS Company
"Scoop replaced our entire BI stack. Business users now get answers faster than our data team ever could."
— Director of Analytics, E-commerce Leader
"The ability to go from raw data to boardroom-ready presentation in under an hour has transformed how we make decisions."
— Chief Revenue Officer, Tech Startup
Scoop Is For You If...
- You have business data—files, reports, SaaS apps, or databases—and want immediate insights, not weeks or months of setup.
- You want to leverage the power of spreadsheets, but are hitting scale or automation limits.
- You need to tell a compelling story with your data, not just create another dashboard.
- You want to explore data, unearth patterns, trends, or causes without writing code or waiting for IT.
- You need true data science and machine learning—clustering, prediction, "what changed and why," process analytics, and more—all without the need for technical expertise.
- You demand flexibility: from ad-hoc exploration and live worksheets, to slide-ready presentations, multi-source data blending, and secure sharing.
If you're tired of partial solutions—and want to bridge the gap between your business questions and actionable data insights—Scoop is purpose-built for you.
Start Your Data Revolution Today
🚀 Zero Risk, Instant Value
- No credit card required—start with our guided sample workspace
- Upload any file—see insights from your own data in 30 seconds
- Connect your apps—Salesforce, HubSpot, Google Sheets, and 100+ more
- Try it in Slack—add @Scoop to your workspace with one click
What Happens When You Sign Up:
- Instant access to a pre-loaded workspace with real data
- AI-guided tour showing pattern discovery on sample datasets
- Upload your data and watch Scoop find insights you've been missing
- Export your first presentation within minutes
[Start Free - No Credit Card Required]
Join innovative companies already saving weeks of analysis time and discovering game-changing insights they never knew existed.
The Scoop Difference: Why Settle for Less?
With Scoop, you're not just digitizing what you already do—you're elevating it. From agentic AI that drives the entire analytics pipeline, to process analysis, live presentations, spreadsheet enrichment, and secure collaboration, Scoop is analytics for how business really works—fast, flexible, approachable, and powerful.
Ditch the waiting, unleash the insight. Try Scoop now and experience what true business-driven data science feels like.
Updated 29 days ago