Unlocking the Power of AI in Scoop Analytics
Scoop Analytics is more than just a business intelligence platform—it’s your AI-powered partner in transforming raw data into actionable insights, compelling stories, and real business value. Whether you’re a business user, analyst, or a data-savvy team lead, the AI and agentic capabilities in Scoop are designed to make sophisticated analytics, machine learning, and presentation creation accessible and intuitive—no SQL, Python, or IT tickets required.
What Makes Scoop’s AI Unique?
Scoop’s AI eliminates traditional barriers by combining:
- Automated Data Understanding: Instantly scans uploaded data to determine structure, data types, and relationships. Scoop’s AI "reads" your dataset, understands embedded totals, date fields, and even summarizes what each column means—saving you hours of tedious setup.
- Agentic AI Workflow: Instead of simple chatbots that summarize data, Scoop’s agentic AI goes a step further. You can ask business questions in natural language; AI creates complex queries, discovers patterns, builds visualizations, or even proposes machine learning models to answer your question.
- End-to-End Data Science Studio: Scoop’s Data Science Studio brings serious ML tools (like clustering, segmentation, prediction, and population comparisons) into a business-friendly, no-code environment. Let AI surface drivers, anomalies, and opportunities—explained in plain English.
- Best-in-Class Narratives & Slides: AI not only finds insights, but crafts narratives and automates the creation of branded, presentation-ready slides that look great and communicate clearly.
How Does the AI Workflow Actually Work?
Here’s what typically happens behind the scenes in Scoop:
-
Connect or Upload Data
- Scoop’s AI instantly analyzes the file or API source—infers data types, date columns, and important fields. It identifies attributes (categories), metrics (numbers), and possible relationships.
-
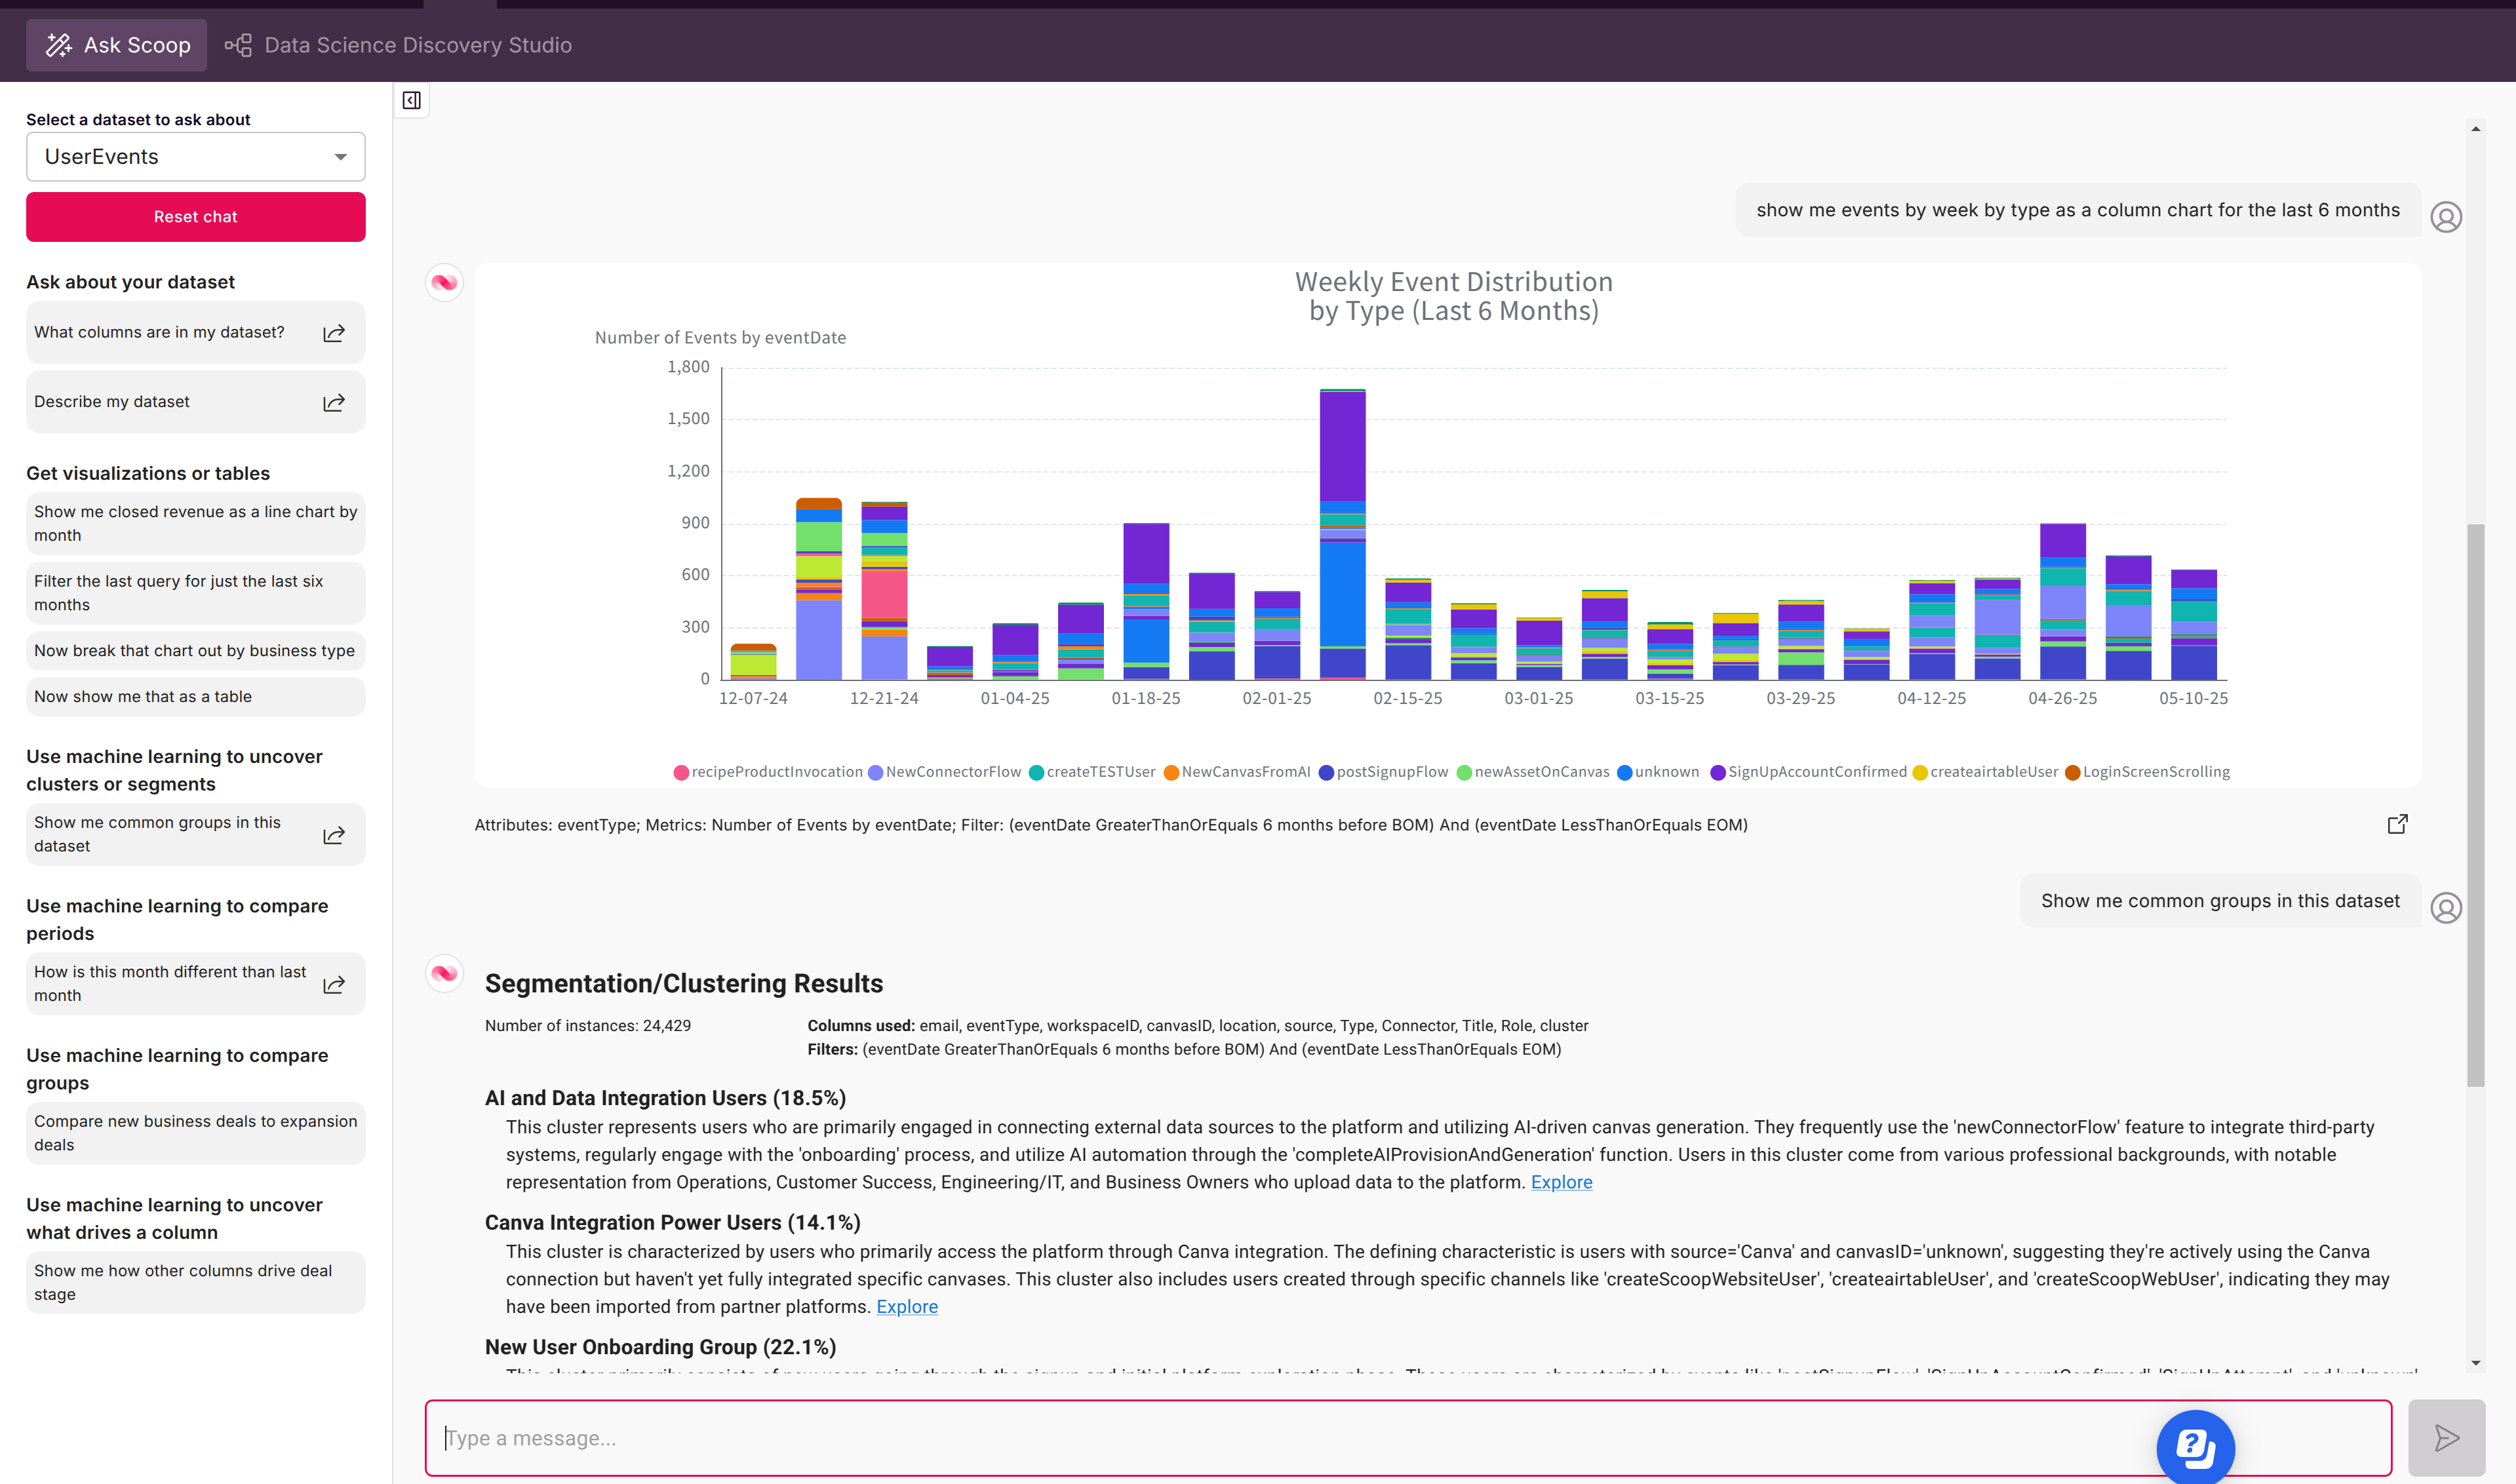
Ask a Question or Start Chatting
- Use Scoop’s chat interface to type plain-English requests. Examples:
- "Show monthly sales and average deal size by region."
- "Segment my marketing leads to find different behavioral clusters."
- "What changed last quarter compared to the one before?"
- Use Scoop’s chat interface to type plain-English requests. Examples:
-
Agentic AI Builds the Analysis
- Scoop’s agentic workflow takes over:
- Translates your request into structured queries.
- Suggests or creates calculated fields.
- Chooses optimal visualizations (charts, tables, KPIs).
- Or, proposes advanced analyses (clustering, prediction, population comparisons) using built-in ML algorithms.
- Scoop’s agentic workflow takes over:
-
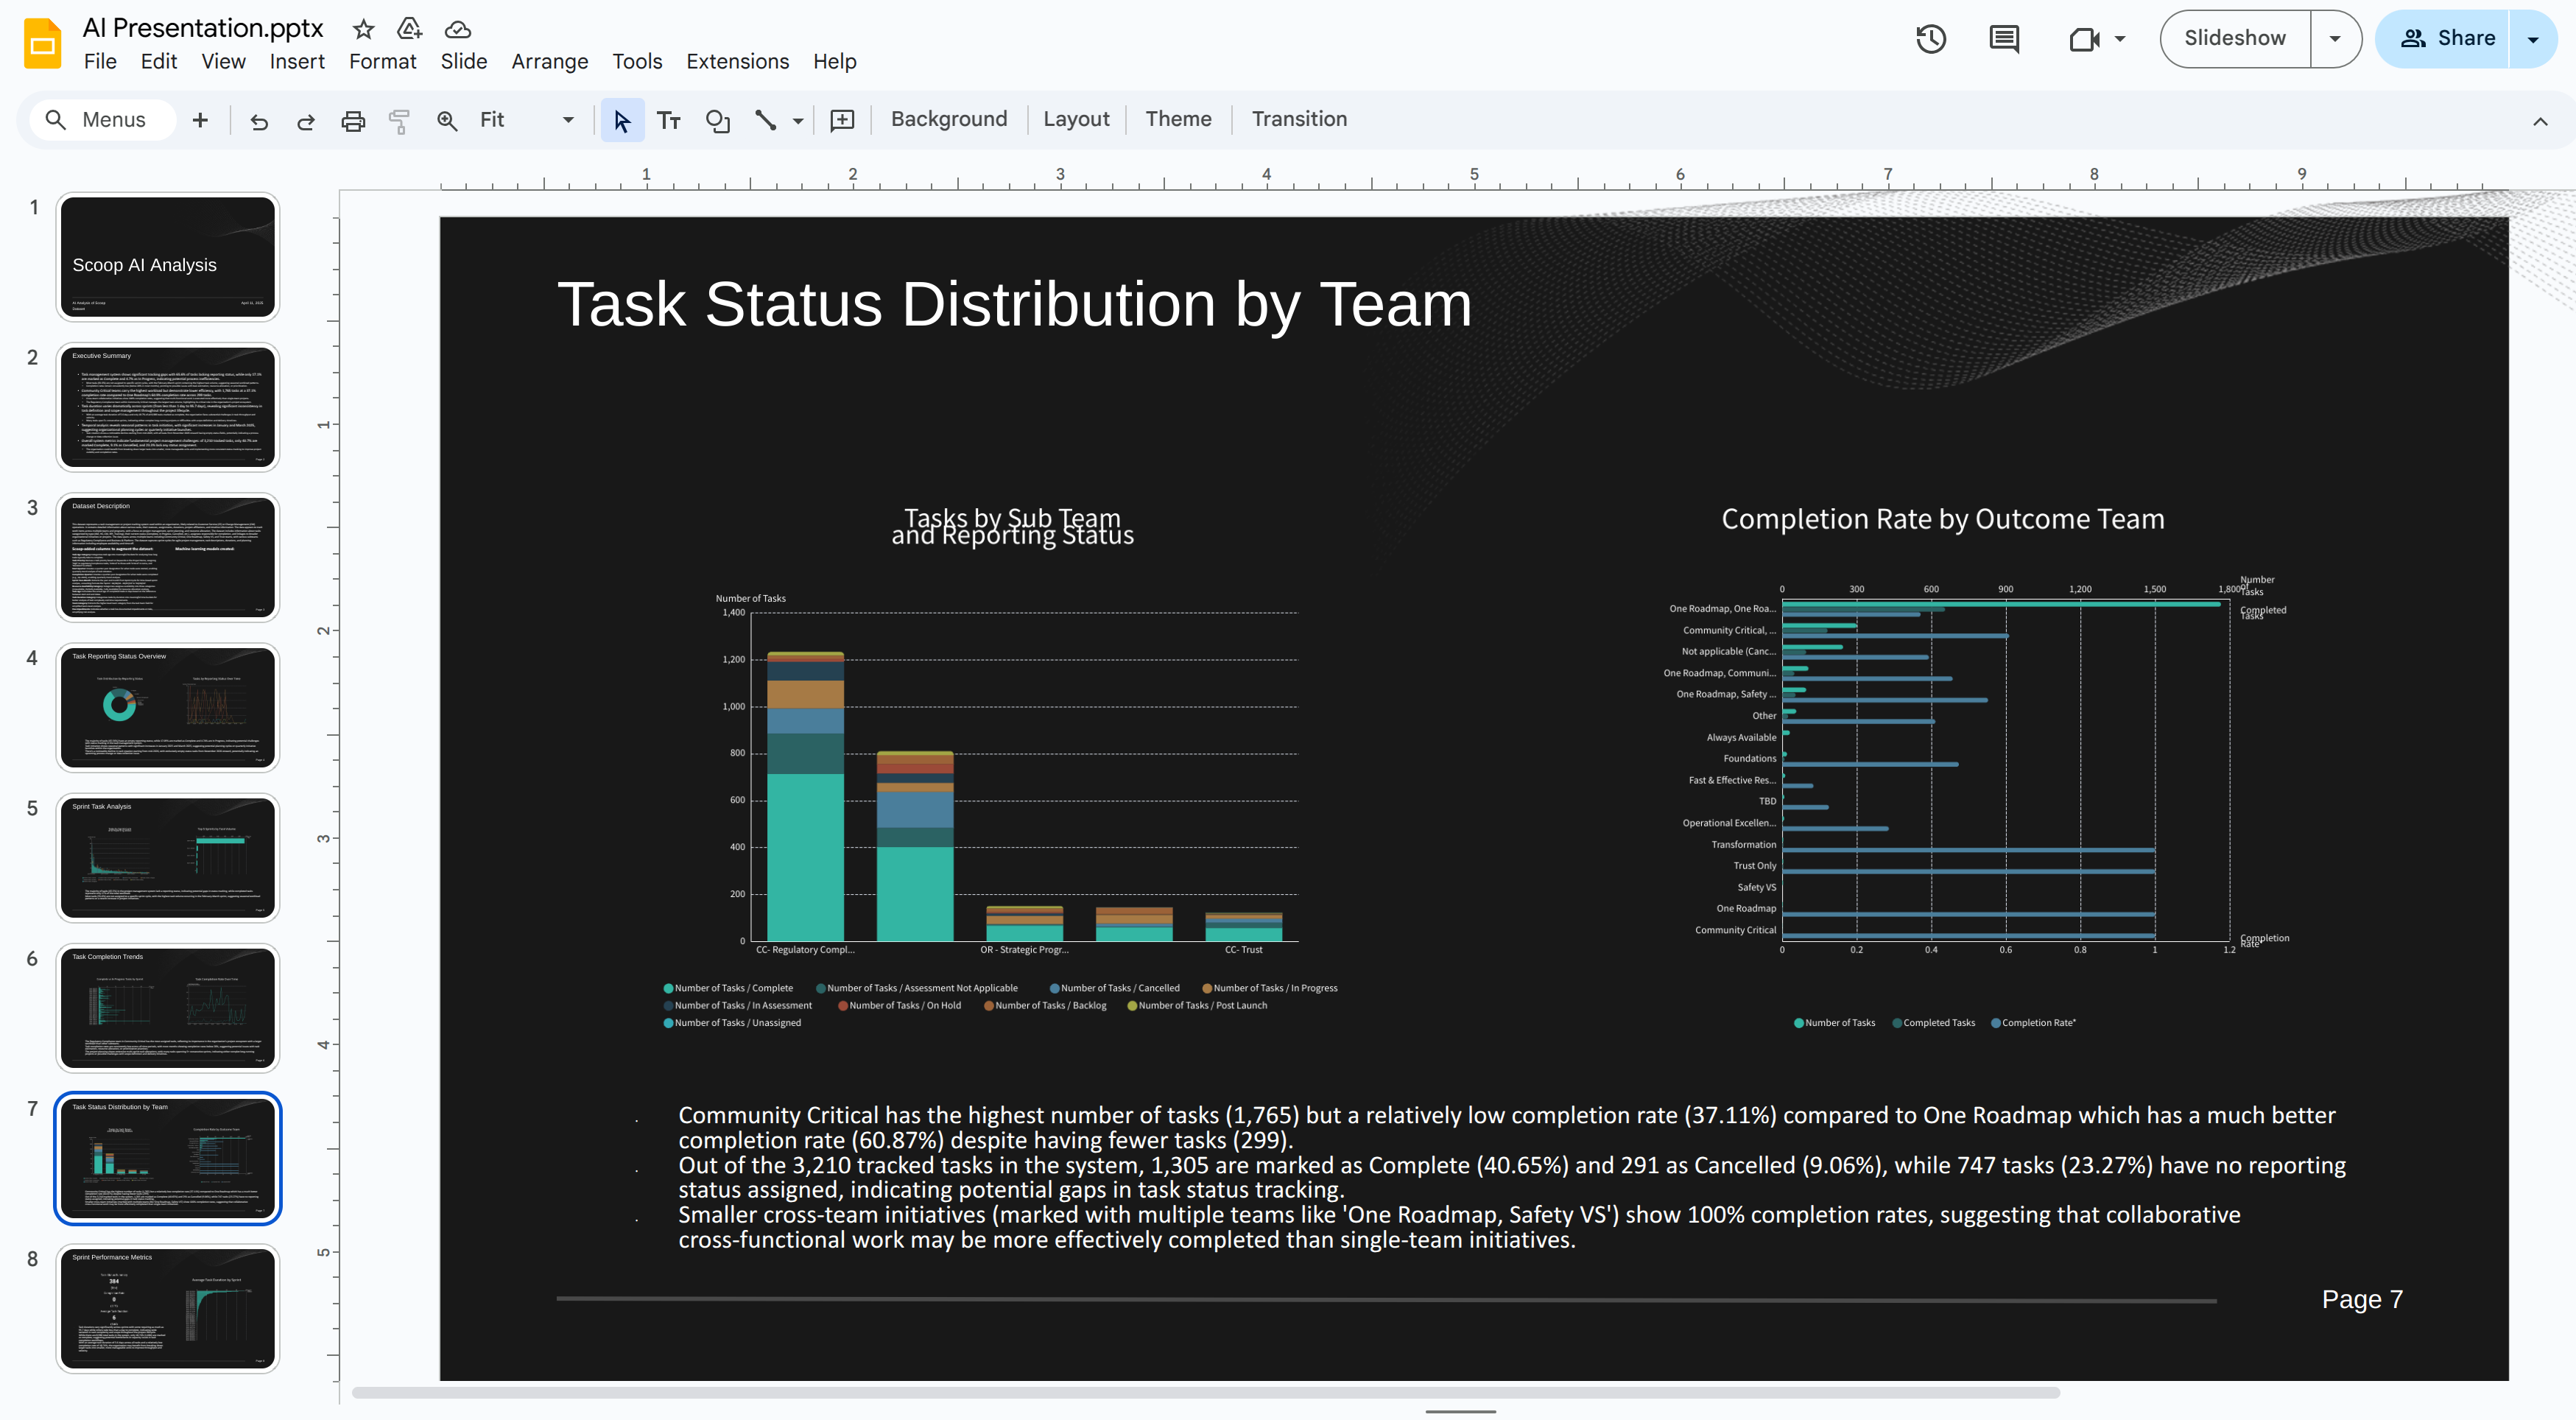
AI-Powered Presentation Creation
- With one click, AI can assemble a full slide deck or a single slide, pulling in generated charts, tables, and narrative summaries. If you upload your company’s PowerPoint, Scoop will even infer and apply your brand’s color scheme!
- Visuals and narratives are neatly organized to tell a data story—from overview to drivers, trends, and recommendations.
-
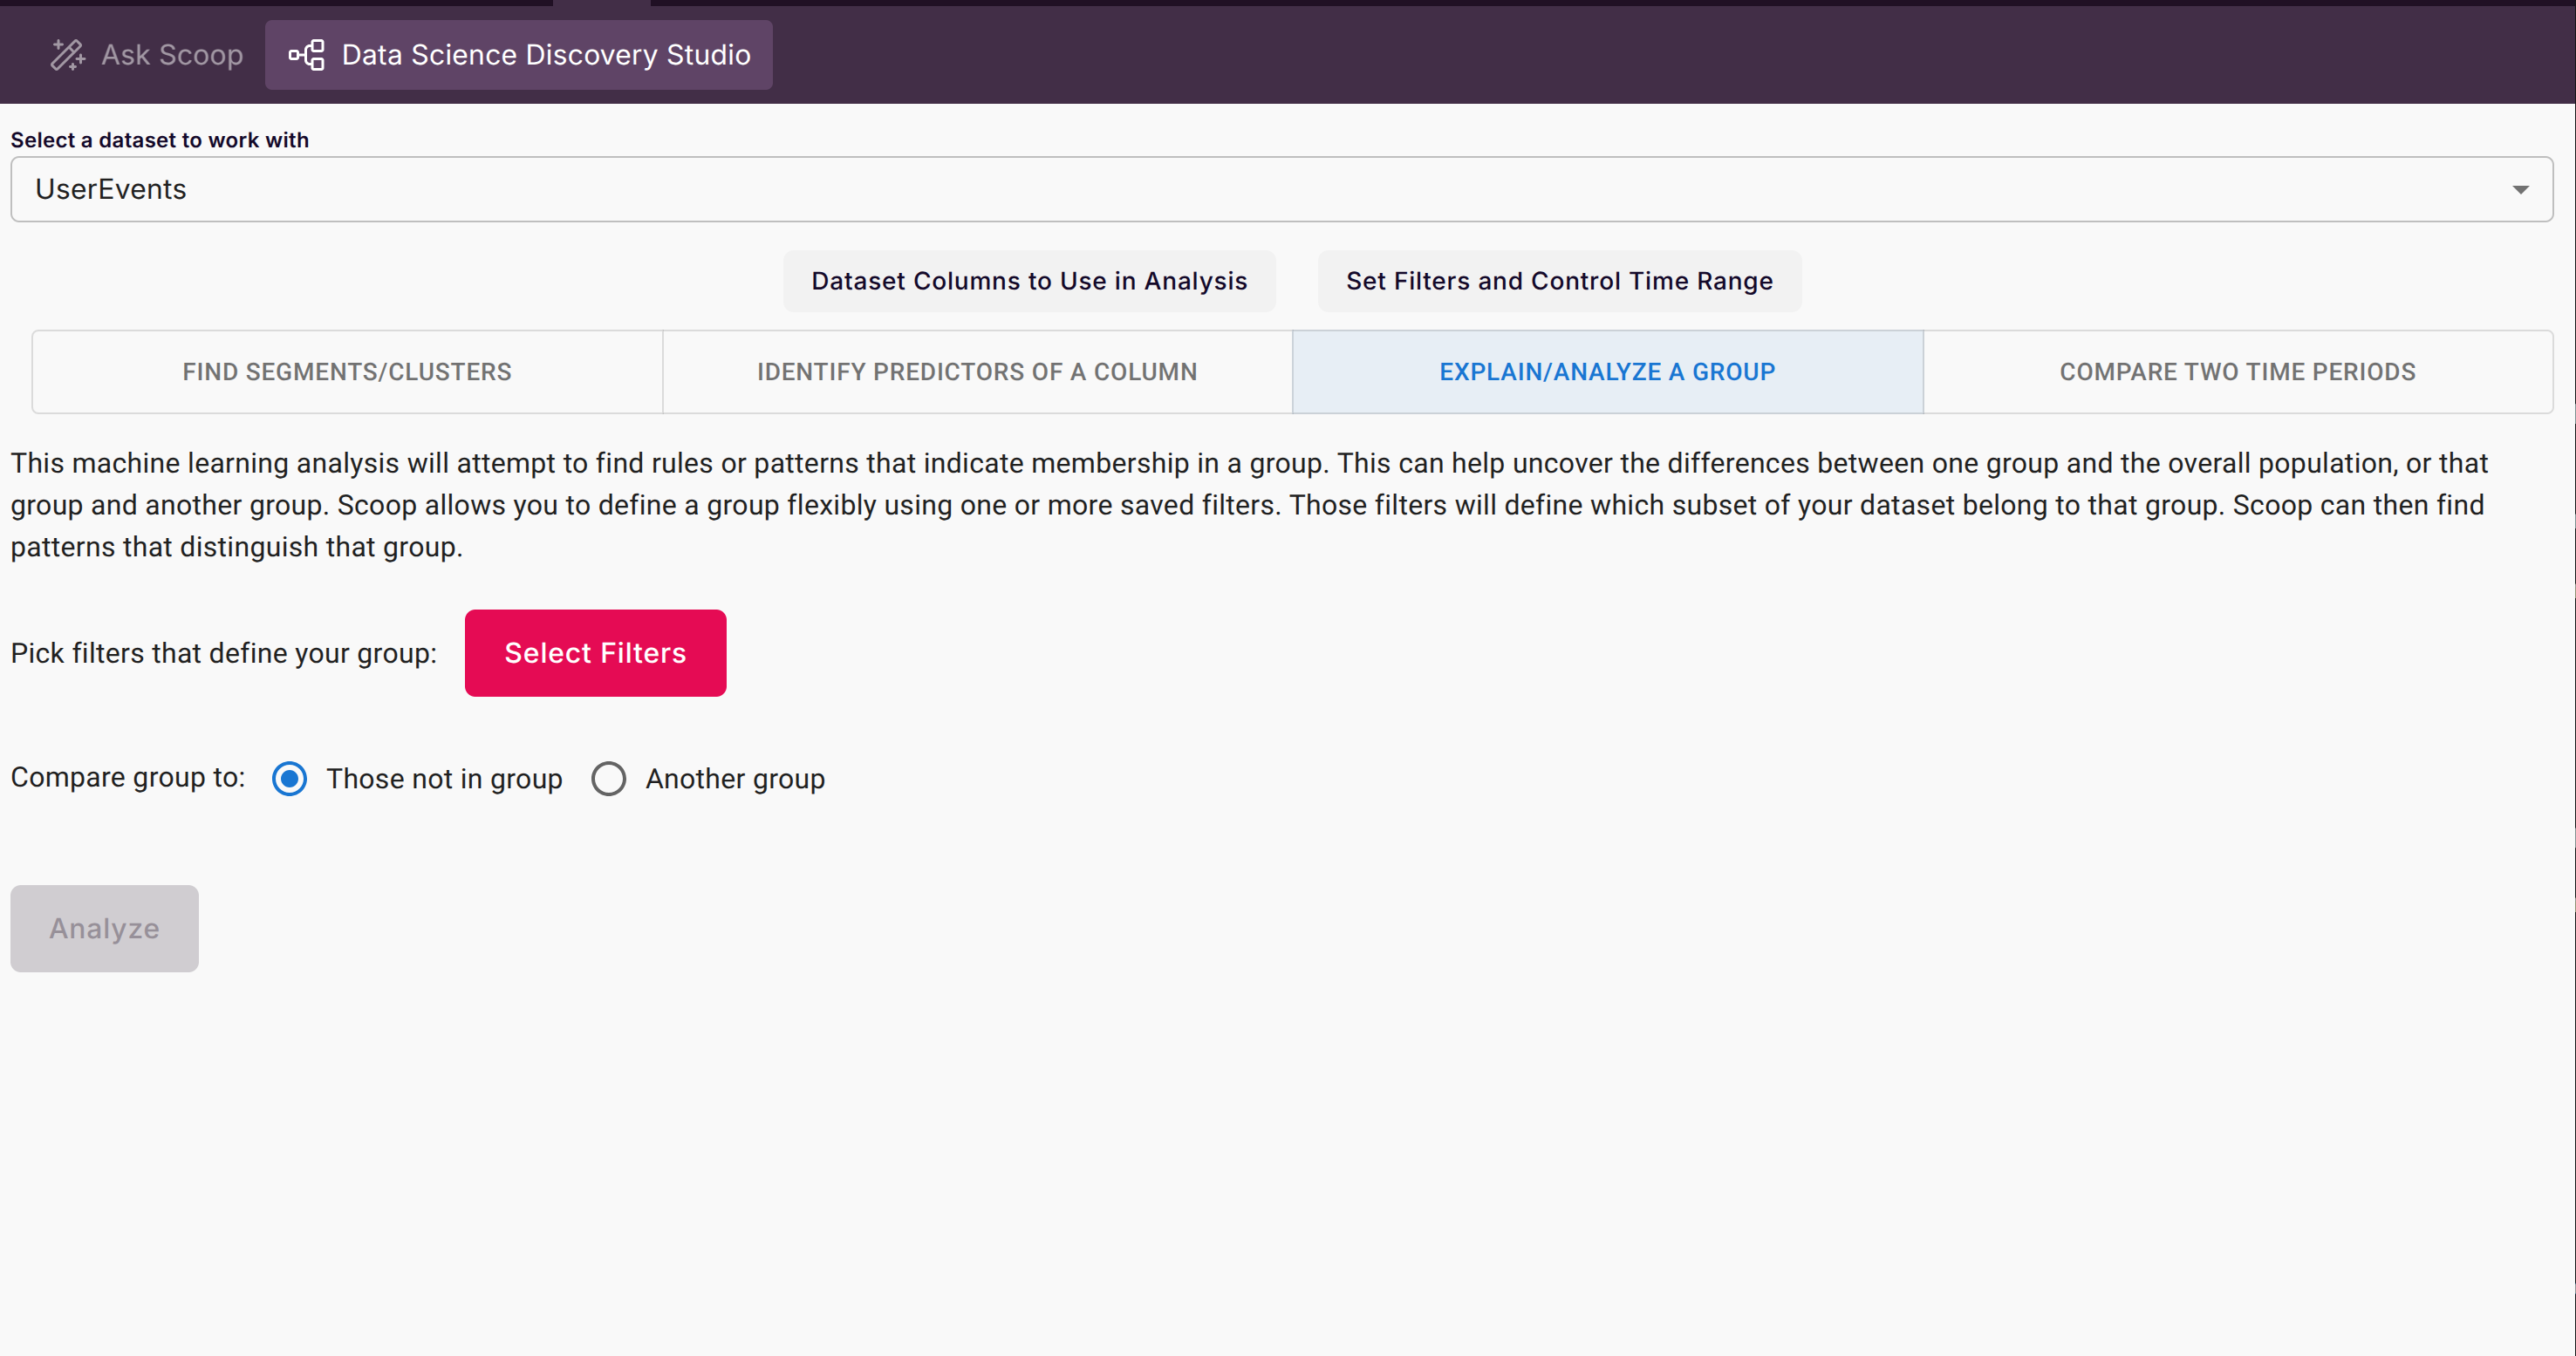
Dig Deeper with Data Science Studio
- Use a friendly interface to:
- Segment customers (automatic clustering with rules-based explanations)
- Compare time periods (see what changed, AI-generated summaries)
- Predict outcomes (identify what’s driving a metric, auto-build ML models)
- For every ML analysis, Scoop presents easy-to-understand explanations—so even non-data scientists can interpret the results.
Tip: Even advanced machine learning outputs—like clustering, decision rules, and predictive drivers—are summarized by AI in plain English, so you can include them in presentations without jargon.
- Use a friendly interface to:
Creating Data Narratives at Lightning Speed
Unlike traditional BI, Scoop’s AI does the heavy lifting:
- Suggests which comparisons and visualizations are most interesting based on data distribution.
- Writes succinct, human-readable takeaways for every dataset or chart in your presentation.
- Snapshots daily API data, tracks changes over time, and can analyze status transitions (ex: sales funnel movements, support ticket progressions) without extra configuration.
- Tracks every operation and provides complete auditability and repeatability.
Example End-to-End Flow
- Upload a pipeline of sales opportunities
- Ask: "Show me how opportunity conversion rates and average deal sizes trended by month this year."
- Scoop:
- Analyzes your data
- Creates a time-series column chart with smart calculated fields
- Generates executive-level summary points:
- "Conversion rates rose steadily after Q2, driven by increased lead qualification."
- "Larger deal sizes were concentrated in the North-East region."
- Click "Create Presentation"—Scoop formats branded slides, with AI-generated narratives on each chart, ready for sharing.
Why Scoop AI is a Game-Changer
- No code, no SQL, no ML background needed
- Ask questions, not queries—let the AI handle technicalities
- Complete transparency—all formulas, queries, and insights are visible and auditable
- Output is business-ready—from chart to full PowerPoint, always on-brand and insight-rich
Tip: Stuck for ideas? Type “What insights can you generate for this data?”—Scoop will surface patterns you didn’t know existed.
Get Started
- Import or connect your data
- Ask Scoop a business question, or try the Data Science Studio
- Let AI build your analysis, visualizations, and presentation
- Share, export, or collaborate—it’s that simple!
With Scoop Analytics, AI isn’t just a buzzword—it’s your always-on, agentic partner from data to decision.
Updated 6 months ago