Automated Dataset Analysis
In the modern world of analytics, moving from raw data to powerful insights is a constant challenge—especially for business users who don’t want to code or wrangle spreadsheets for days. Scoop Analytics reimagines this process through fully automated dataset analysis and presentation generation, blending AI, machine learning, and next-level business intelligence into a seamless user experience that is uniquely accessible and incredibly sophisticated.
What Is Automated Dataset Analysis in Scoop?
Automated Dataset Analysis in Scoop is an end-to-end workflow where the system ingests your data (from files or connected apps), performs deep and automatic AI-based analysis, extracts key insights, and then generates executive-ready presentations—all with minimal effort on your part. The magic lies in how Scoop automates not just the number-crunching, but the entire reasoning process: understanding, interpreting, and storytelling based on your data. No traditional BI tool or data science notebook does this so comprehensively or transparently for business users.
The Advanced Anatomy of Scoop’s Automated Analysis
Let’s break down the key components and their powerful interactions:
1. Smart Data Ingestion and Parsing
- Upload files or connect more than 100 SaaS services—Scoop automatically detects file structure, delimiters, data types, embedded totals/subtotals, and even subtler data quirks.
- Data is quickly cleaned and normalized, with semantics identified (e.g., which columns are dates, which are categories, which have hidden business meaning).
- Scoop’s AI examines the distribution of values for every column and runs summary statistics (top values, min, max, standard deviation, skew, kurtosis) right out of the gate.
2. Semantic Modeling and Automated Data Preparation
- Once loaded, Scoop runs AI-driven routines to "understand" what each column means and how columns relate, annotating the dataset with rich descriptions.
- Intelligent formula creation: Scoop automatically suggests (and can generate) calculated fields—like bucketing ages, creating derived ratios, or extracting categories—using Excel-like formulas. This makes your data more useful without manual spreadsheet work.
- All transformations are tracked, making the process transparent and repeatable.
3. Automated Insight Discovery (AI & ML Under the Hood)
- Segment and cluster: Scoop runs ML (Expectation Maximization clustering and interpretable rules models) to automatically spot natural groupings in your data (e.g., customer segments, opportunity cohorts)—then explains these in clear English, not tech jargon.
- Comparisons and drivers: You can compare groups (e.g., this quarter vs. last, or lost vs. won deals) and Scoop’s ML engine identifies exactly what differentiates these periods or segments—including running classification models to single out driving features.
- Prediction modeling: Scoop automatically builds predictive models to see which factors best explain (or predict) a target metric—then summarizes the top drivers and rules.
Tip: Scoop’s machine learning workflows use advanced machine learning/data science algorithms under the hood, but always summarize the results for clarity—no data science degree required.
4. Automated Visualization and Presentation Generation
- Results are visualized using best-practice chart types (column, bar, line, pie, KPI, table, etc.), selected intelligently by Scoop’s AI based on the nature and density of your data.
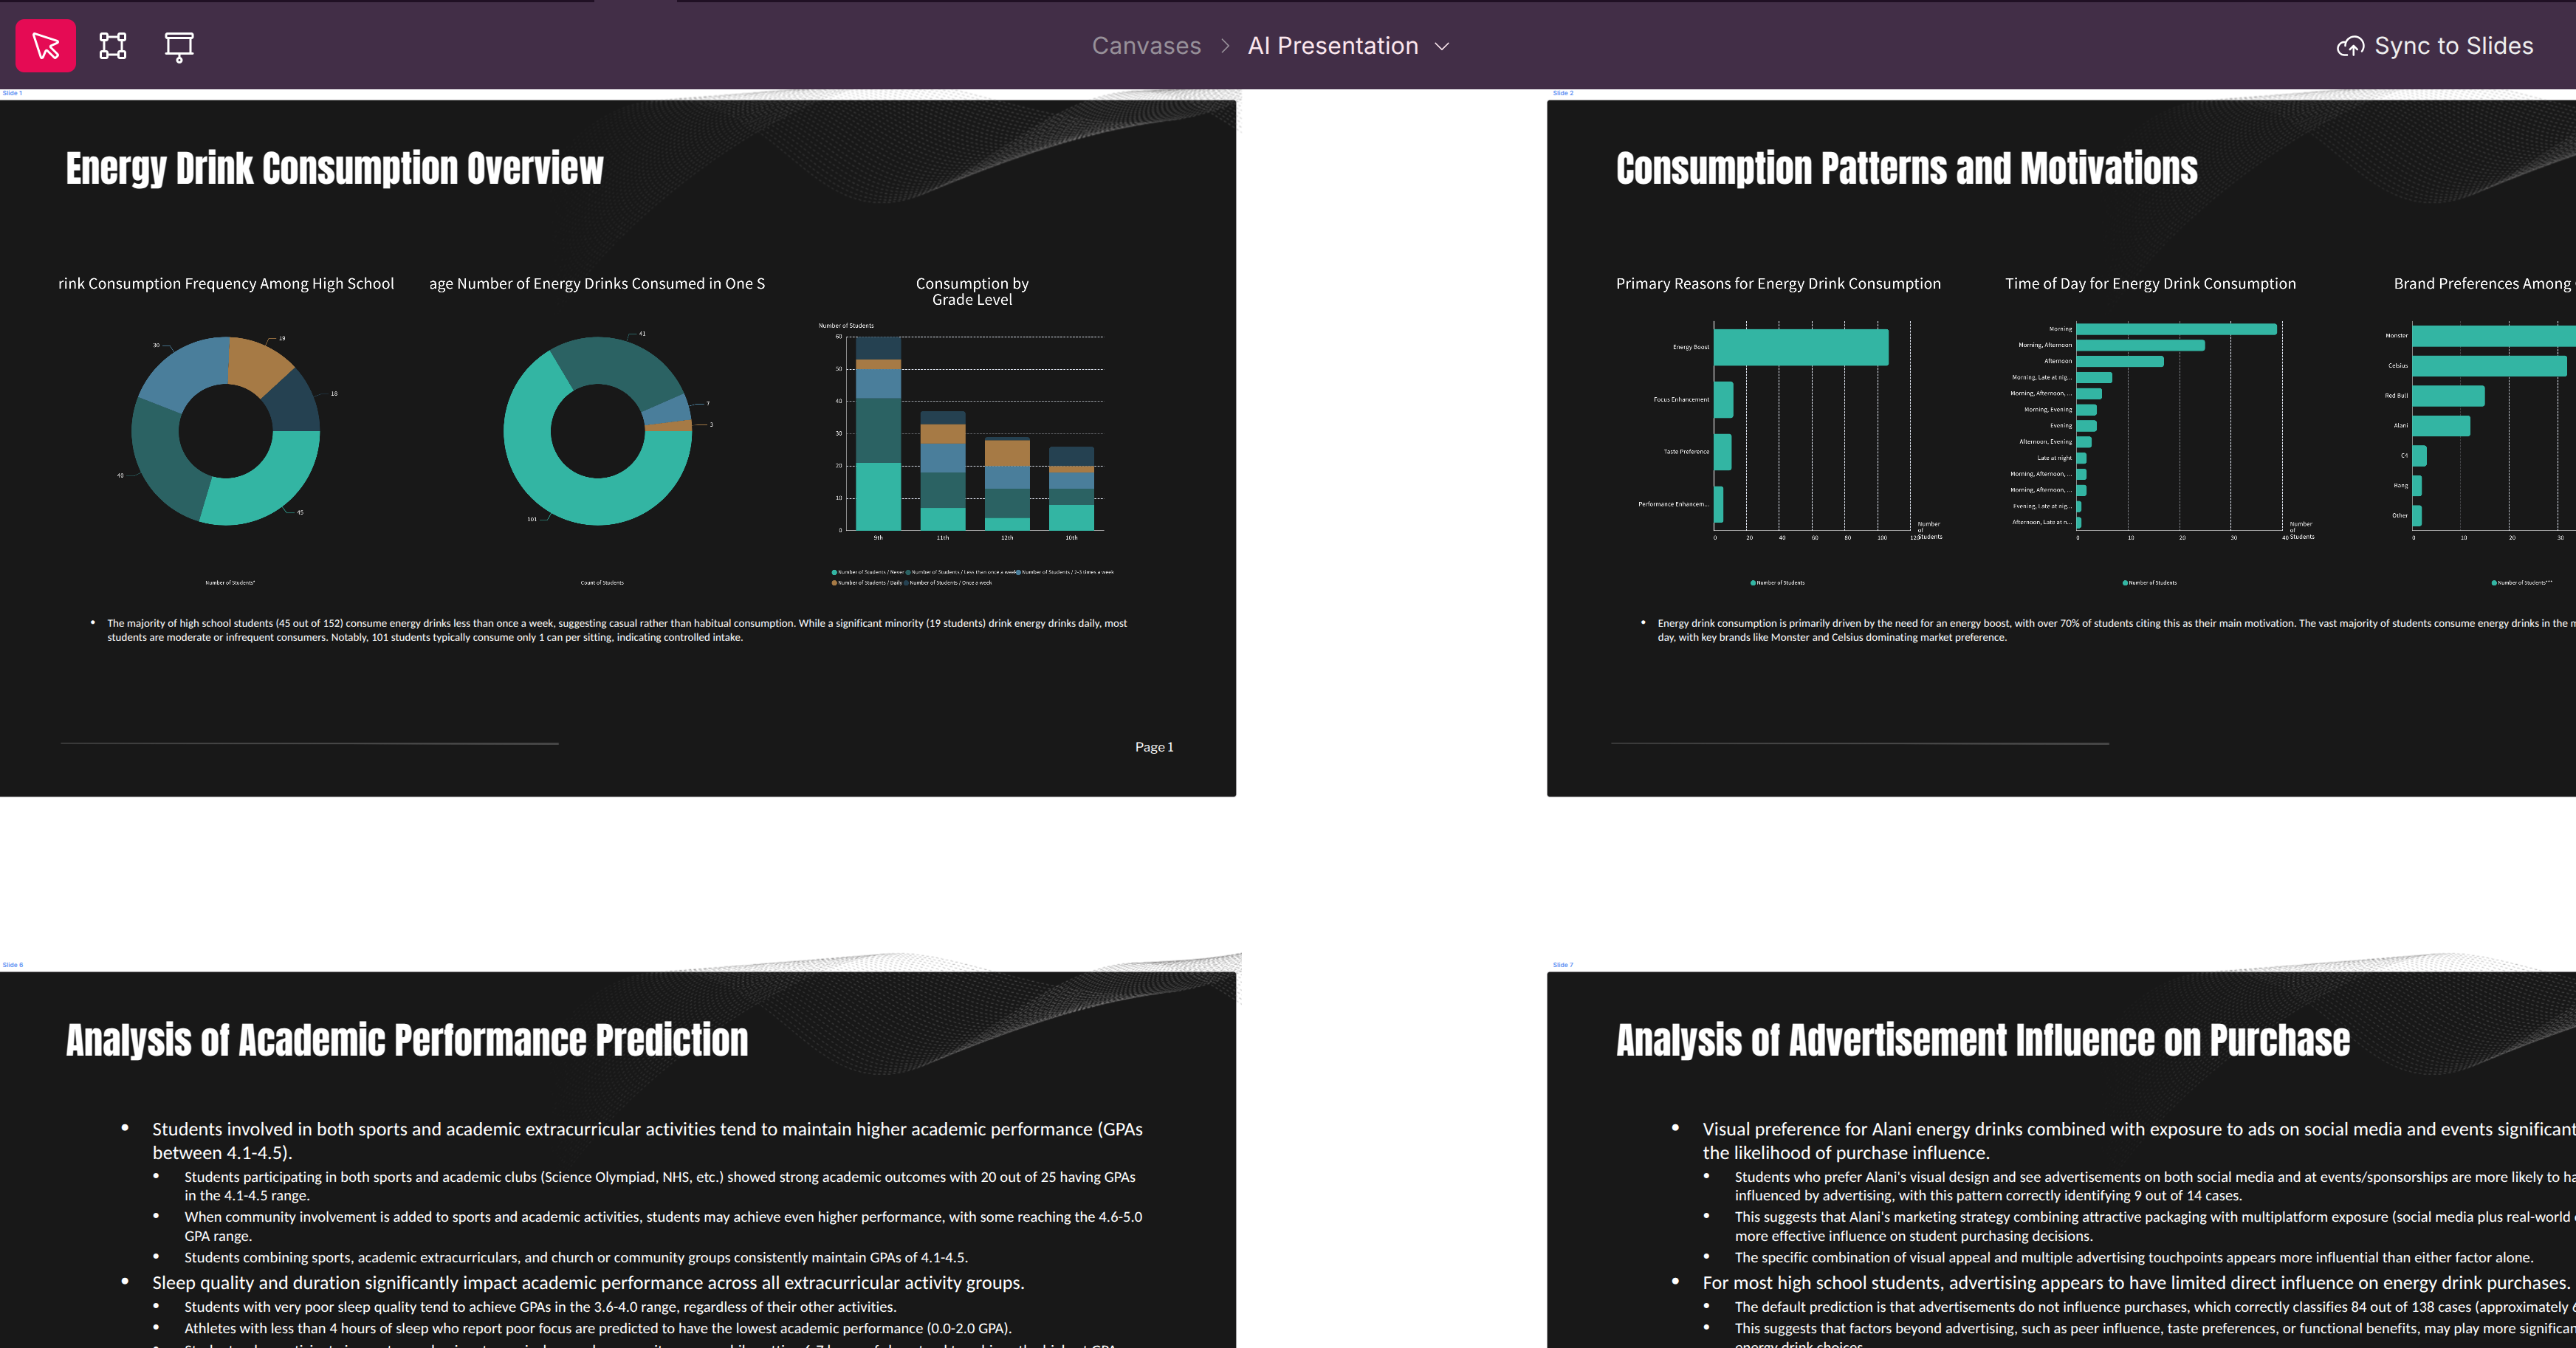
- Canvas & Slide Decks: Scoop auto-generates interactive canvases and PowerPoint-style presentations, blending visuals, AI-written summaries, and your own branding or styles (even extracting themes from uploaded presentations!).
- Each slide is designed to communicate clear, contextual stories—multiple visualizations and KPIs per slide, with automatic prompts and takeaways layered in.
5. Narrative Generation and Executive Summaries
- Scoop’s AI writes short, business-friendly summaries of every key dataset, trend, or ML finding. These bullet points sit alongside your visuals, highlighting actionable insights over raw numbers.
- At the start of every presentation, Scoop generates an executive summary—synthesizing top-level themes, opportunities, or risks without overloading on details.
How Scoop Goes Beyond Traditional BI and Data Science
- End-to-end automation: No coding, no SQL, no manual data wrangling. Scoop covers the whole journey: ingest → analyze → discover → present.
- Integrated AI reasoning: Scoop doesn’t just chart your data—it actually interprets it, tells you what changed, and why patterns are emerging.
- Interpretable machine learning: ML results are always explained in business English, with rules and drivers shown, not hidden behind black boxes.
- Real BI accuracy: Unlike pure AI tools that sometimes "hallucinate," Scoop builds real analytical queries and validates all results on your data.
- Presentation-first workflow: Automated slide decks, smart visualizations, and summary narratives mean your insights are making an impact right away.
Getting Results Fast: What You’ll Experience
- Instant understanding of what’s in your data, including data summaries and anomaly spotting.
- Guided insight discovery: Ask the system smart questions (“What’s changed this quarter?”) or let it suggest important patterns.
- Complete, beautiful presentation decks—ready for your next meeting or email update, with no heavy lifting.
Tip: All AI, ML, and BI calculations run in Scoop’s secure, enterprise-grade back end. You’re in control—no need for technical setup, and all steps are transparent and reproducible.
Conclusion
Automated Dataset Analysis in Scoop unlocks the true power of your business data: not by adding more dashboards or scatter plots, but by adding intelligence—and real storytelling—to every step of the analytics process. Whether you need a quick pulse check or a deep-dive, you’ll go further, faster, and smarter than ever before.
Updated 6 months ago