Loading a Spreadsheet
Uploading an Excel workbook into Scoop is the fastest way to turn your existing business data into dynamic analytics and rich reports. With a few careful steps before import, you’ll avoid common roadblocks and ensure seamless integration, especially when your spreadsheet contains features like merged cells, multiple tabs, or custom formulas.
Step 1: Understand How Scoop Handles Spreadsheets
Scoop is designed to work with standard Excel (.xlsx, .xls) and CSV file formats. When you upload, Scoop will attempt to detect and analyze your file’s structure—converting worksheets into datasets, interpreting datatypes, formulas, and even embedded subtotals. However, some spreadsheet features may need extra attention to import cleanly.
Where does Scoop look for tabular data?
- When you upload a spreadsheet, or setup an email inbox, or connect to a live Google sheet, you have the opportunity to specify a named range to utilize. This is the best practice
- Identify the table of data you are interested in in your spreadsheet
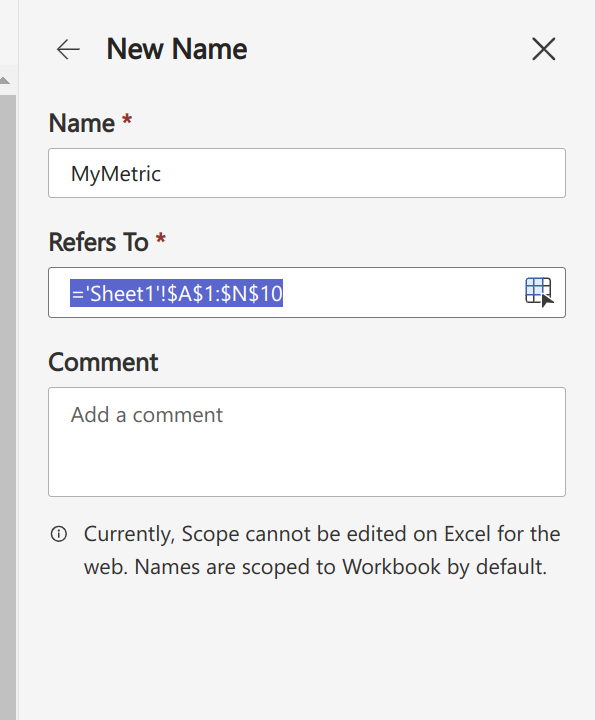
- Create a named range
- Tell Scoop that is the range to use for your dataset. Note that named ranges can come in a couple of different forms. For example you could name a range A1:E5 which is a discrete range, but you can also name a range A:E which means to load everything in columns A through E. In this way, as you continue to add data, the range includes it automatically. Alternatively, you can specify a range which goes beyond your data to accommodate any future rows.
- If you do not have any Scoop ranges in your worksheet, Scoop will attempt to isolate tables from the first sheet in your spreadsheet workbook.
Excel Features and Common Pitfalls
Merged Cells
- Merged cells can confuse Scoop’s automatic column and row detection.
- Data outside the main table area, or irregular headers caused by merged cells, can lead to incorrectly parsed columns or hidden data.
- Merged rows or columns may cause Scoop to infer incorrect field names or lose alignment with your data.
Tip: Before uploading, unmerge any headers or critical data areas—especially in the top row of your table. This ensures Scoop correctly identifies all columns and their names.
Multiple Tabs (Worksheets)
- Scoop will allow you to select which worksheet (tab) to load when you upload a multi-tab Excel file.
- Only one tab is loaded per Scoop dataset. If your analysis requires multiple tabs, upload each separately or ensure all relevant data is on a single tab.
- Hidden tabs or data on secondary sheets will not be imported unless you select and upload them individually.
Tip: Move the most important worksheet to the first tab in your Excel file to save time during upload.
Formulas (Calculated Fields)
- Scoop captures the resulting values of formulas (not the formulas themselves) unless you upload a Live Worksheet (see below).
- Dynamic content that relies on external references, volatile functions (like NOW(), RAND(), etc.), or cross-tab formulas may not update as expected within Scoop.
- If your spreadsheet uses formulas to generate key KPIs, consider hard-coding those values or using Scoop’s own formula engine after upload.
Tip: If you want interactive, editable formulas, use Scoop’s Live Worksheet functionality, which supports live Excel/Google Sheets logic and lets you edit data directly within Scoop (see documentation on "Creating a Live Worksheet").
Embedded Subtotals, Grand Totals, and Summary Rows
- Rows that mix detail data and summary (like subtotals below each group) can disrupt data import and analytics.
- Scoop analyzes and attempts to ignore subtotal and grand total rows—but it’s best to remove or separate them before upload for clean dataset creation.
Non-Tabular Data (Comments, Images, Notes)
- Objects like comments, shapes, images, or embedded charts aren’t imported into your dataset table. Only tabular data (rows and columns) is read.
Tip: Remove decorative elements or notes from your spreadsheet before upload, or ensure they do not overlap with your main data table.
Data Types and Formatting
- Consistent data types in each column make it easier for Scoop to interpret your data (e.g., dates in one format, text in another).
- Mixed data types (e.g., numbers and text in the same column) can lead to less accurate type detection.
- Numeric formats (currency, percentage) are automatically recognized, but extremely customized formats may require review post-upload.
Best-Practice Checklist Before Upload
Use this checklist to prep your spreadsheet for a smooth import into Scoop:
- Unmerge all header cells. Ensure the first row is simple, with only one value per cell.
- Remove embedded subtotals and grand totals. Keep only the raw data rows.
- Check for blank header rows. The first row should contain clear, unique column names for each field.
- Standardize date formats. Use a consistent format (e.g., YYYY-MM-DD) for all date columns.
- Flatten hierarchical data. Each row should represent a single record (no nested or grouped rows).
- Ensure consistent data types down columns. Avoid mixing text and numbers in the same column.
- Decide which tab to load. Make your main data worksheet the first tab, or upload each tab as its own dataset.
- Remove comments, images, and unrelated notes. Scoop will only import table data.
- Consider static values for complex formulas. For crucial calculated fields, copy-paste as values to avoid calculation mismatches.
- Save your file as .xlsx or .csv. These formats ensure maximum compatibility.
Loading Your Spreadsheet Into Scoop
- In Scoop, go to the Live Worksheets or Datasets section.
- Click New Upload or New Live Worksheet.
- Select your file and, if prompted, pick the worksheet/tab to import.
- Review the automatic column detection on the import preview screen. Adjust column types if necessary.
- Click Finish to load your data into Scoop. The system will analyze your file and show any warnings or errors.
Tip: For ongoing spreadsheet analytics, consider making your spreadsheet a Live Worksheet in Scoop. This allows direct editing, formula updates, and dynamic integration with other datasets, even after initial upload.
What Happens Next?
- Scoop will scan, type, and index your data, detecting columns, formats, and possible subtotals or summary rows.
- You can now build charts, dashboards, or interactive presentations using your imported data.
- If needed, use Scoop’s built-in data preparation and transformation features to further clean or augment your dataset.
When loading a spreadsheet .xlsx file (either by uploading or by email), Scoop will analyze the contents of your spreadsheet attempt to extract tabular data.
De-pivoting of Dates
A very common pattern in a spreadsheet is to have a series of attribute columns and then have a series of columns across the top that represent a single metric over many periods (say months). If those dates are proper dates (not date labels), Scoop will de-pivot those columns into a date attributes so that you can do analysis in Scoop over time.
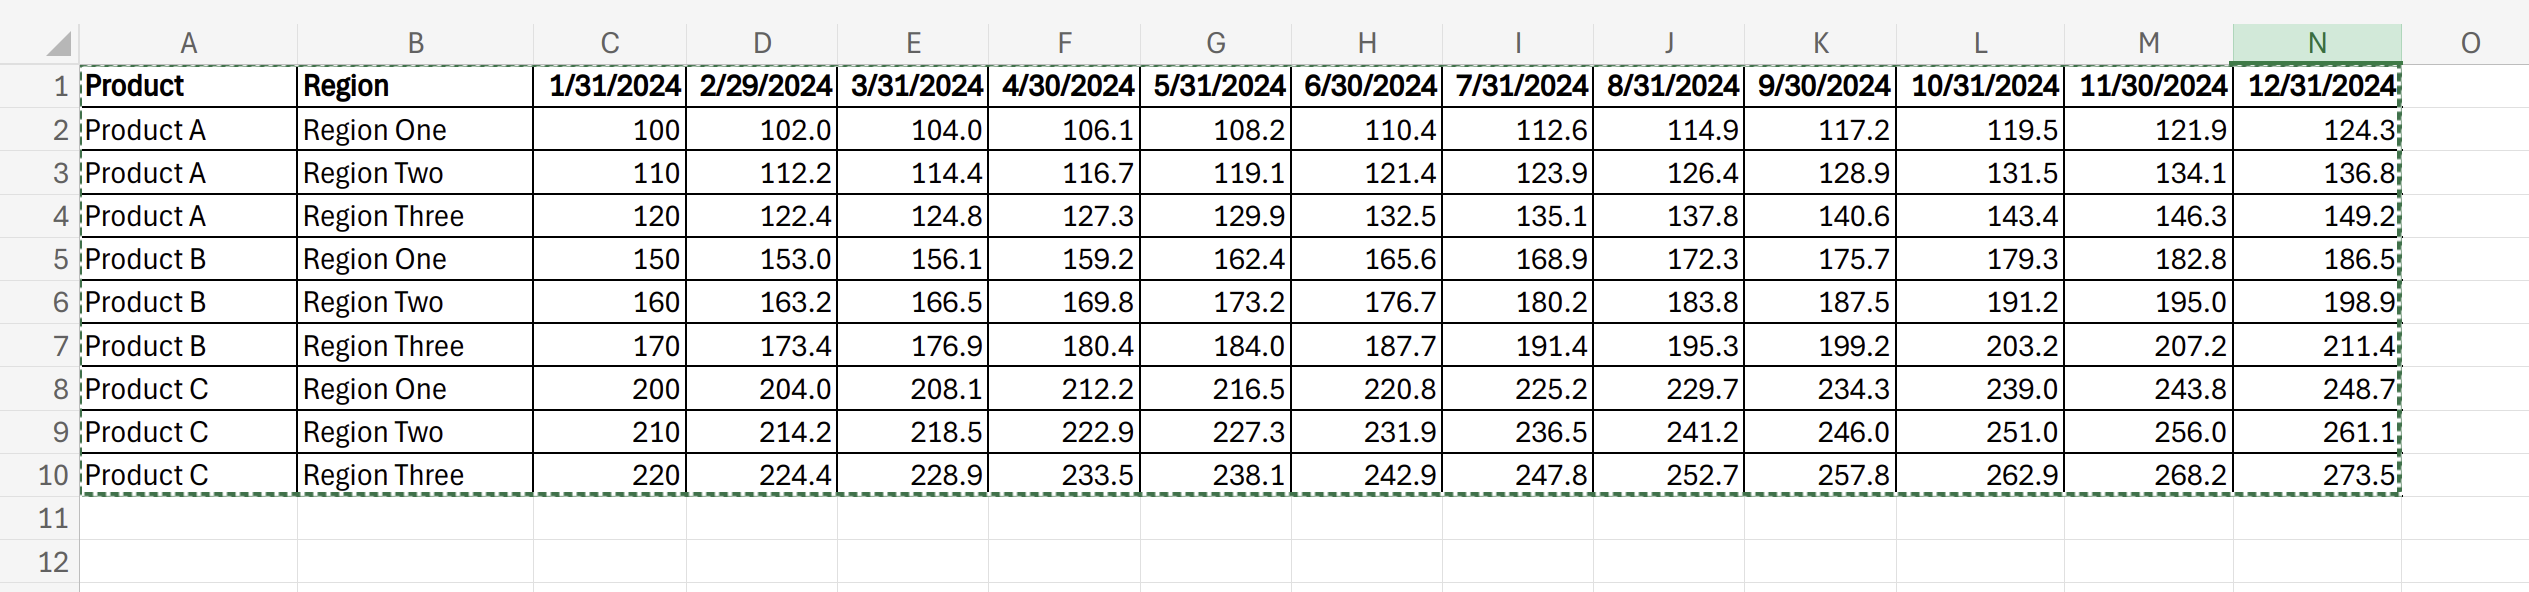
In the example above, you can see this pattern. In the case where there is a single date series along the top, and the dates are actual dates (not text), Scoop will de-pivot those dates into rows which will allow you to analyze that data over time. By default, Scoop will create a new column with the name of your range as the metric.
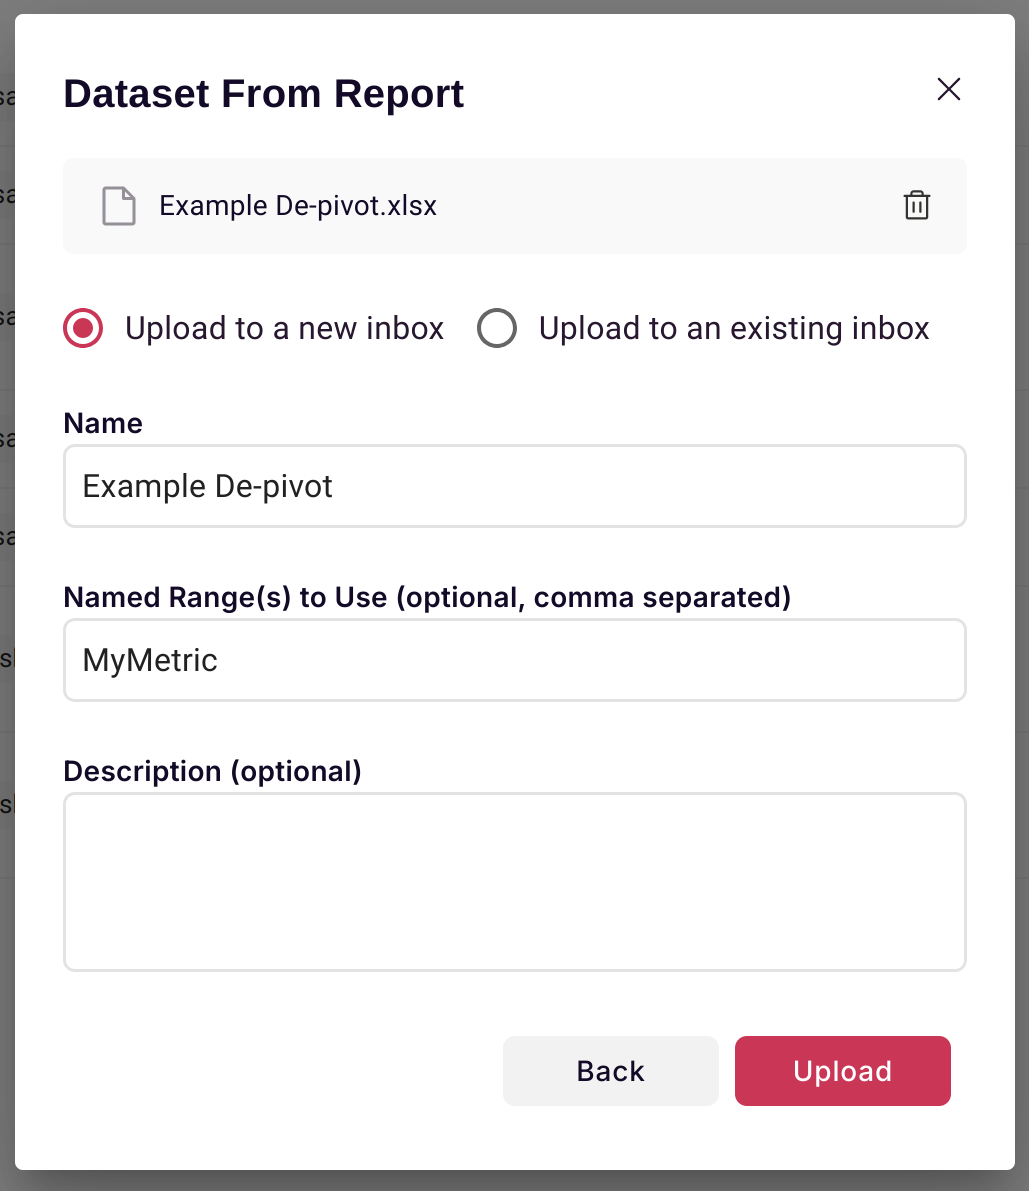
And during upload:
Which then creates a Scoop dataset:
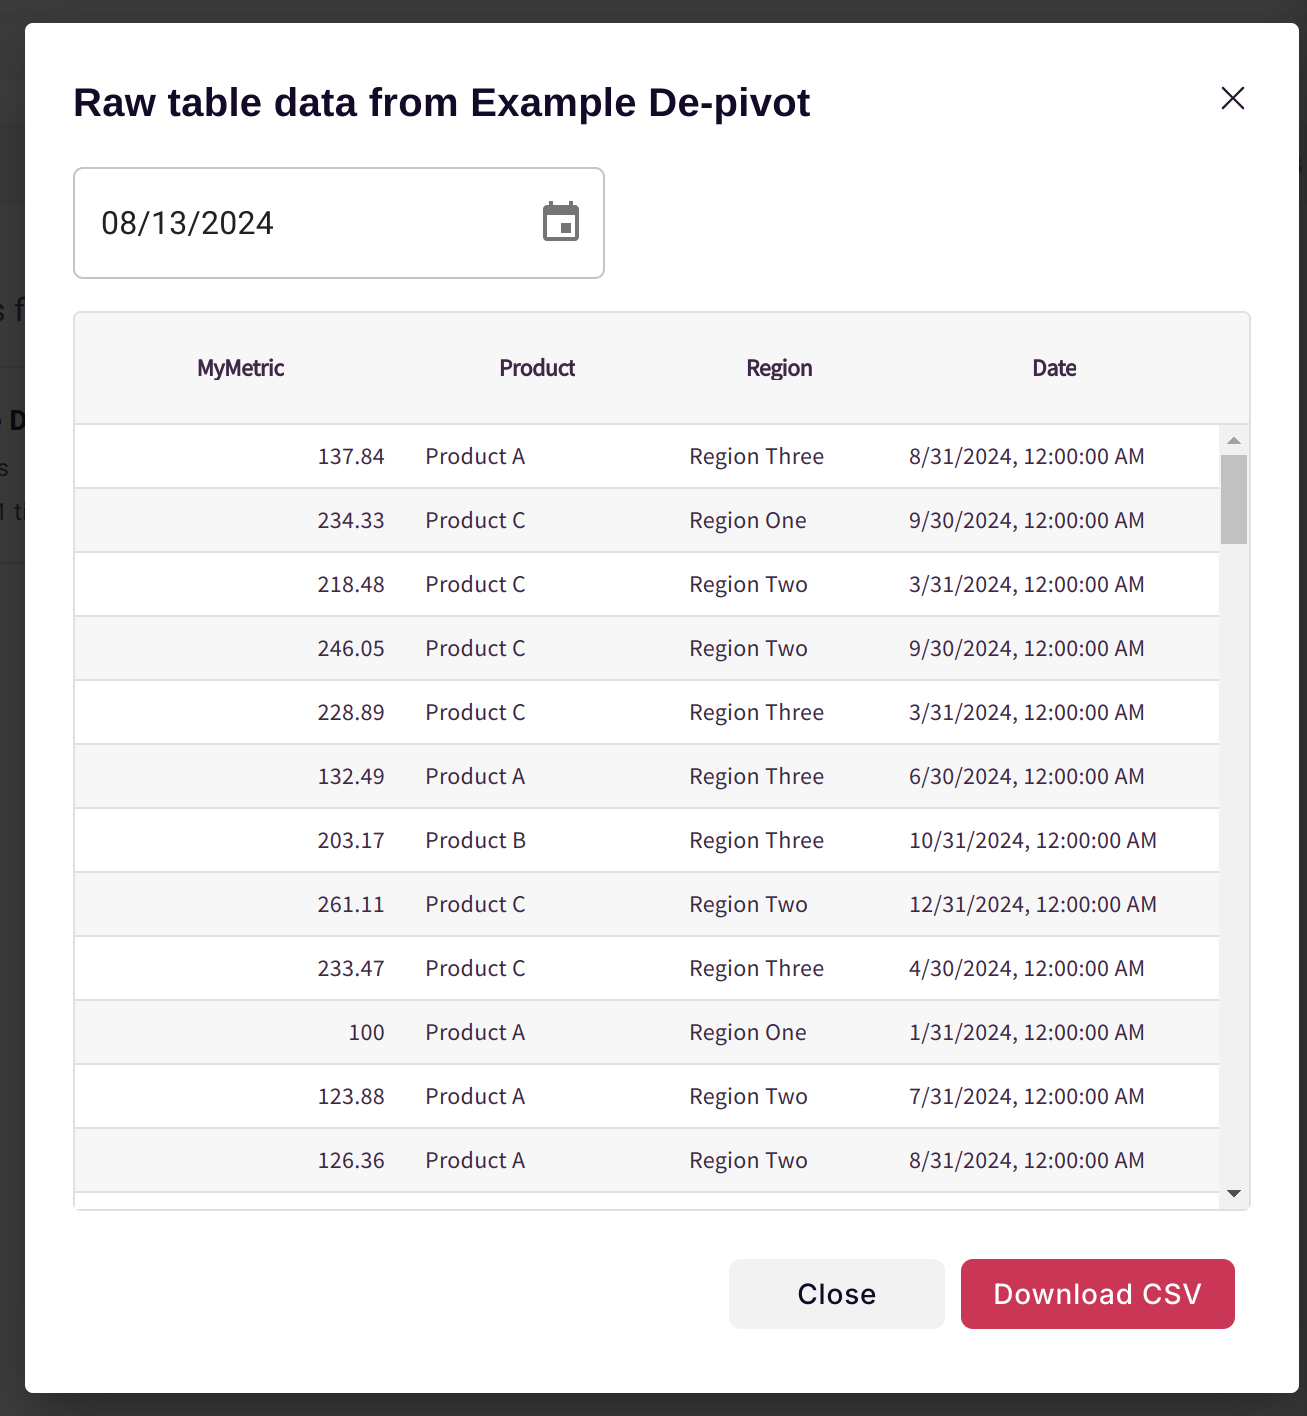
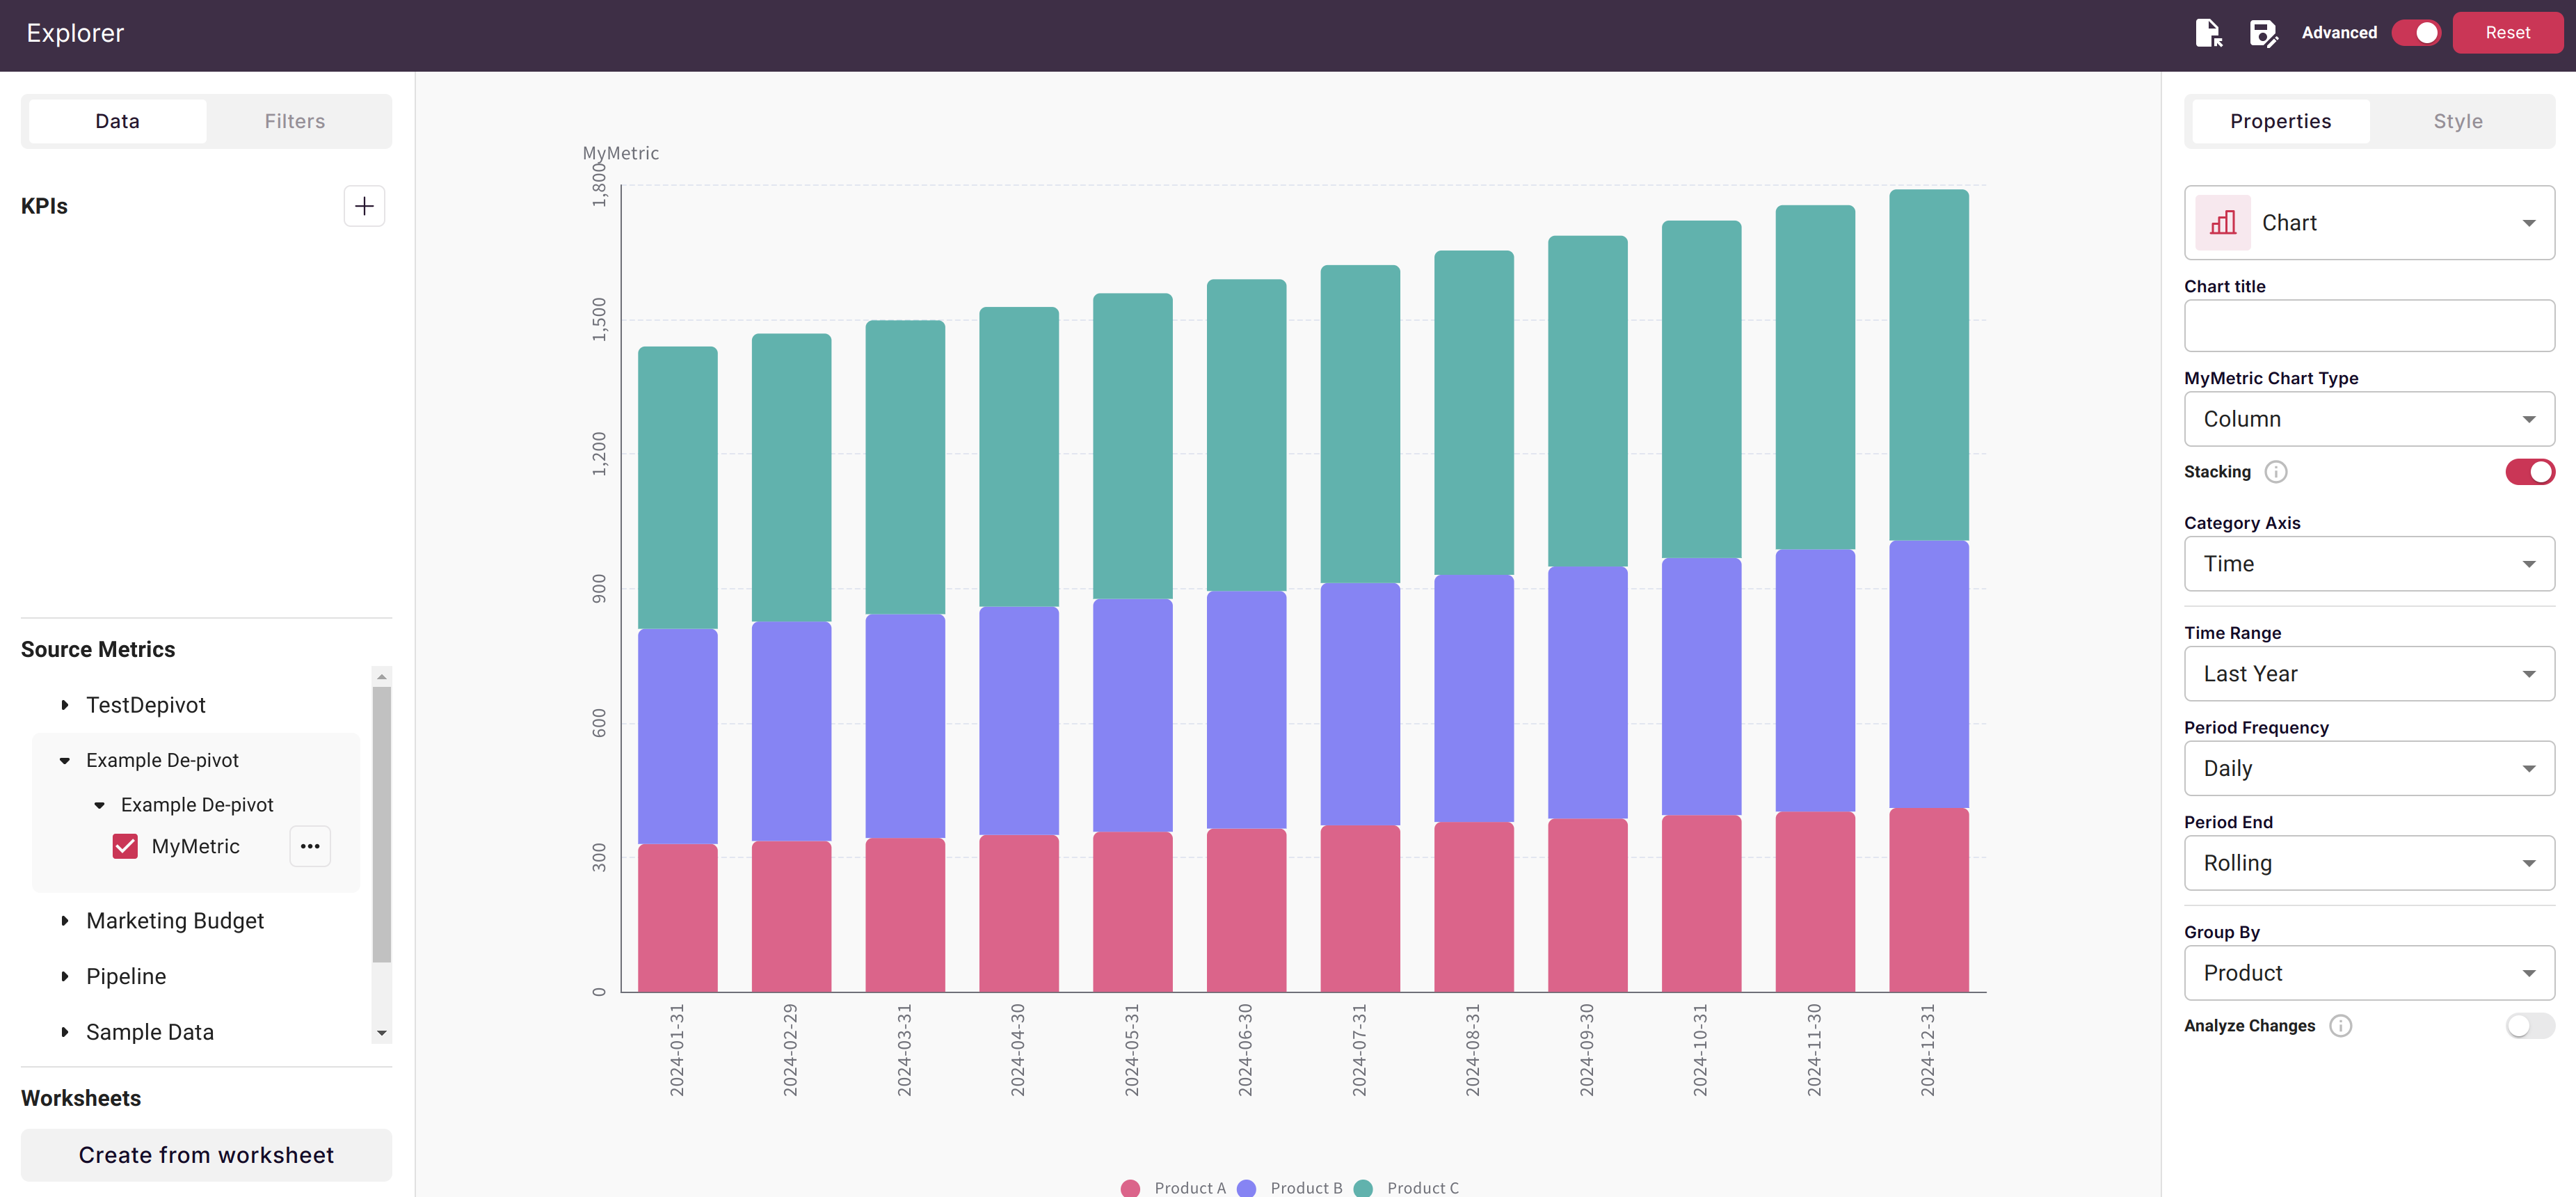
Allowing you to analyze your data flexibly:
For more details on Live Worksheets or advanced Excel integration with Scoop, visit our Live Worksheets documentation.
Updated 7 months ago