Scoop Quickstart Guide
A quick, self-guided example walking you through the basic Scoop Workflow to go from reports to analysis. It should take at most 5 minutes.
Below are two very quick and simple options for jumping right into Scoop.
Using an Instant Recipe
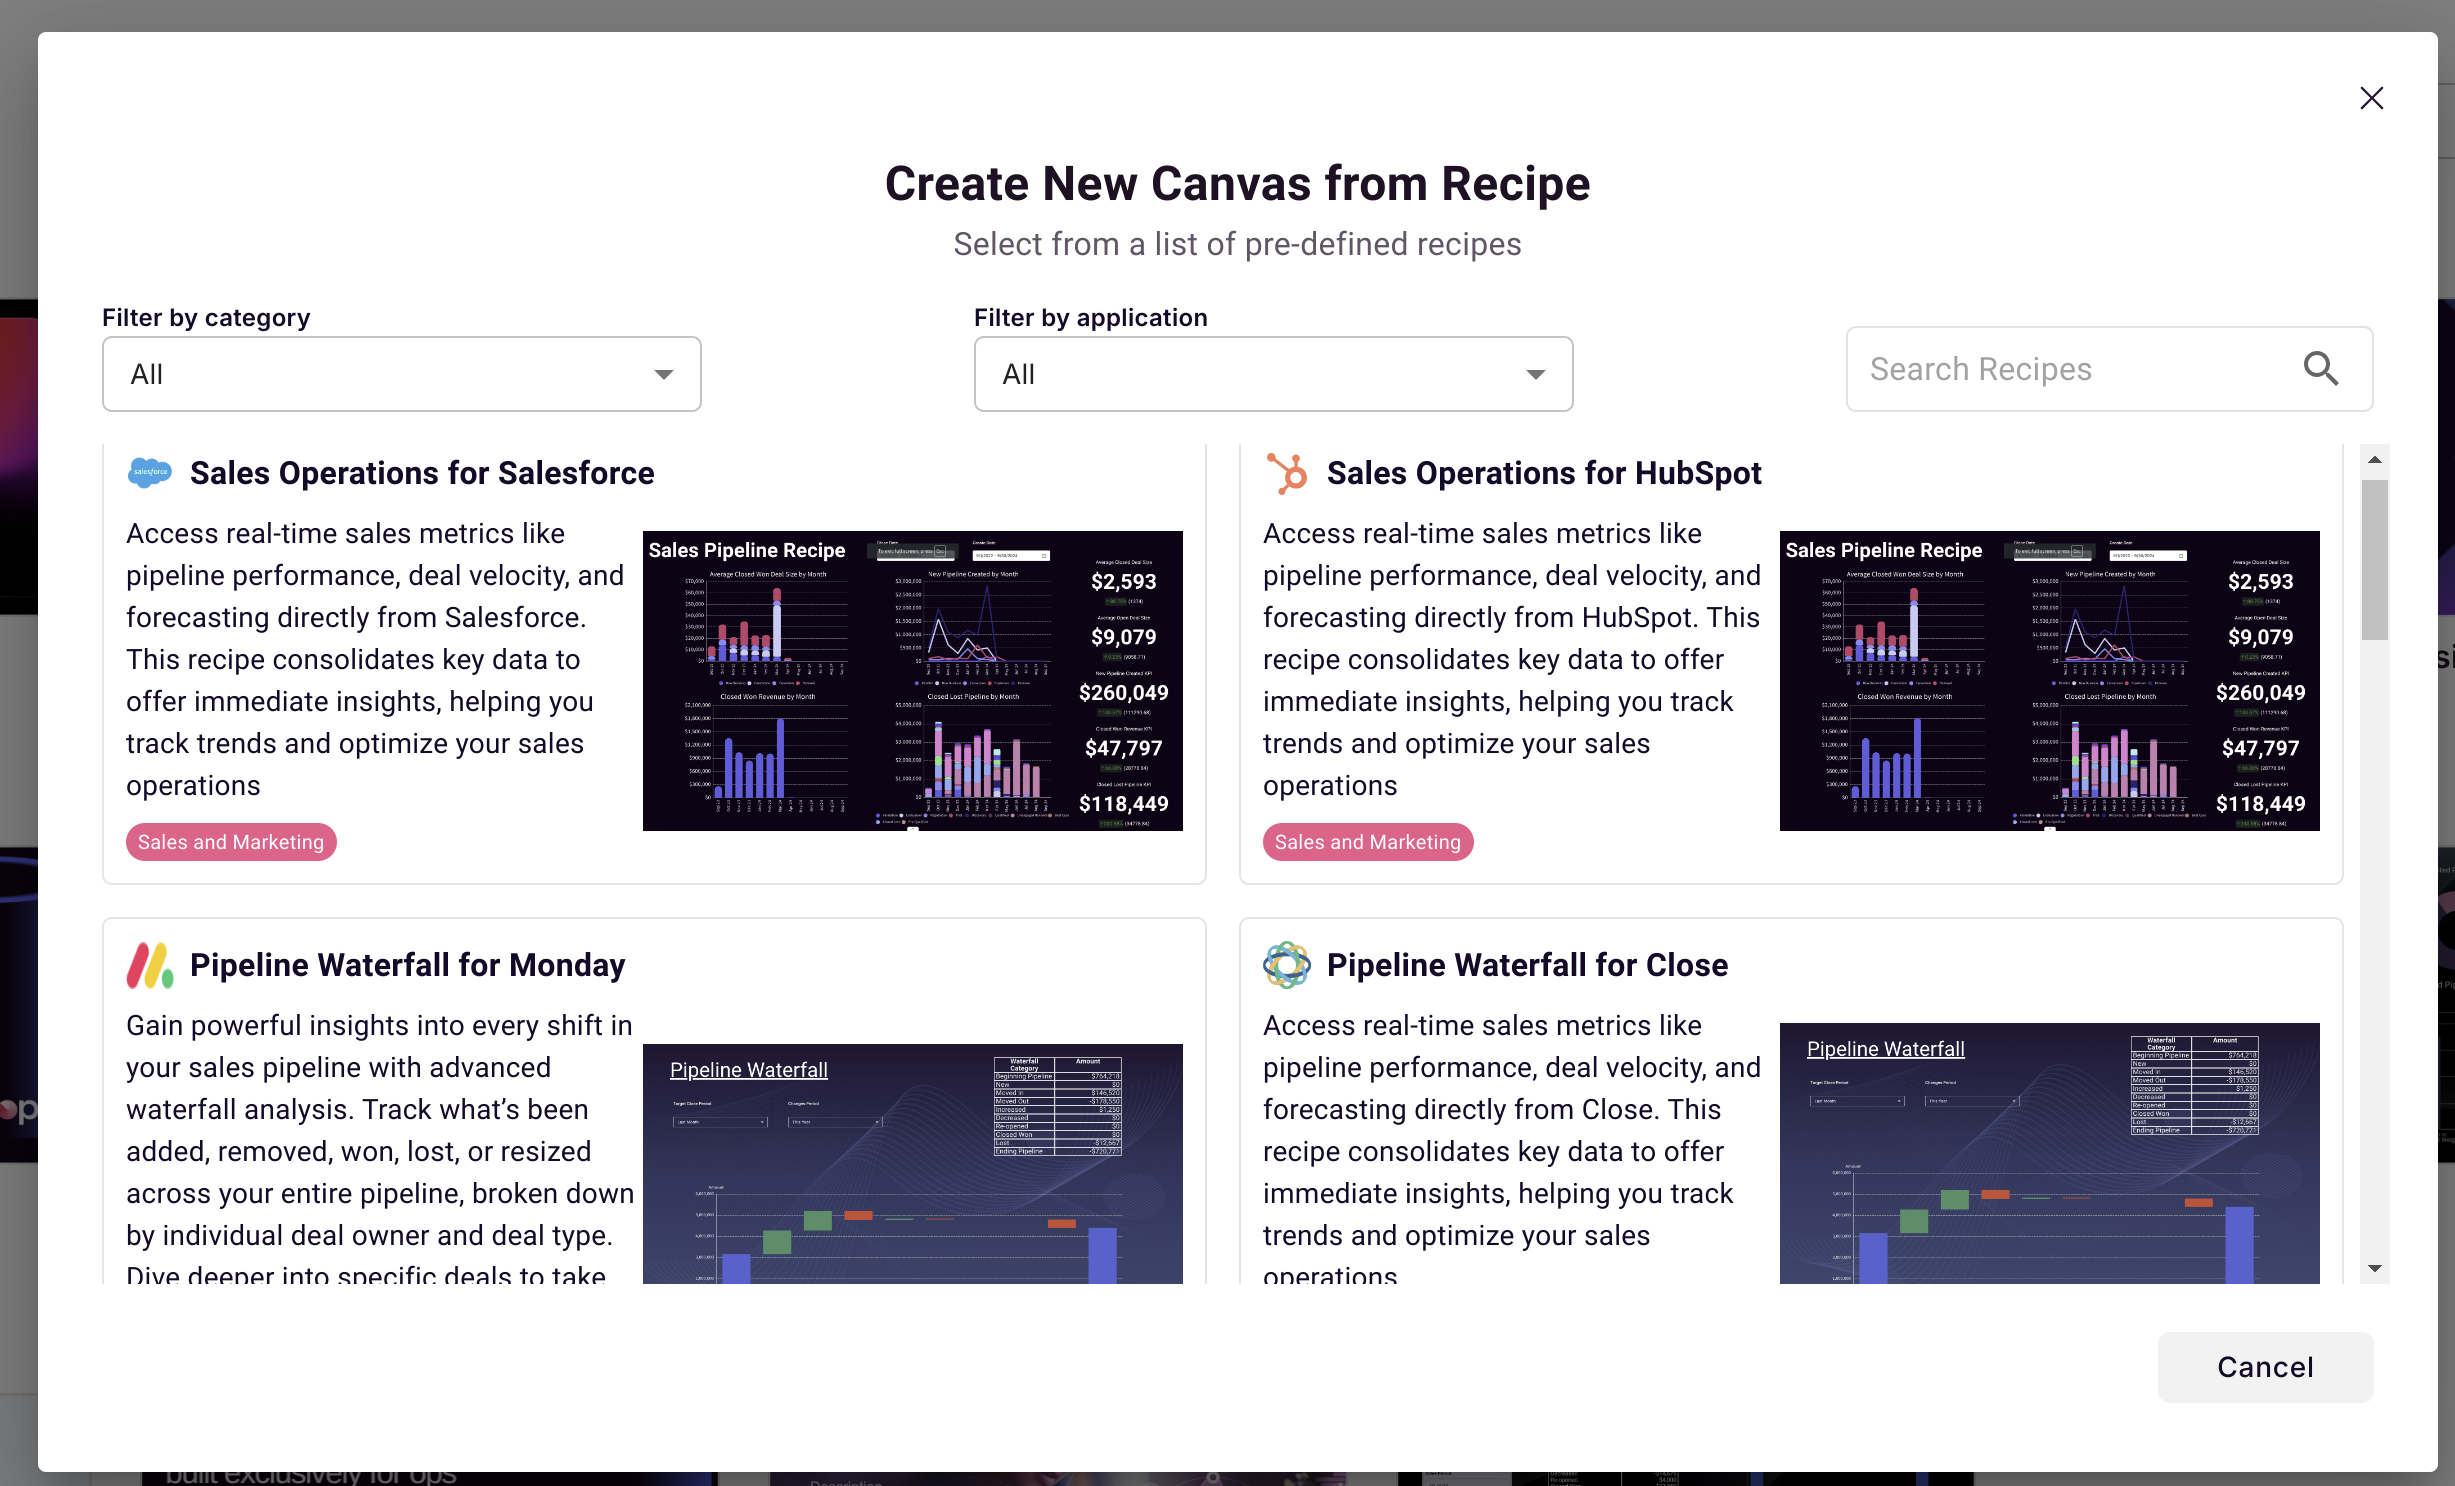
Instant recipes are just that - instant. If you have one of the instant recipe datasources, you can create an account with Scoop, populate it with your data and having it working for you with a few simple clicks and in under a minute. Explore the link below for our growing list of instant recipes.
https://www.scoopanalytics.com/instant-recipes
Using a Sample Report
If you would instead like to use some sample data, and also explore Scoop's completely unique ability to read report output from any application, then you can use this quick start. This will be a very quick example showing you how to take a single report, load it into Scoop, create a couple of visual analysis and then create a canvas. This quickstart guide does not cover automating those reports so that Scoop will automatically grab a new one each day and keep your analysis live. See Connecting to a Business Application or Connecting to a Database to see how you can do that to create a truly live and always up-to-date data application.
To get started with a simple dataset:
-
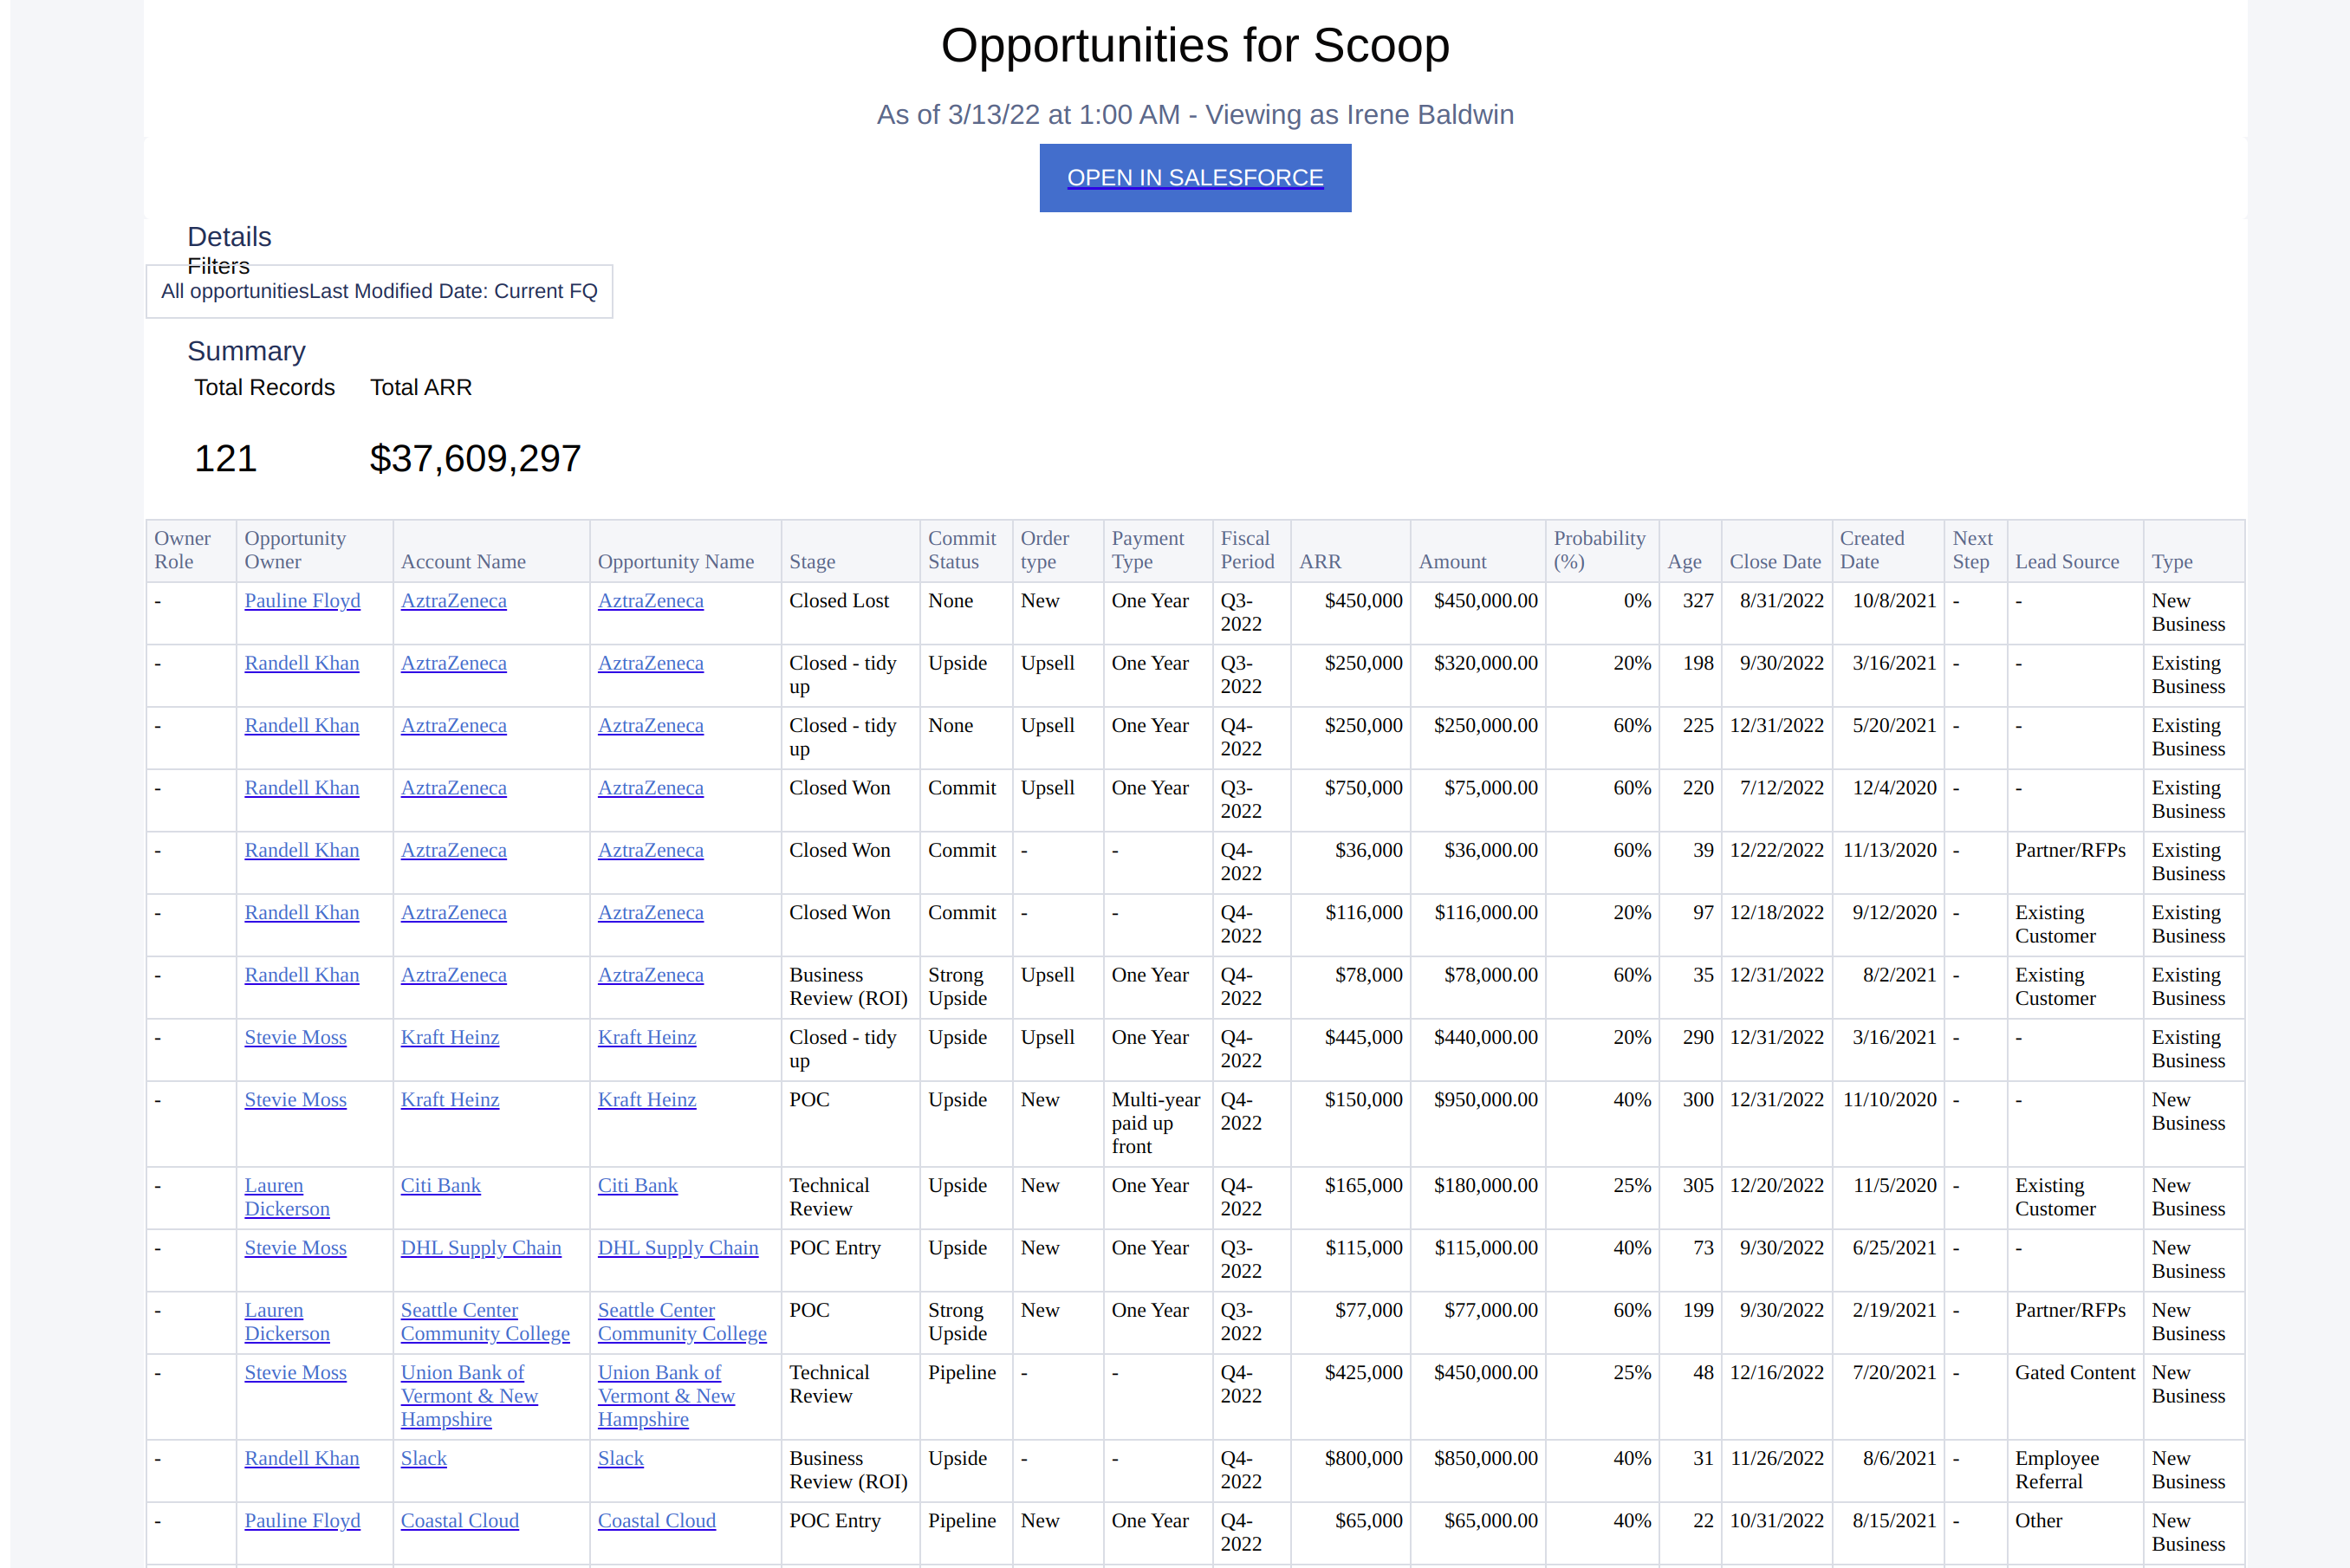
Download the sample report below (using the link provided). This report lists all the open sales opportunities for one company on one day. When automated (as simple as setting up a daily email report from Salesforce), Scoop will ingest this report every day and record a detailed snapshot of all deals in your sales pipeline each day, which over time, provides rich analysis of your sales process. For this quickstart guide, we are going to start with a single report on a single day and show what Scoop can do with that. But spending the extra 20 minutes to automate the report provides dramatically more power. See Connecting to a Business Application to see how you can automate reports to be ingested into Scoop automatically, daily.
-
You will notice, however, that the report above is in HTML. It also includes things like totals. Scoop's intelligent "scooping" engine reads these reports and understands the data in them. It knows how to find the data in the report, and what is a total/subtotal vs. raw data. Scoop will use formatting and aggregation settings from this report to automatically set those same defaults for itself. If you use a certain number of decimals, add a currency format, or know that some things need to be counted vs summed, Scoop will infer all of that from the source report.
-
Log into Scoop
-
Navigate to your personal workspace (or whatever Scoop workspace you might want to use) and select the dataset icon:

-
Select add new dataset with the button on the top right:

-
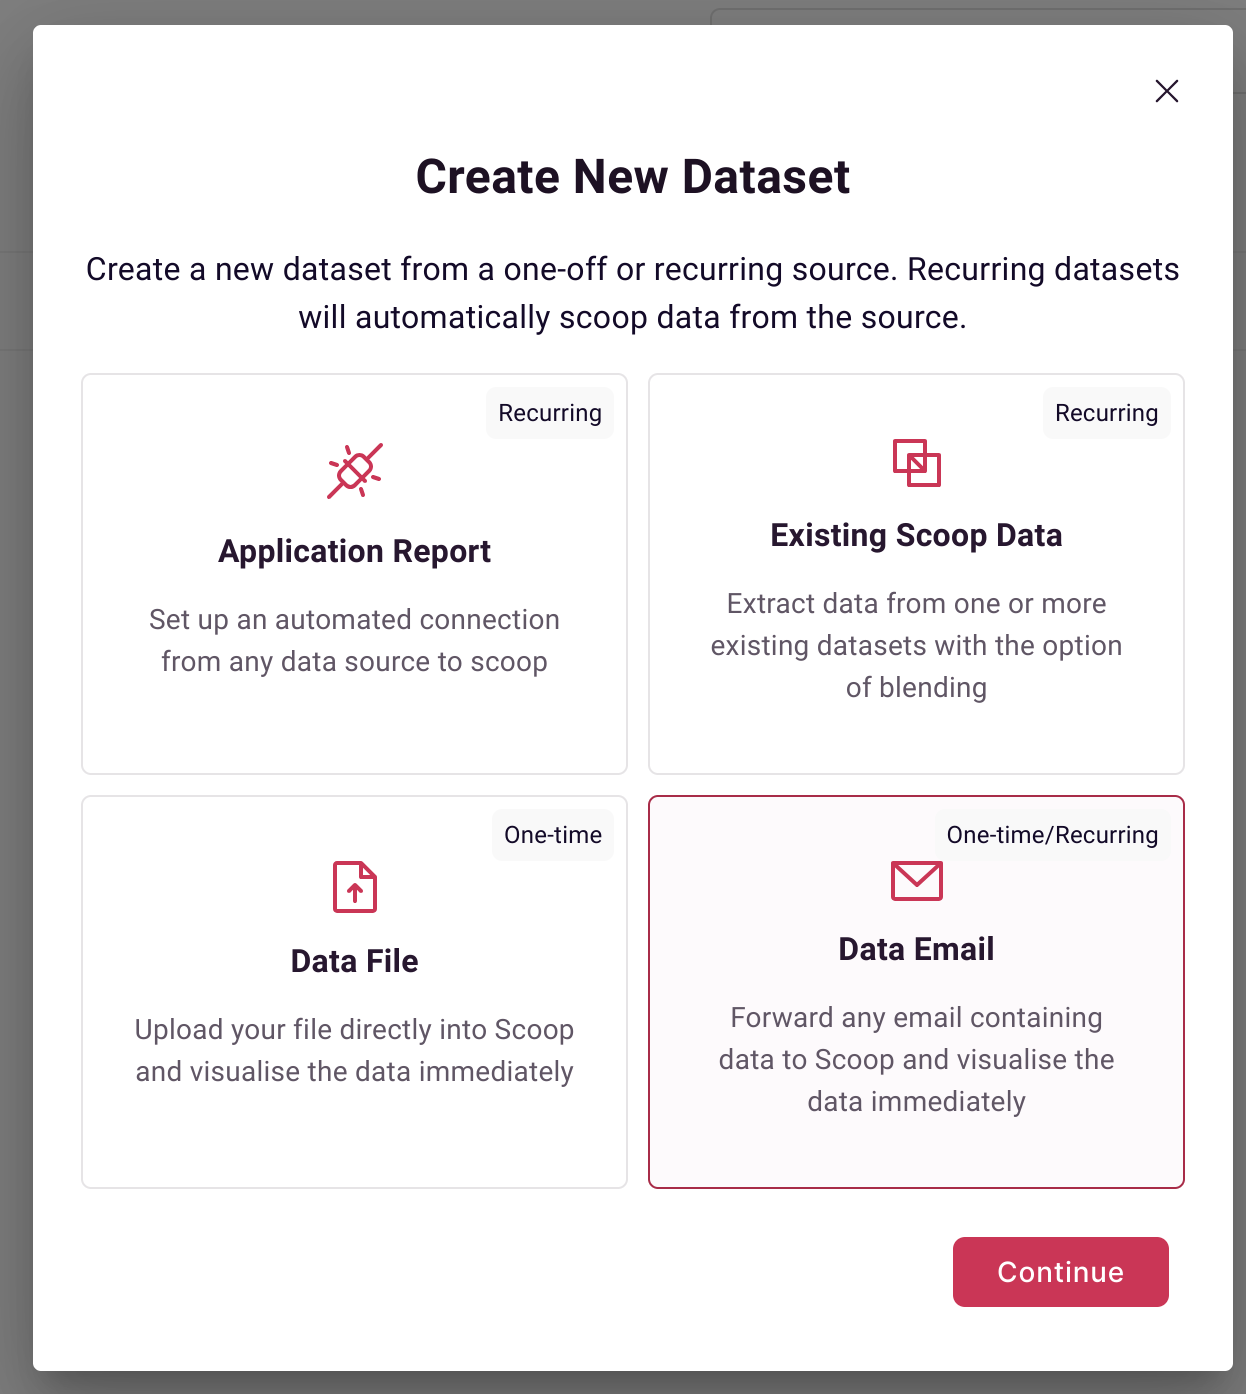
Then select the Data Email option and then press continue. As mentioned above, this is the option to manually send one file of data by email to Scoop (illustrating how easy it is to use that mechanism to automate report loading). A single report is useful for testing and data exploration, but Scoop is vastly more powerful when Scoop is setup to automatically load your reports.
-
-
Click Let's Go

-
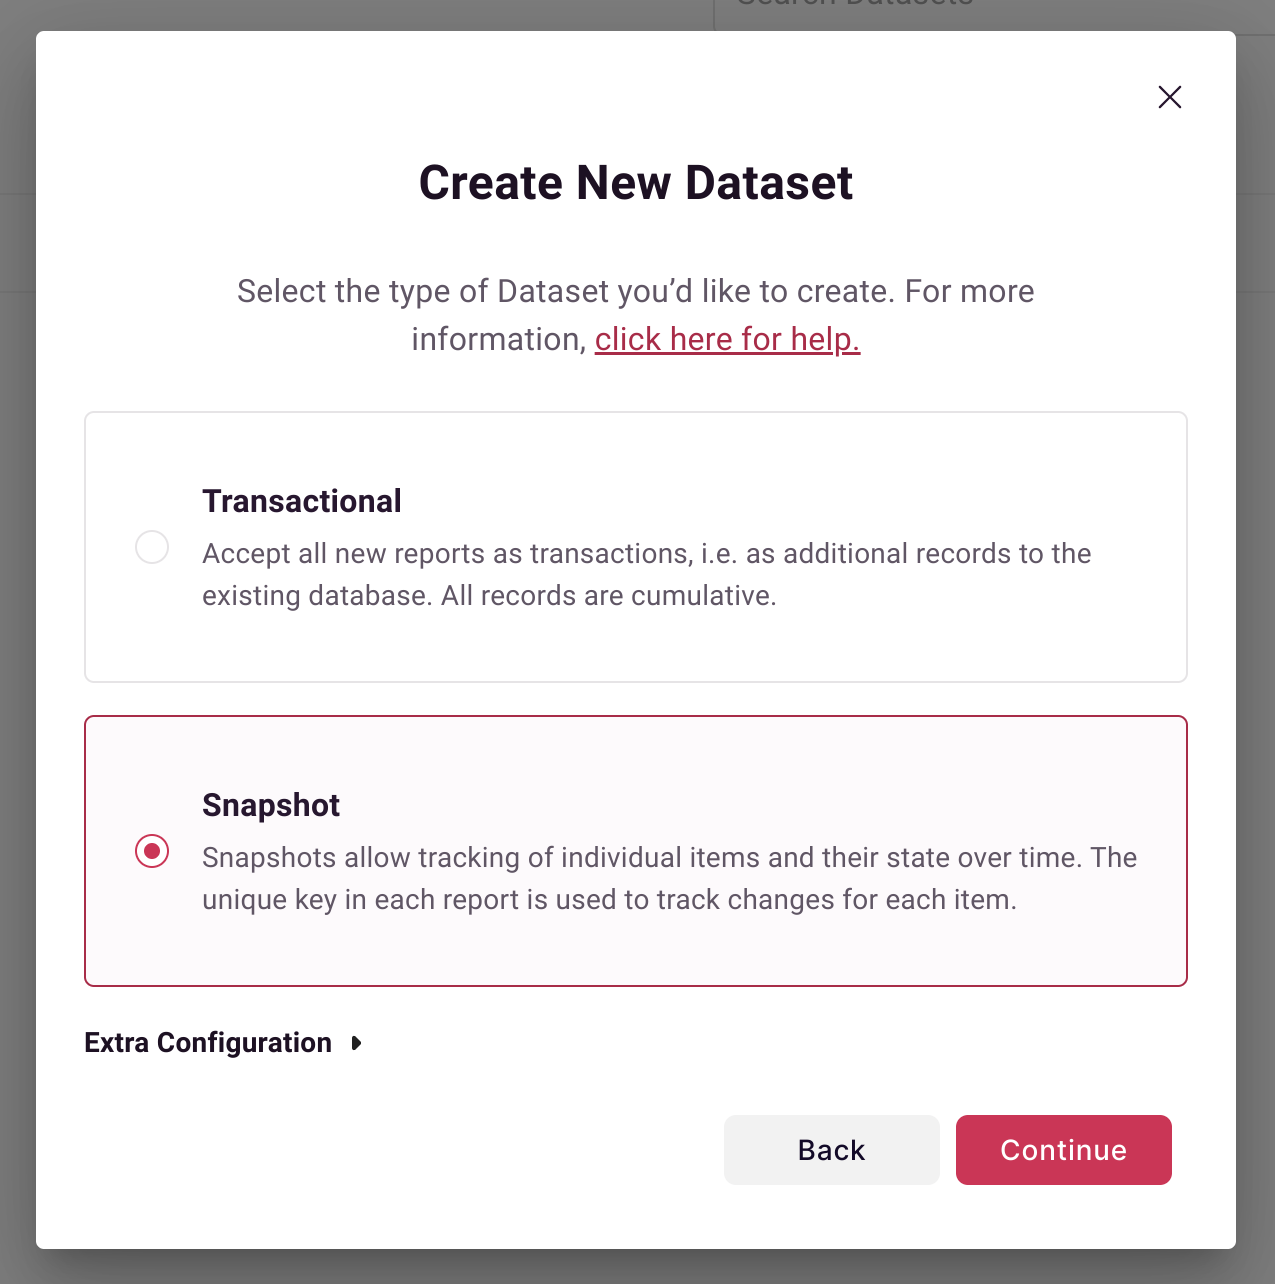
In this case select "Snapshot". Since we are sending a single report it actually doesn't matter what you select here. The selection becomes important if you have a unique key in your report and each report is sending updates about the same sets of items. See Conceptsfor a brief description of snapshot analysis. Click continue.
-
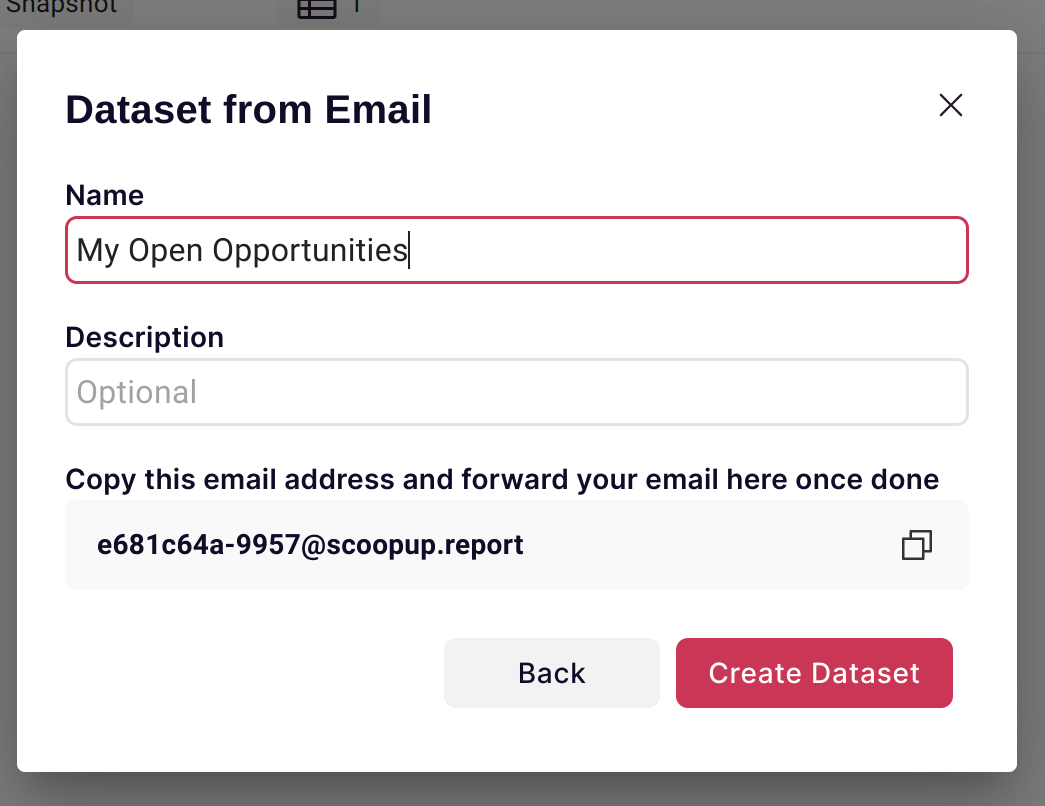
Add the name of your dataset. As this report contains a list of open sales opportunities it would make sense to call it "My Open Opportunities". Note the email address that is provided. Click on the copy to clipboard icon. This will save this address so that you can use it when you forward your report via email to Scoop. Then click Create Dataset.
-
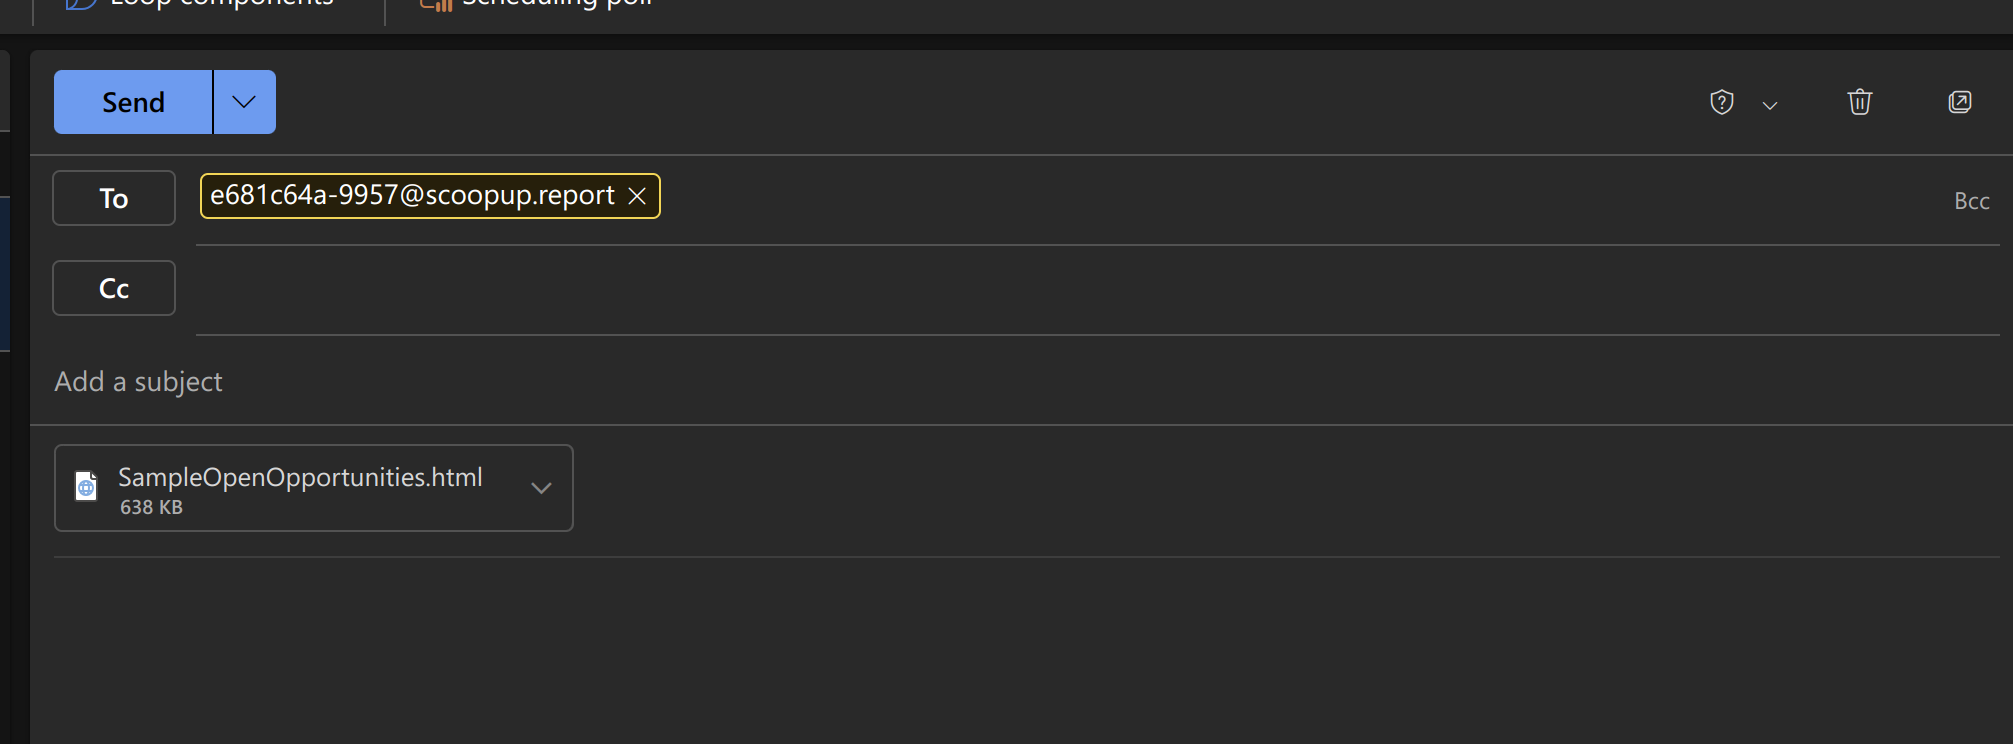
With whatever email client you use, attach the SampleOpenOpportunities file you downloaded above, and forward it to the address provided.
-
After a minute or so for the email to reach Scoop and become processed, you will see that the file was processed by Scoop - note the 1 next to My Open Opportunities

-
Now click on My Open Opportunities. You will see in the Scoop history an entry for this report load

-
Now click on the Tables tab
-
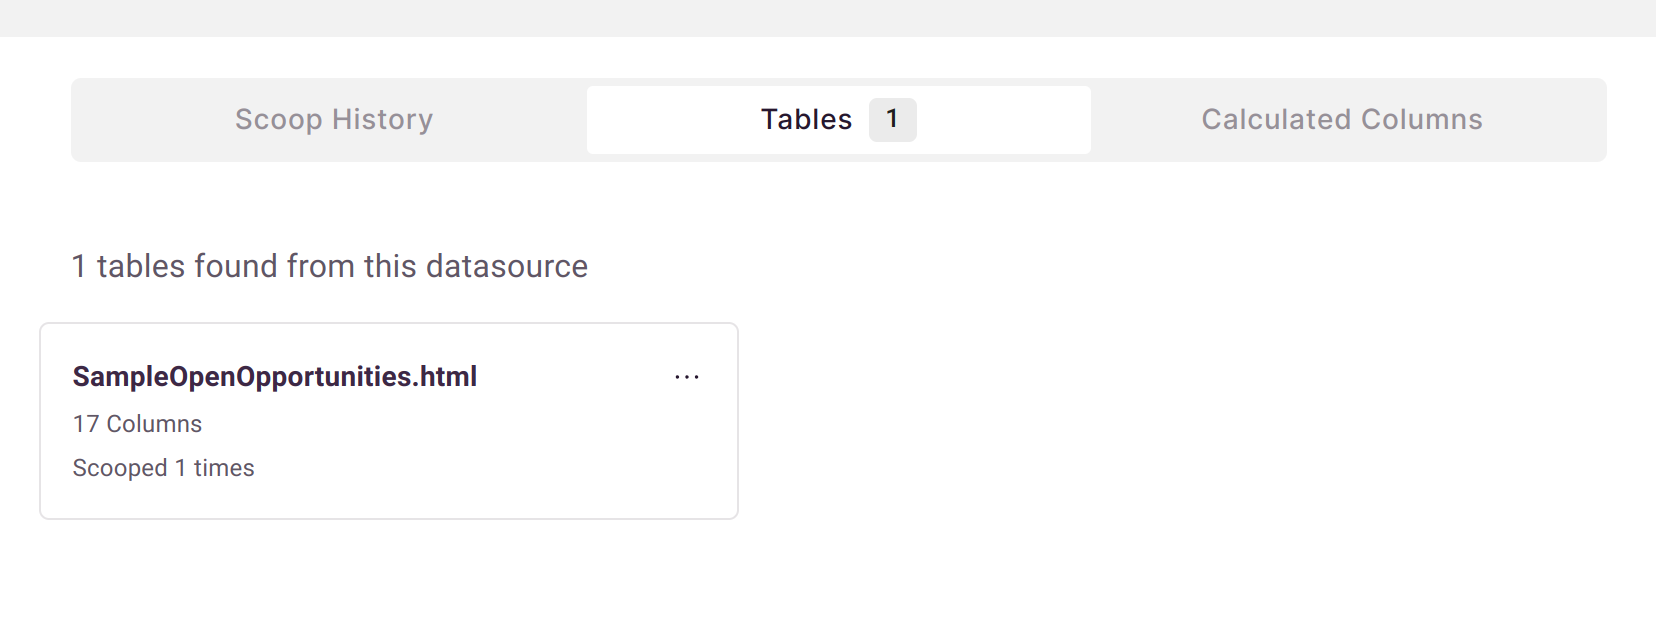
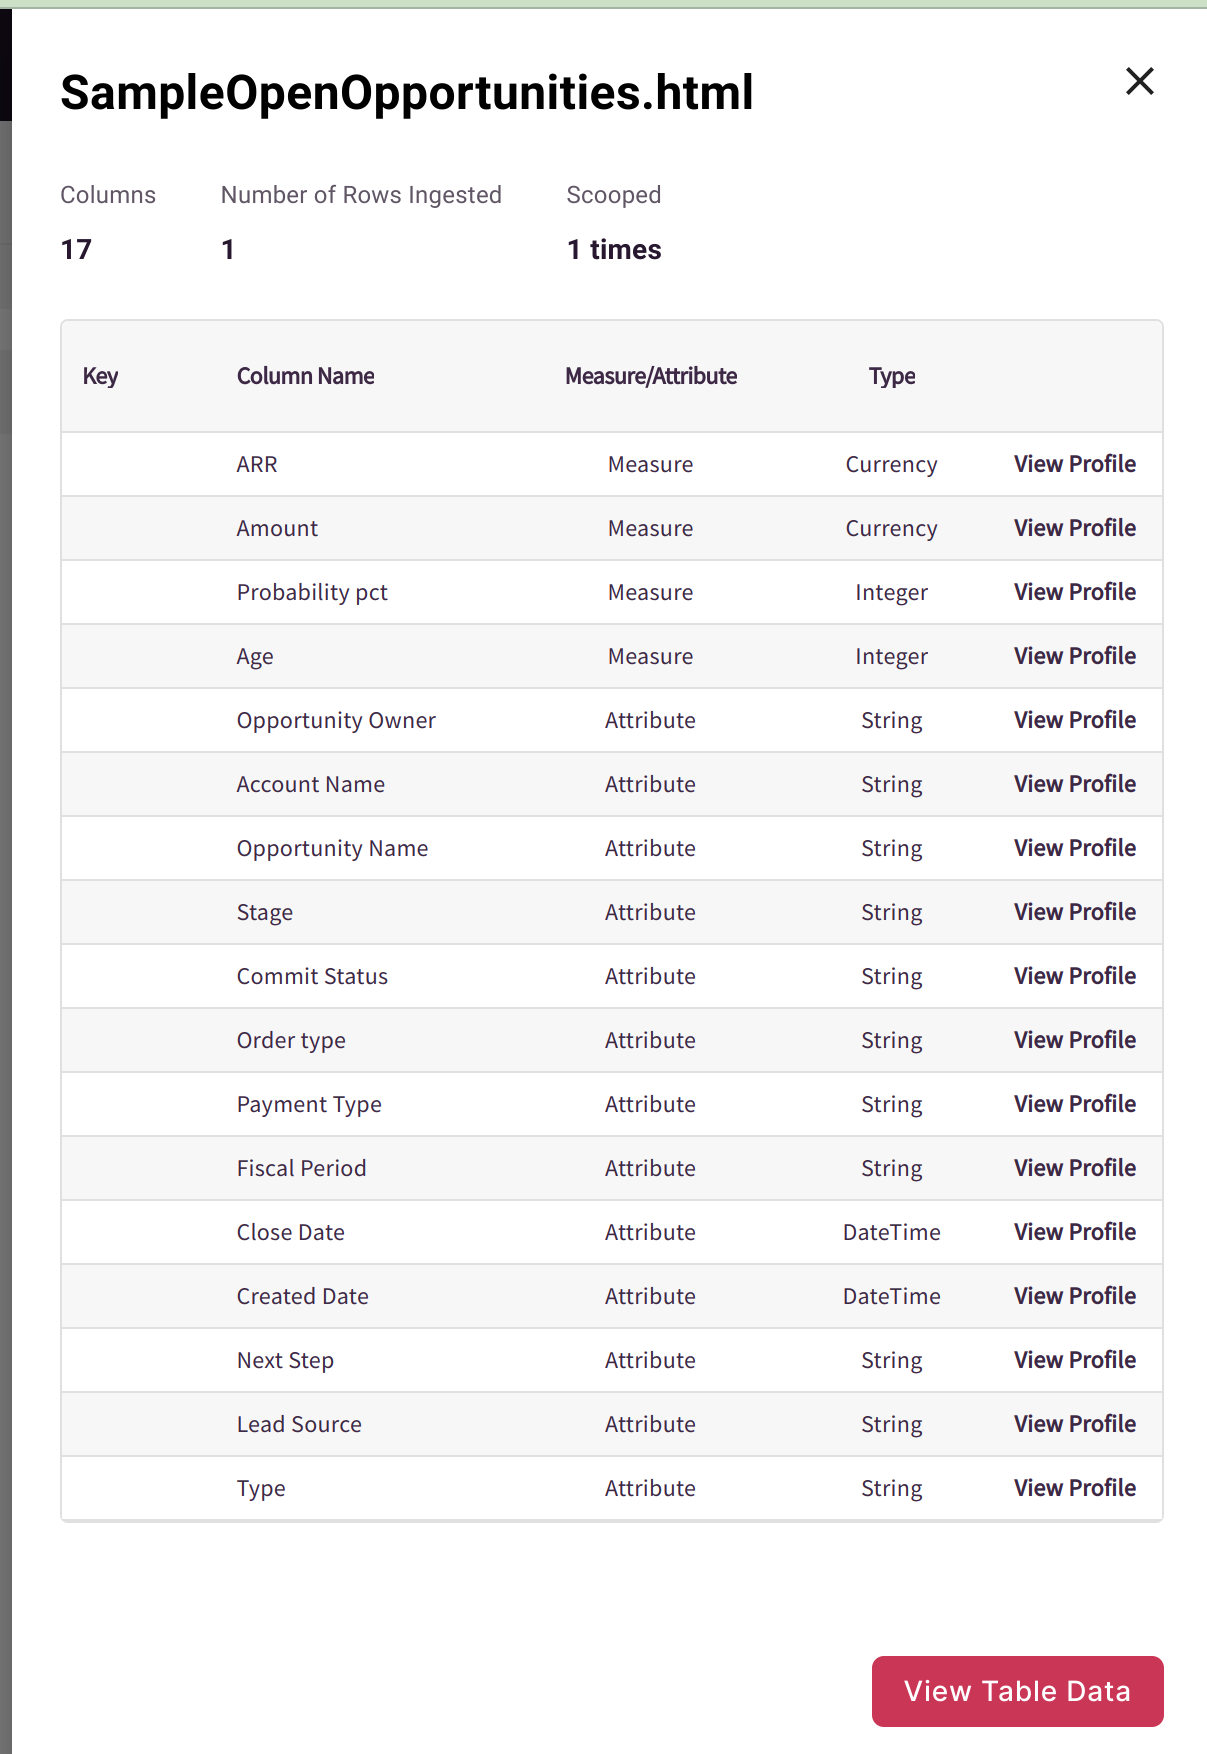
This shows the table that was created for that report. Note that it found 17 columns in that report. Now click on the table itself. A panel will open up showing you the details including the columns that were found, their data types and even an opportunity to profile them
-
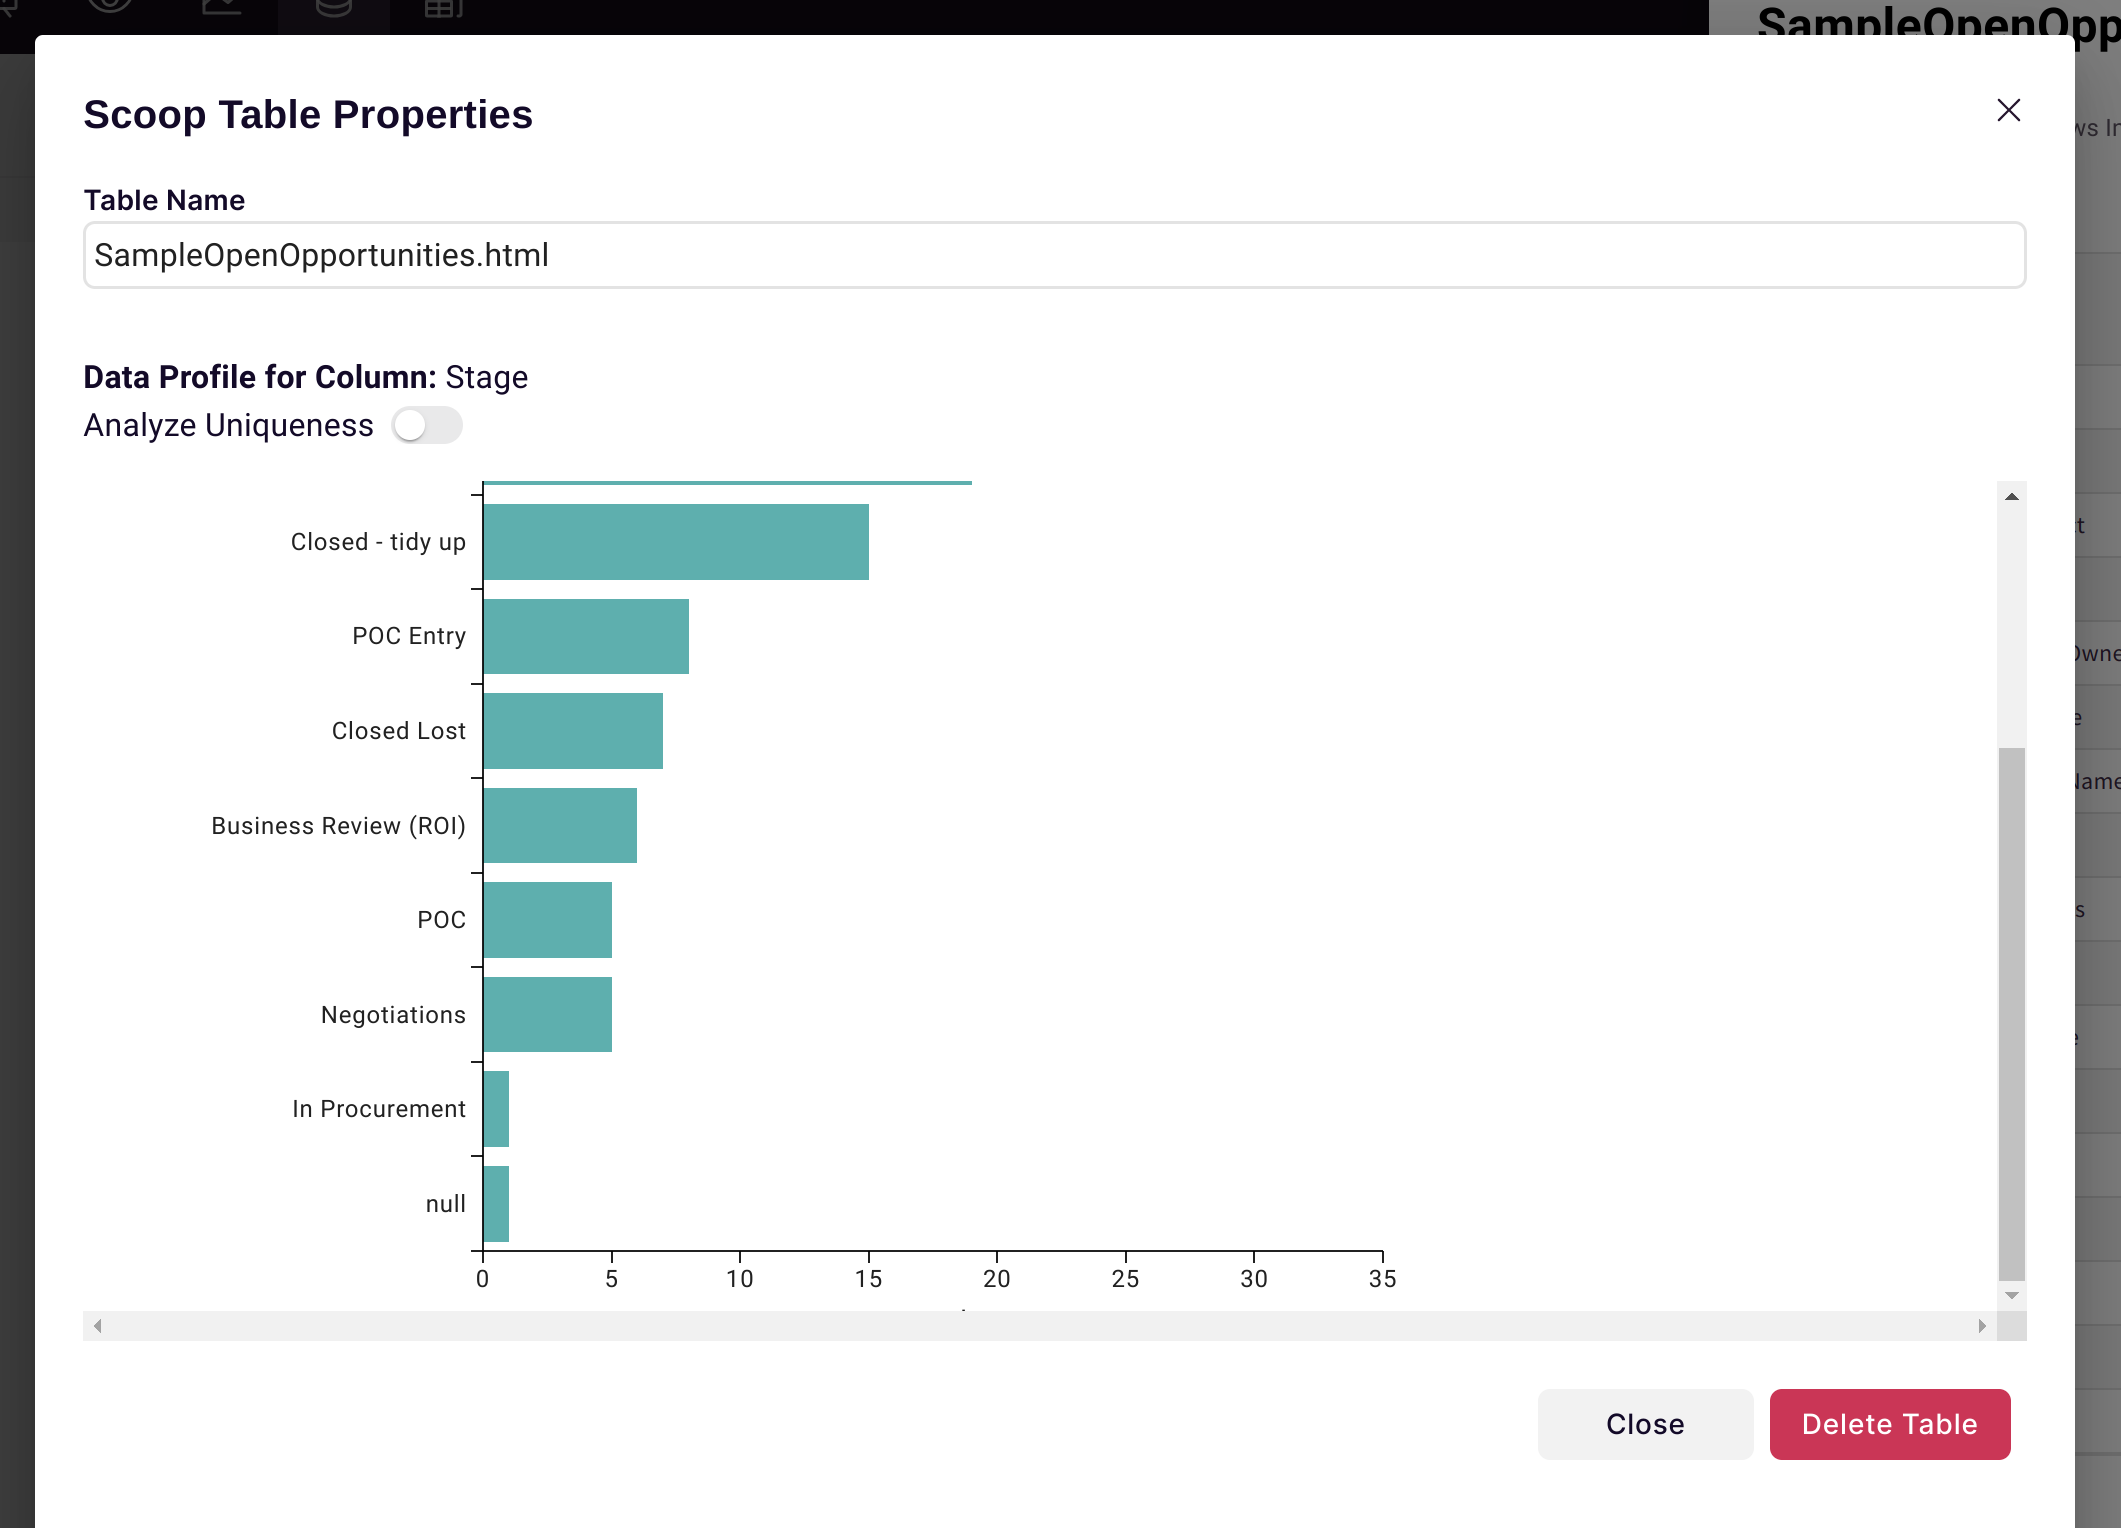
For example, click on View Profile on the line for the column Stage
-
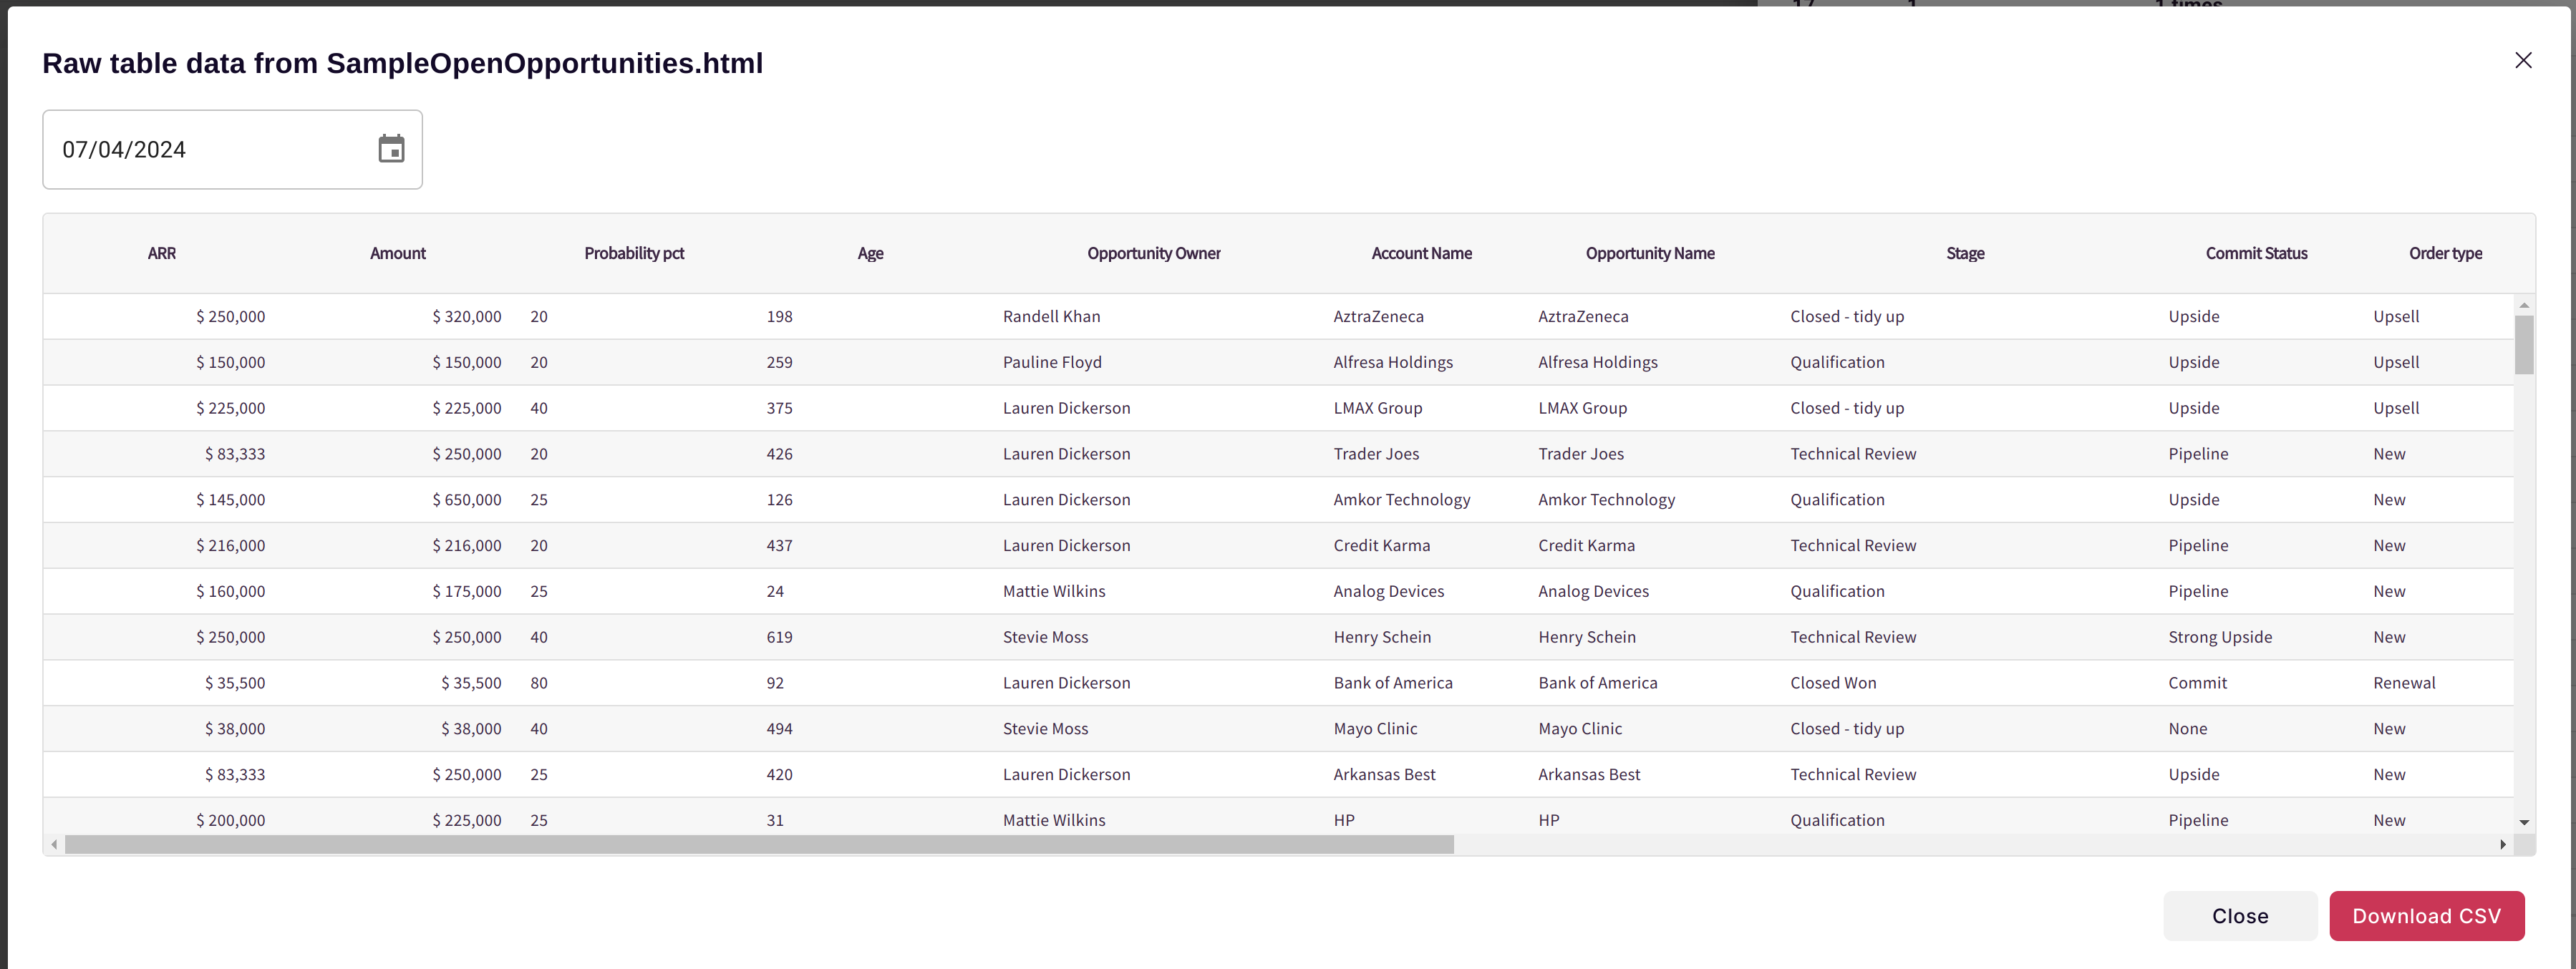
This gives you a quick look at the values in this column and their relative frequency. Hit close and then then click on View Table Data. This will then let you see the data that was just loaded. With this screen you can look at data that was loaded on any date and inspect it.
-
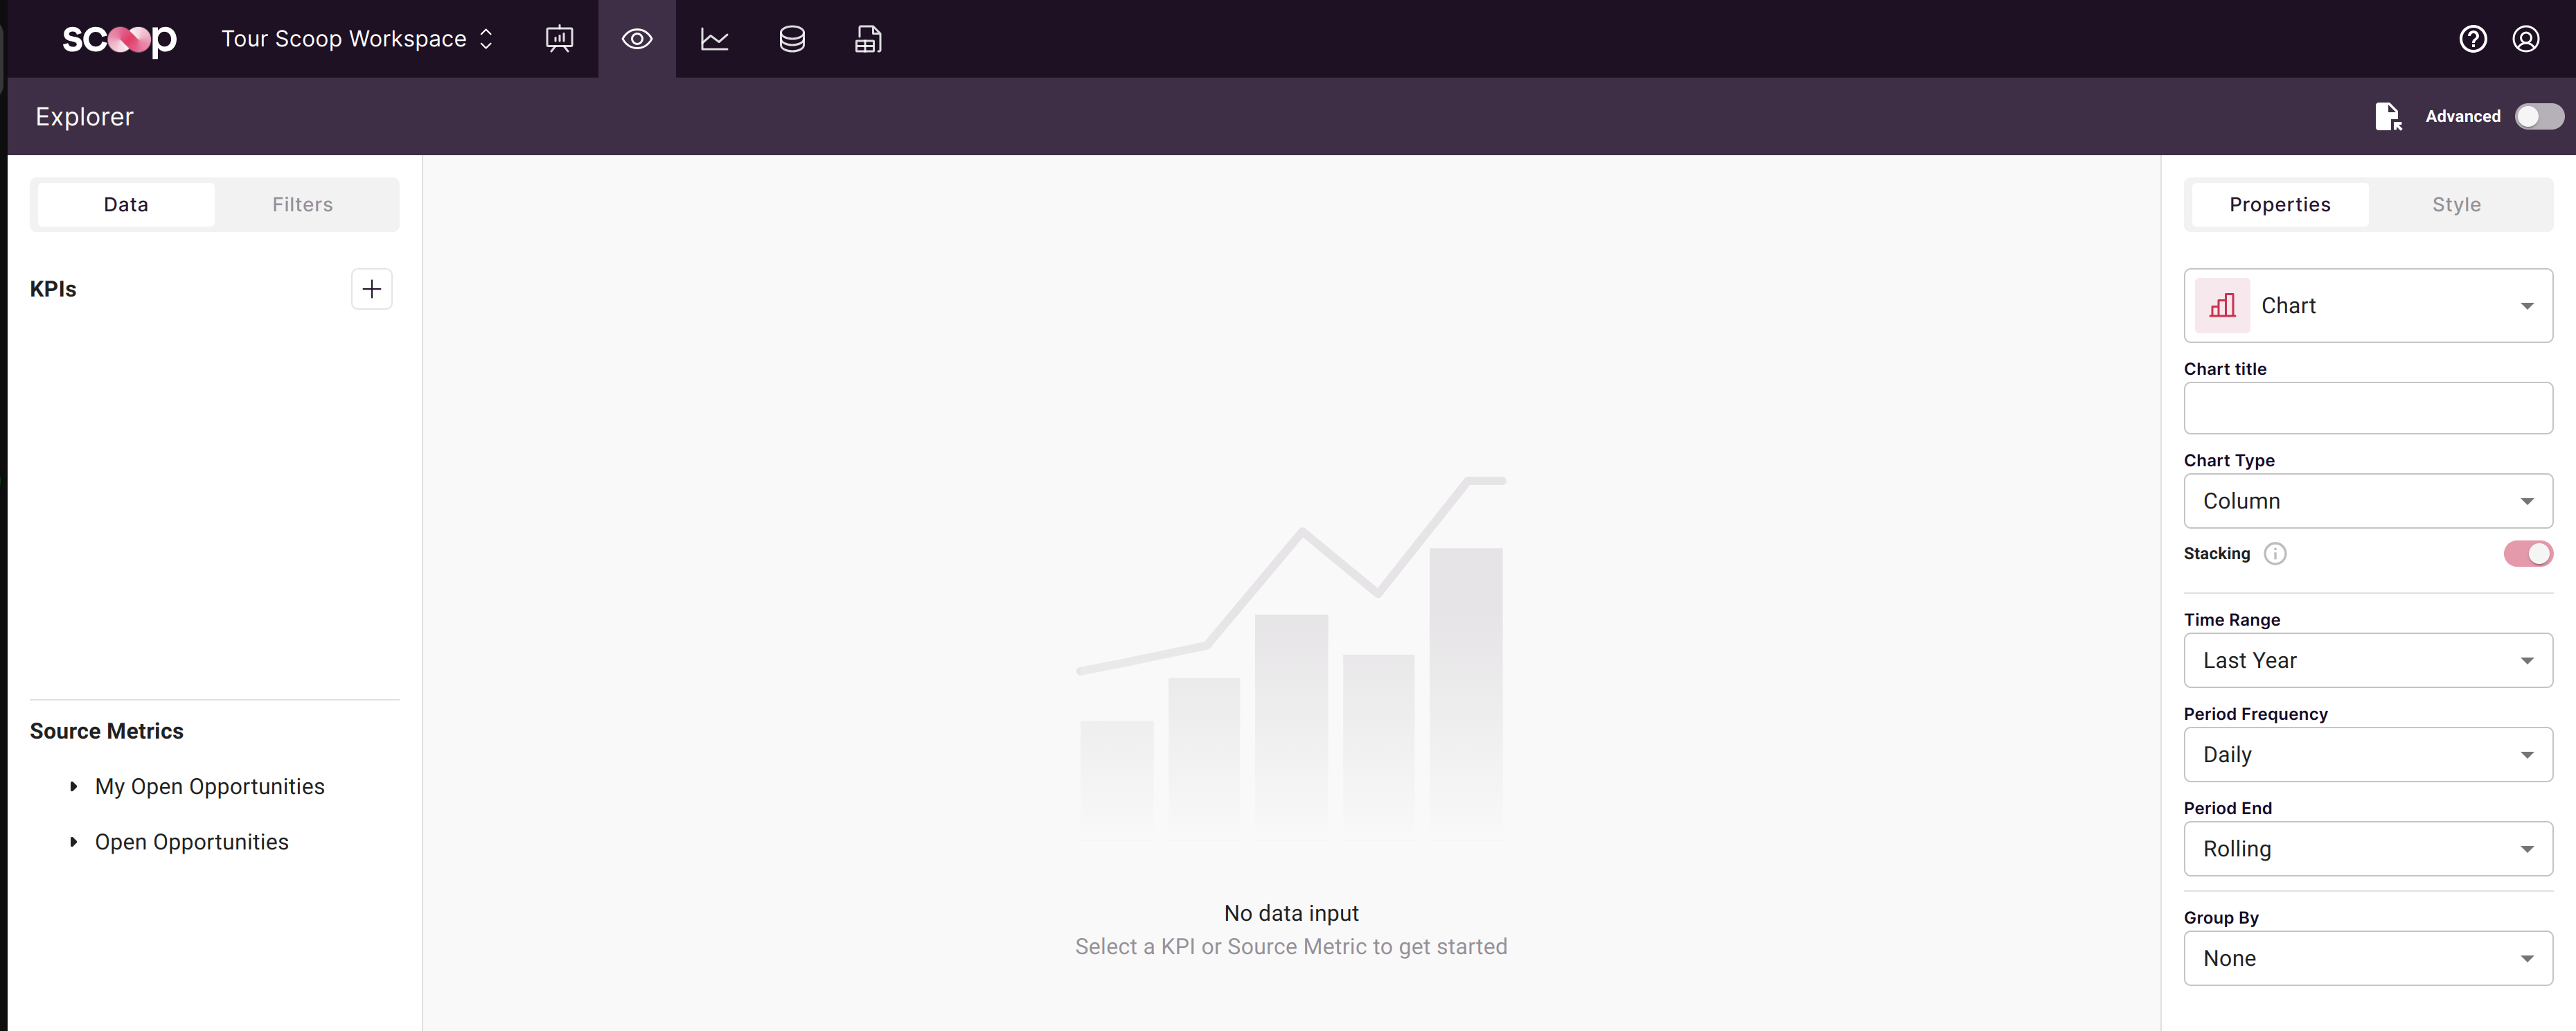
Congratulations! You just loaded your first report into Scoop. Now let's explore it! Click close, then close the panel for this data table. Then click on the eye icon in the upper toolbar (2nd from the left). This will take you Explorer
-
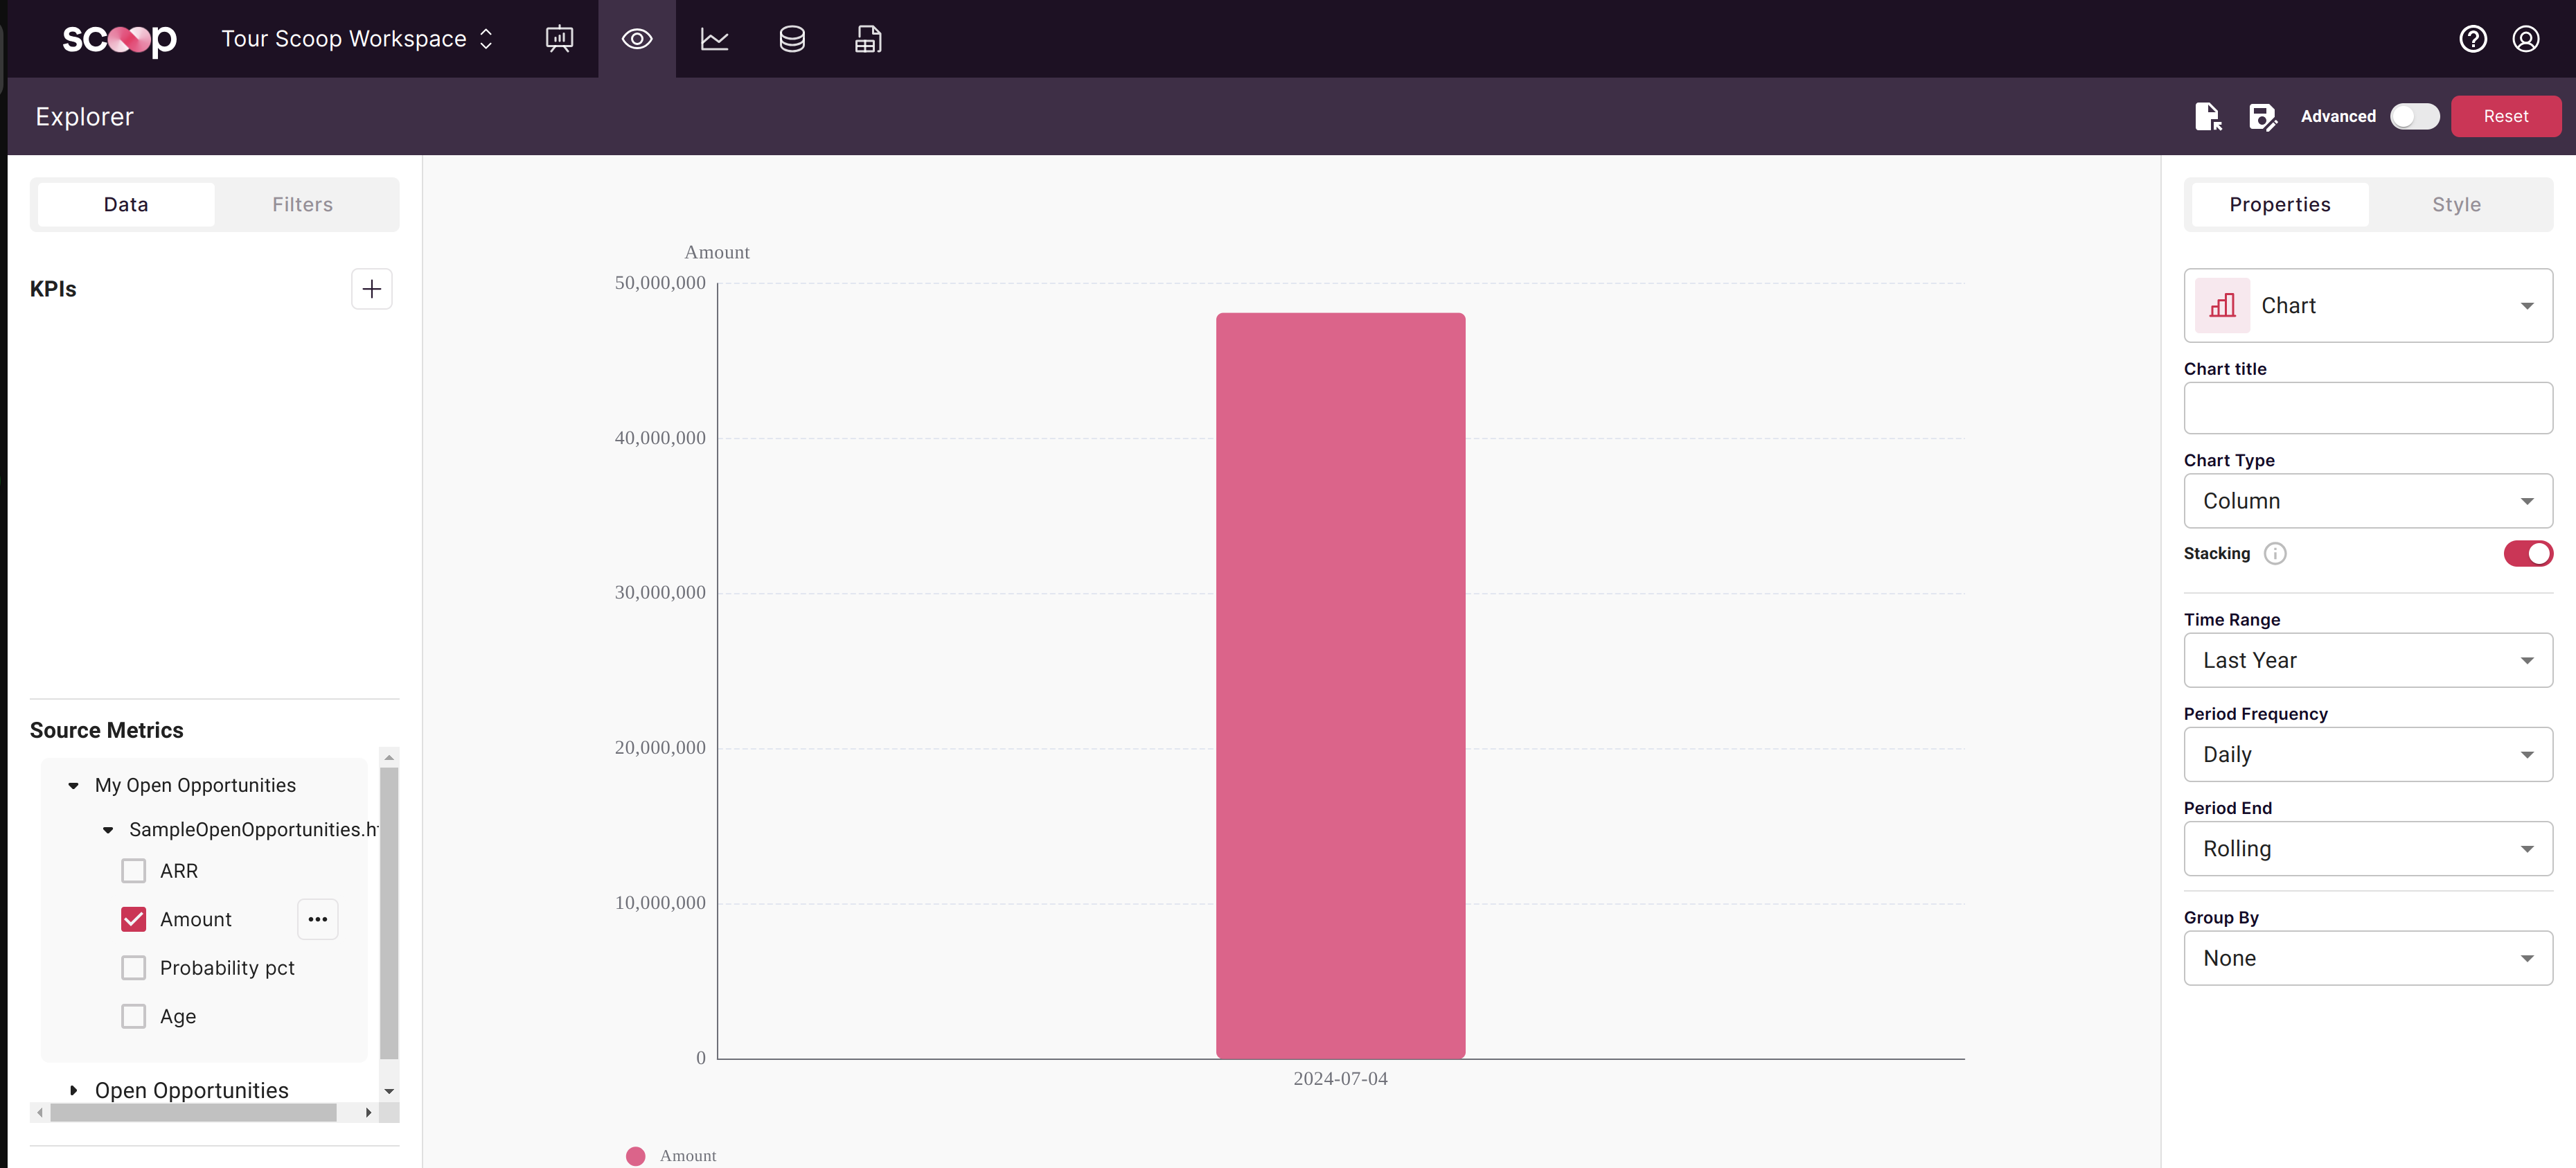
To create our first chart, expand the "My Open Opportunities" tree in the left panel under "Source Metrics". Expand one more level to see the columns in your report. Then click on the column Amount
-
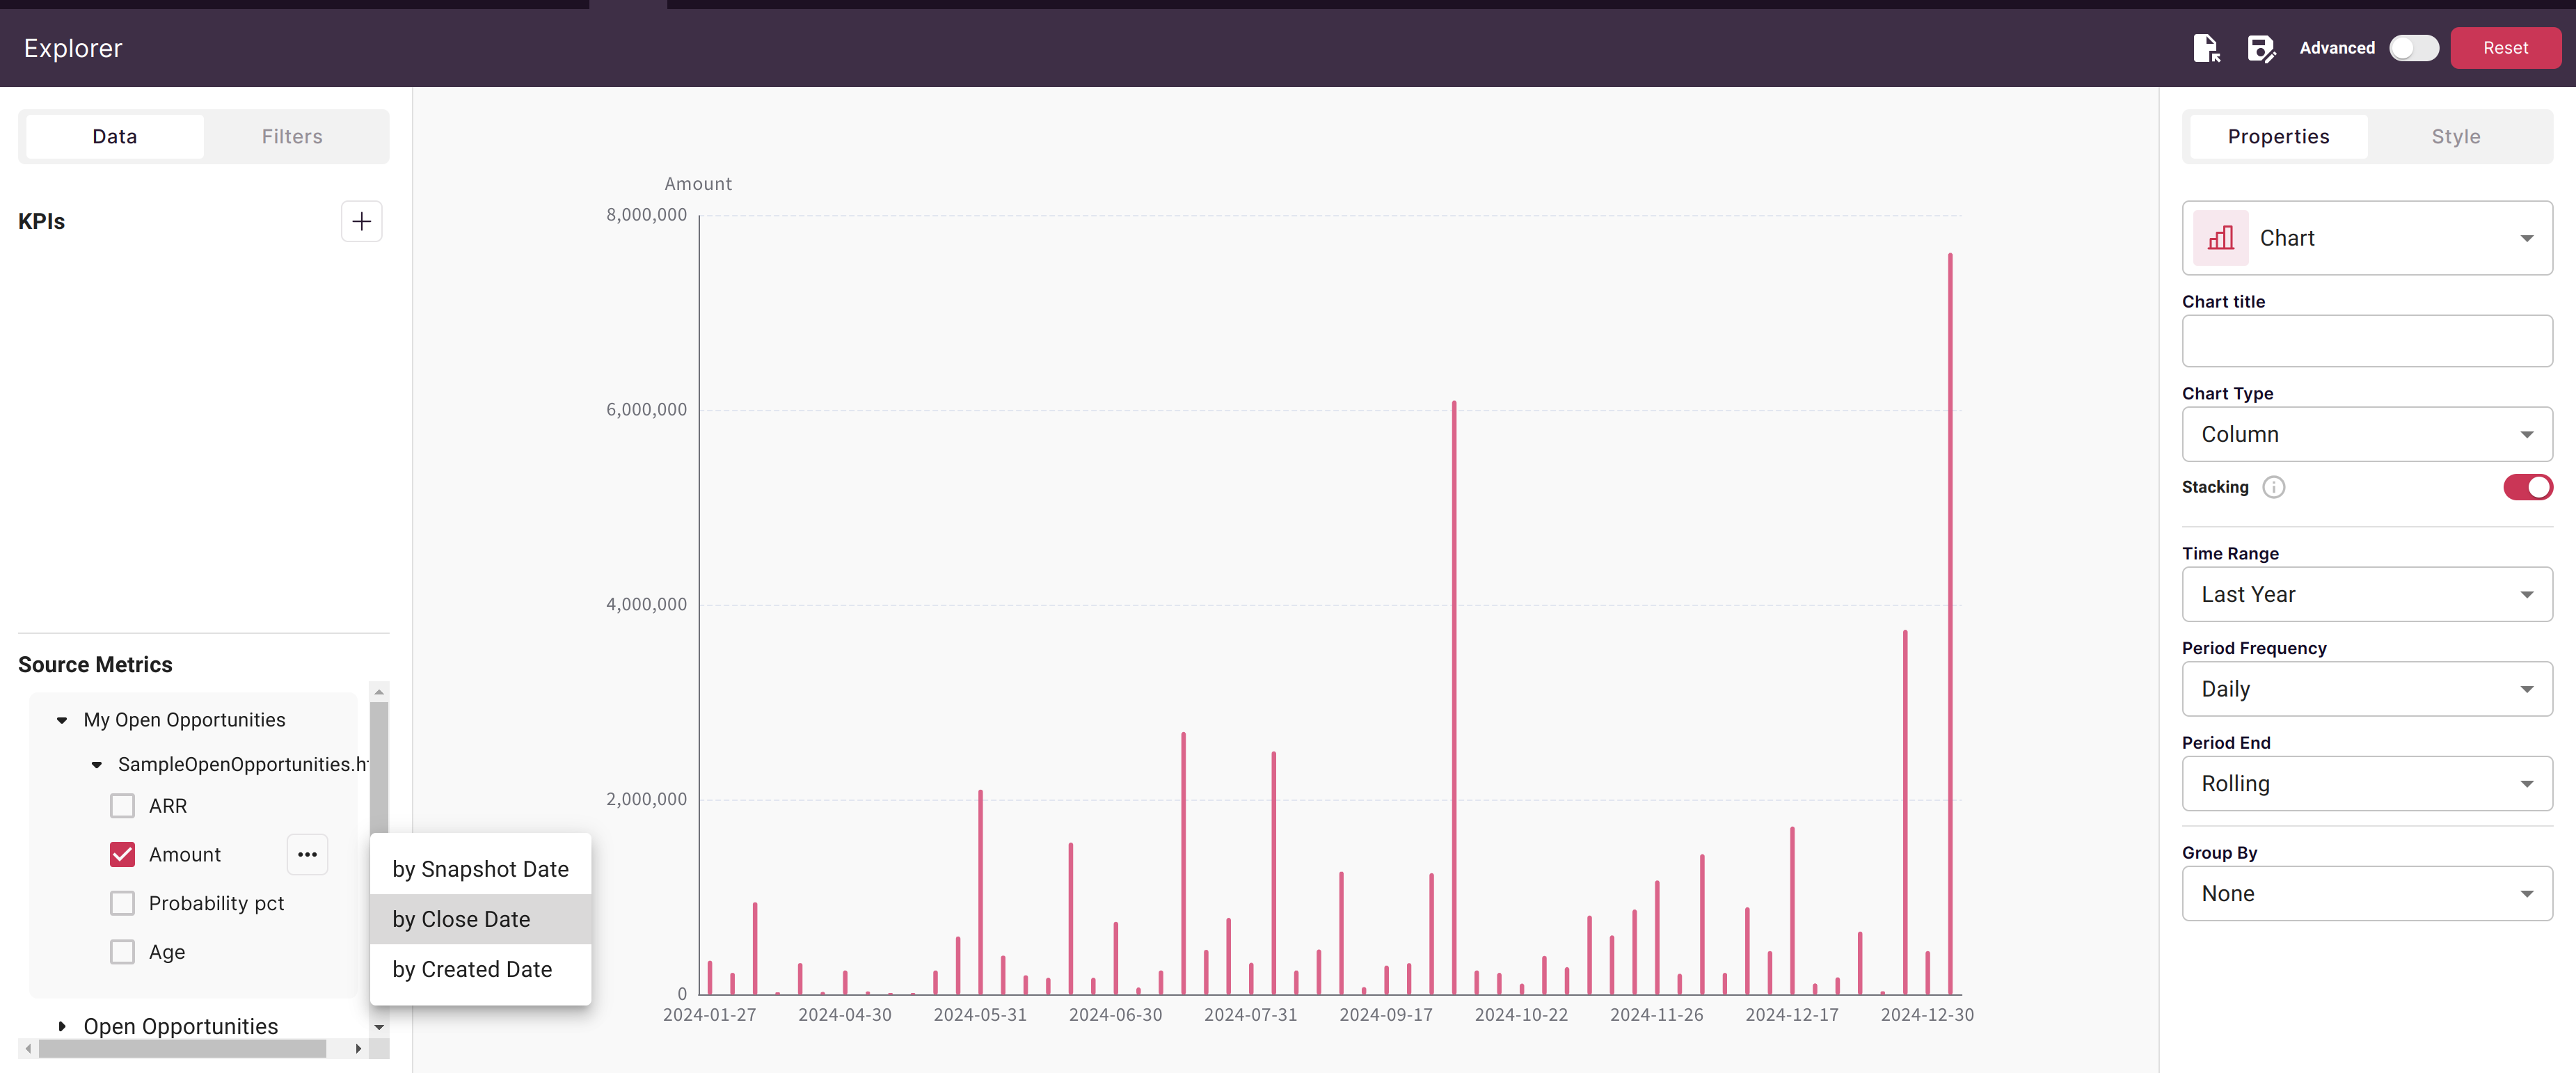
Notice that there is only one bar. That is because by default, Scoop is showing data by the date it was loaded and we have only loaded on report. Click on the three dots next to Amount and then select "Close Date". This tells Scoop to use the close date column in your report as the date to use.
-
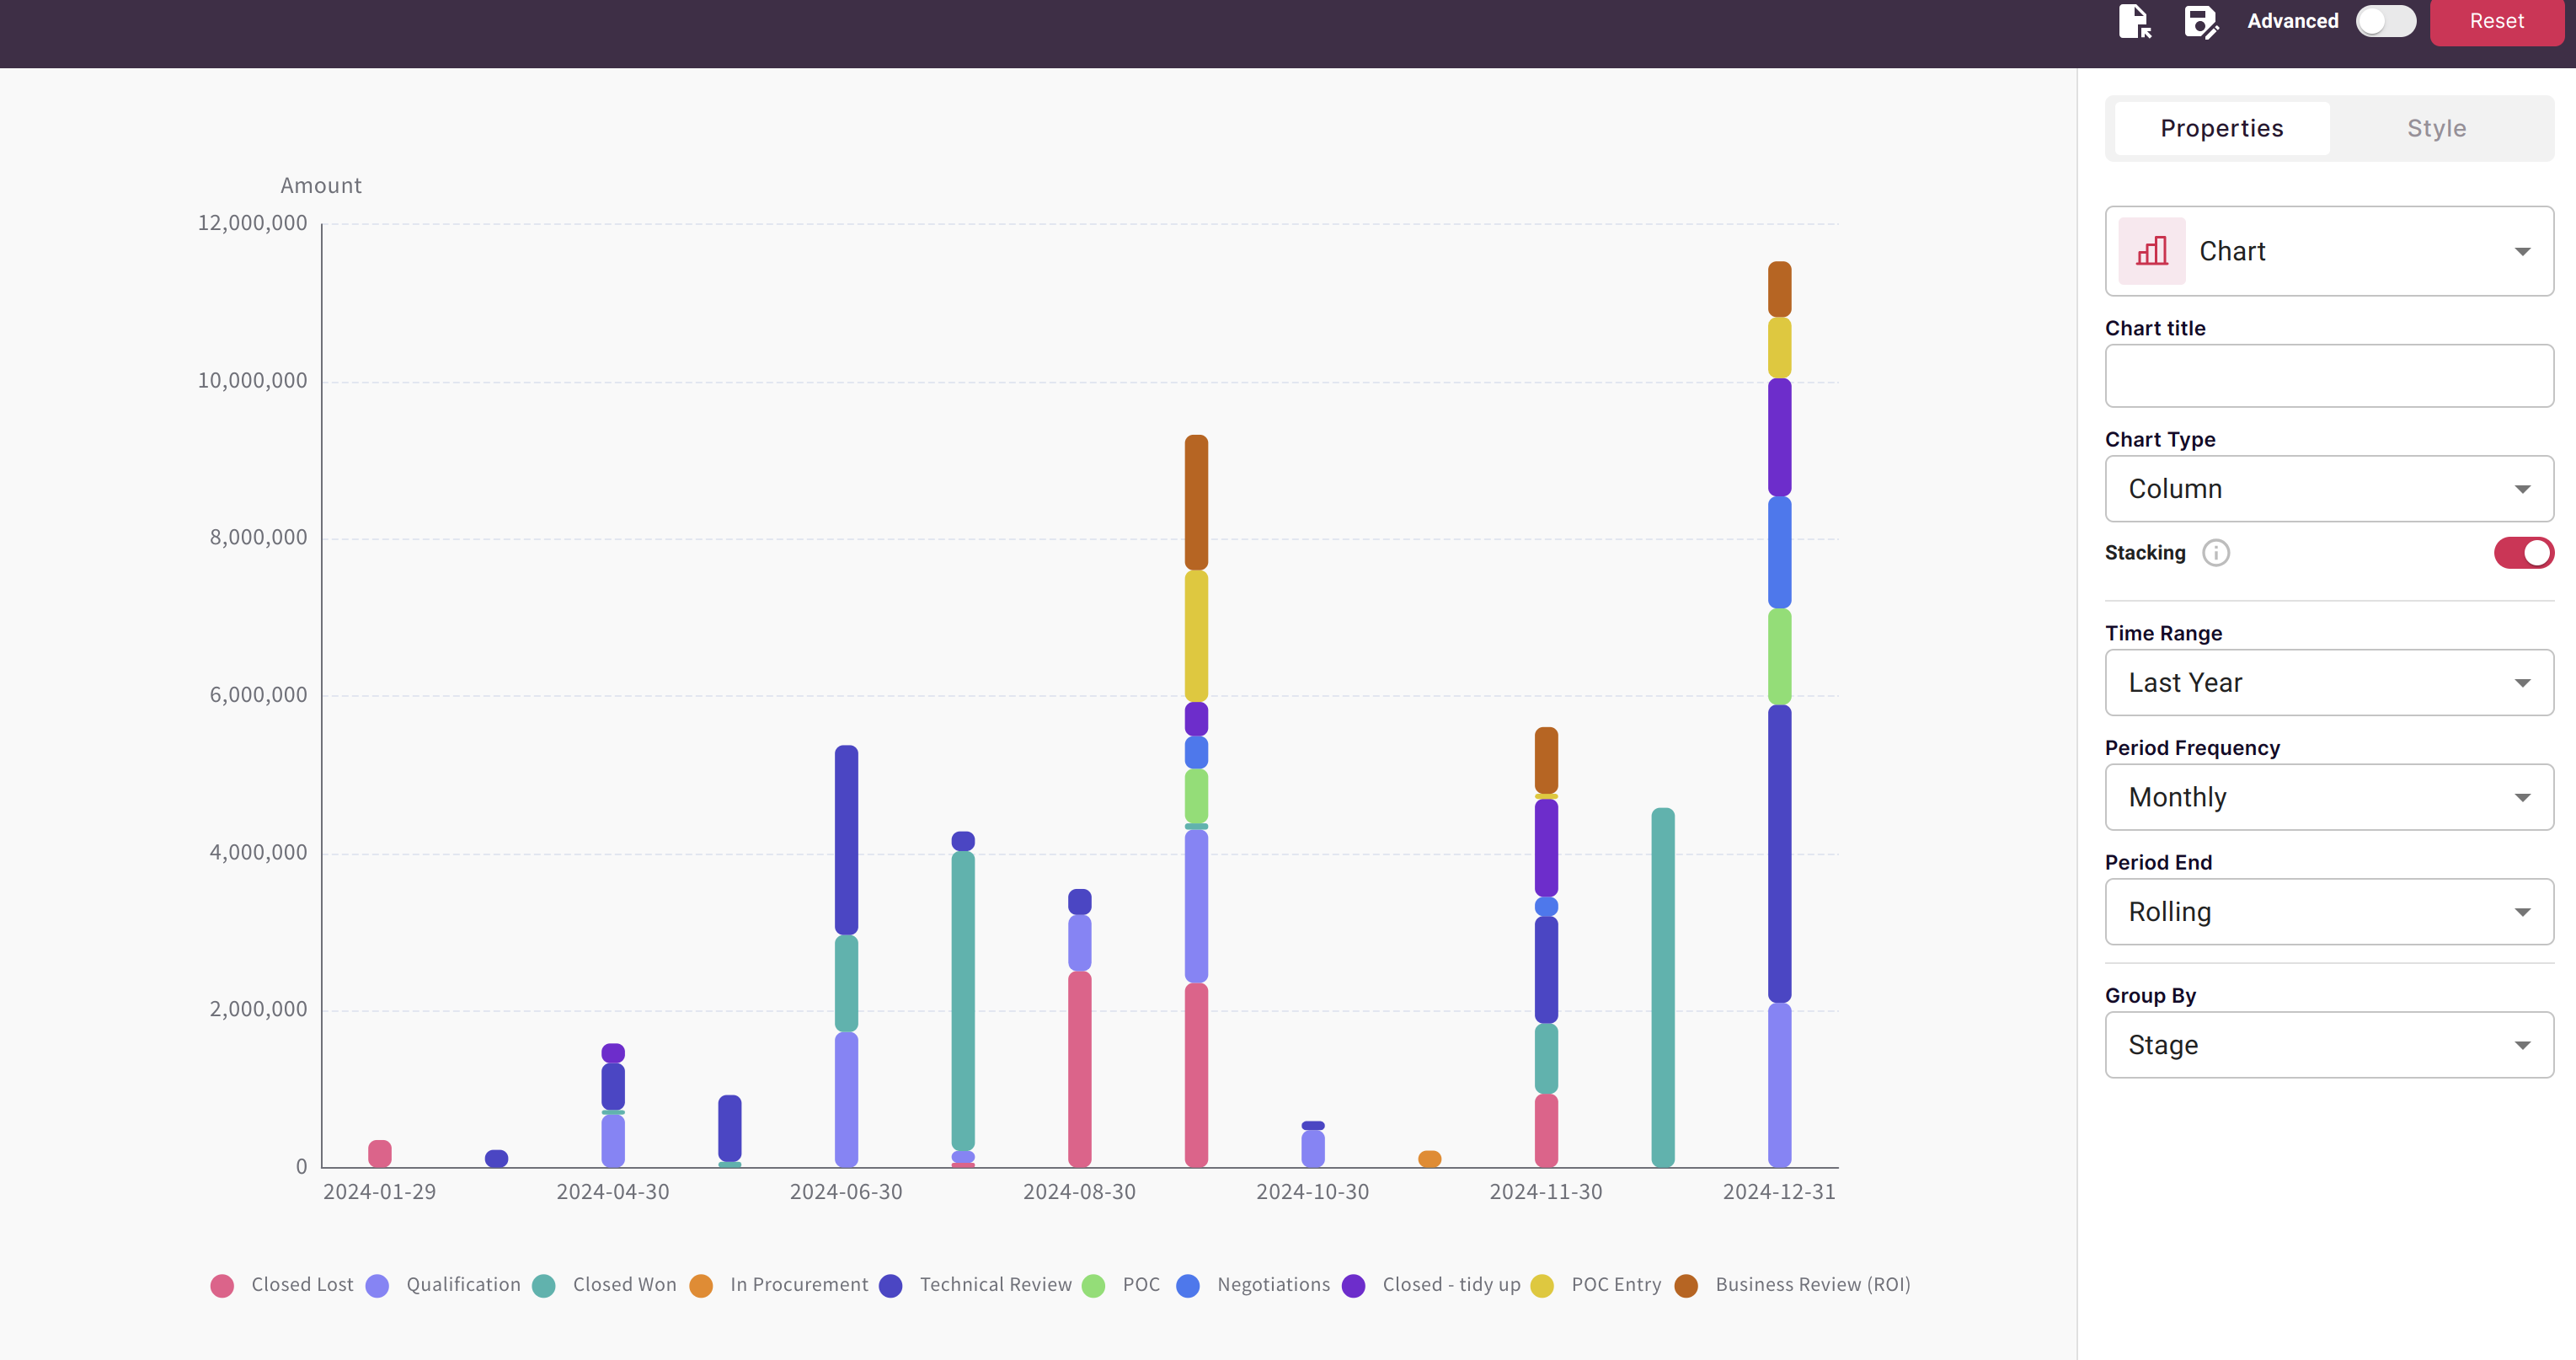
Now change the Group By drop down in the right panel to group this data by the Stage attribute. And then change the frequency drop down to Monthly to see the data aggregated by Month
-
Congratulaions! You've created your first visualization in Scoop analyzing deals that are expected to close over time by their current sales stage.
Updated 25 days ago
