# AI Generated Color Themes
Automatic color schemes that match your presentations
When you import a PowerPoint presentation, Scoop automatically analyzes its colors and generates matching themes for your data visualizations. This ensures your charts and graphs harmonize with your existing design without manual color matching.
# How AI Color Themes Work
```
┌────────────────────────────────────────────────────────────┐
│ 1. IMPORT │
│ Upload PowerPoint → Scoop analyzes colors, fonts │
├────────────────────────────────────────────────────────────┤
│ 2. ANALYZE │
│ AI extracts color palette using color theory │
│ Identifies primary, secondary, accent colors │
├────────────────────────────────────────────────────────────┤
│ 3. GENERATE │
│ Creates two matching themes: │
│ - Standard (subtle, professional) │
│ - Bold (higher contrast, impactful) │
└────────────────────────────────────────────────────────────┘
```
# What Gets Analyzed
Scoop examines your presentation to extract:
| Element | How It's Used |
|---------|---------------|
| **Background colors** | Base palette derivation |
| **Text colors** | Contrast calculations |
| **Accent colors** | Chart highlights and emphasis |
| **Theme colors** | Primary palette foundation |
| **Graphics colors** | Secondary palette elements |
# Generated Themes
For each imported presentation, Scoop generates two AI color themes:
## Standard Theme
- Subtle, professional appearance
- Lower contrast for understated visuals
- Works well for detailed data displays
- Ideal for executive presentations
## Bold Theme
- Higher contrast colors
- More impactful visual presence
- Better for large displays
- Ideal for presentations to larger audiences
# Using AI Themes
## In Explorer
When creating visualizations:
1. Open Explorer with your dataset
2. Create your chart or table
3. Click on **Theme** or **Style** options
4. Select one of the AI-generated themes
## Theme Selection
Your AI themes appear alongside default Scoop themes:
- Named after your presentation
- Available for any visualization in that canvas
- Can be applied to multiple charts for consistency
# Example: Theme Generation
**Original Presentation:**

**Generated Color Scheme:**
**Applied to Visualization:**
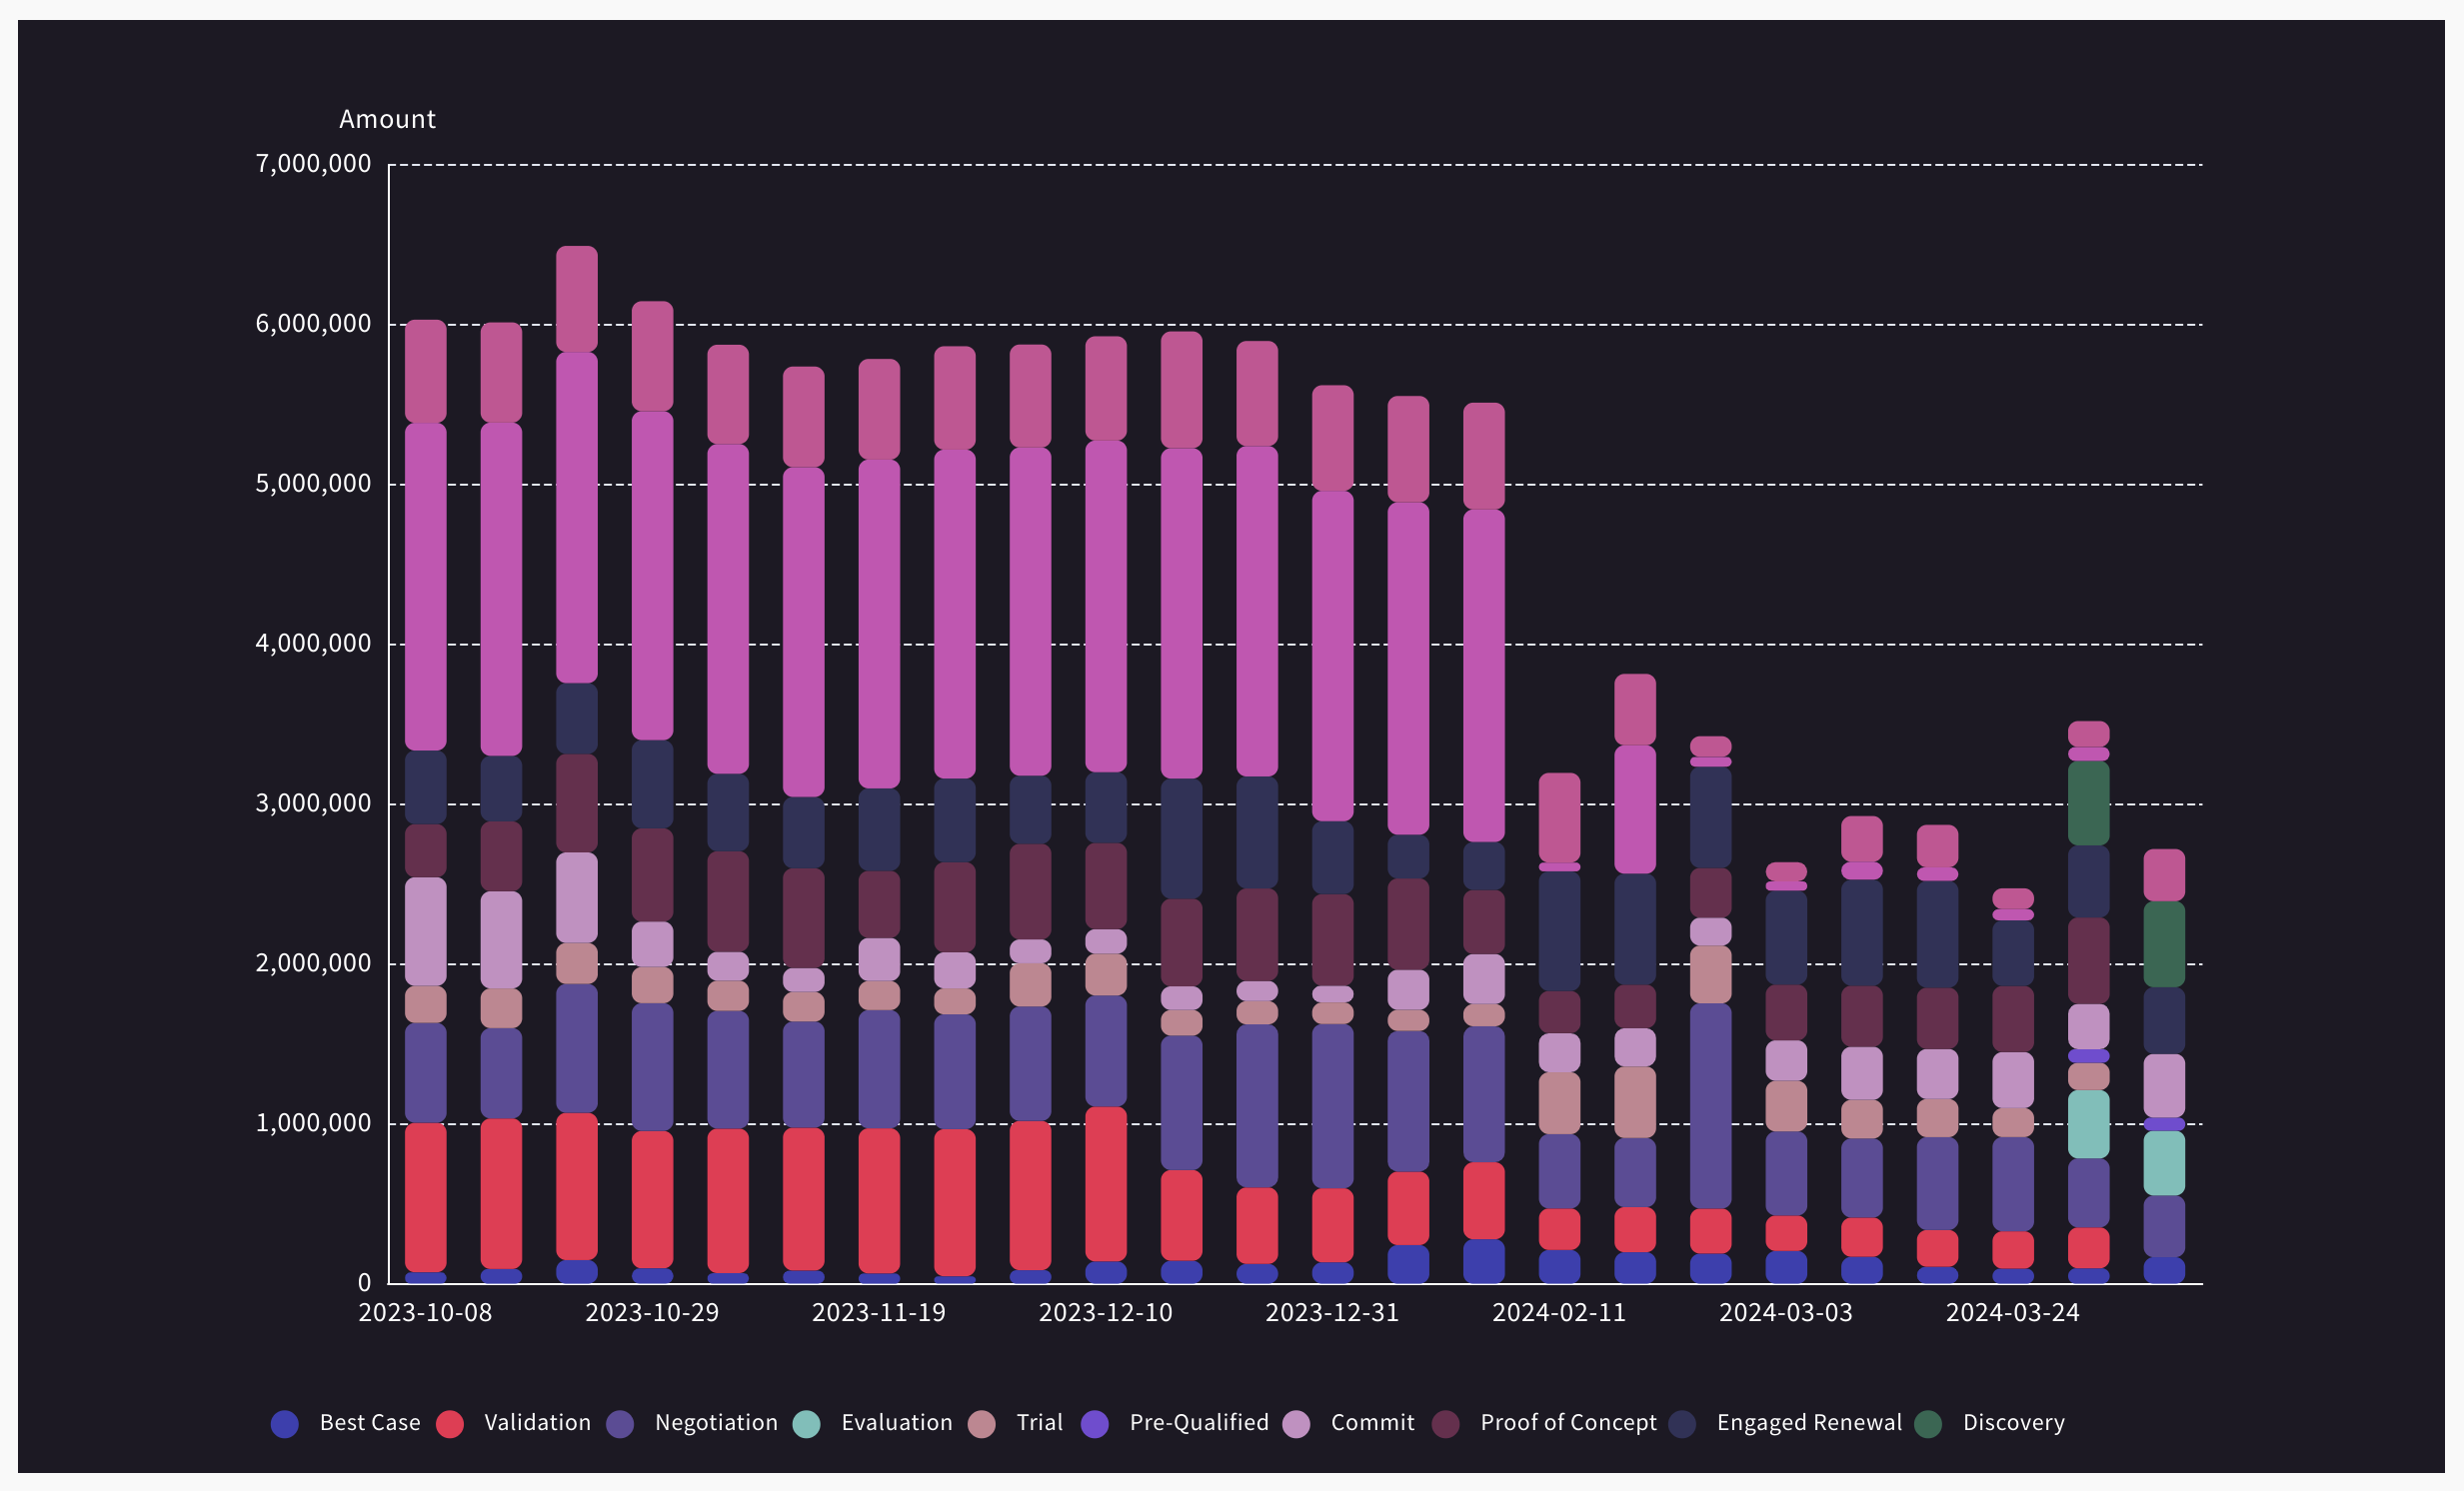
Notice how the chart colors complement the slide design without clashing.
# Color Theory Applied
Scoop's AI uses color theory principles:
| Principle | Application |
|-----------|-------------|
| **Complementary colors** | Ensures chart elements are distinguishable |
| **Color harmony** | Creates pleasing combinations |
| **Contrast ratios** | Maintains readability |
| **Saturation balance** | Prevents visual fatigue |
# Best Practices
## When to Use AI Themes
- **Always** when using imported presentations
- When brand consistency matters
- For client-facing materials
- When design polish is important
## Theme Consistency
- Use the same AI theme across all visualizations in a presentation
- Consider Bold theme for projection, Standard for print
- Test on your actual display environment
## Manual Adjustments
If the AI theme doesn't quite fit:
- Select the closest AI theme as a starting point
- Manually adjust individual chart colors
- Save custom colors for reuse
# Troubleshooting
## Theme Not Generated
- Ensure presentation was imported (not just uploaded as image)
- Check that PowerPoint had defined theme colors
- Try reimporting the presentation
## Colors Don't Match Expectations
- Verify using the AI theme, not a default theme
- Check if presentation had unusual color combinations
- Consider using manual color selection
## Theme Missing in Dropdown
- Refresh the browser
- Verify you're editing the correct canvas
- Check theme settings in canvas properties
# Related Topics
- [Importing PowerPoint](index) - Import presentations into Scoop
- [Visual Themes](../../Exploring%20and%20Visualizing%20Data/visual-themes) - Other theme options
- [Drawing Objects](../canvas-objects/drawing-objects) - Add visual elements